5361
An Analytical Segmented (AS) Approach for Extracting IntraVoxel Incoherent Motion (IVIM) Model Parameters1Physics and Texas Center for Superconductivity, University of Houston, Houston, TX, United States, 2Diagnostic and Interventional Radiology, Baylor St Luke's Medical Center, Houston, TX, United States
Synopsis
Although IVIM model can provide valuable insight into tissue perfusion and microstructure without the need for contrast, the estimation of model parameters with sufficient accuracy continues to be a challenge. In this work, we propose a analytical segmented (AS) approach for estimating IVIM model parameters describing tissue perfusion (Df, and f), and tissue diffusion (Ds), and compare the performance of this work against conventional approaches using numerical simulations. Results from our work suggest that AS approach can minimize errors in the estimation of metrics characterizing perfusion, i.e., f, and Df compared to conventional approaches (full fitting , segmented and oversegmented methods) even for tissues with low Df/Ds ratios.
INTRODUCTION
IVIM model of tissue diffusion accounts for tissue perfusion and diffusion and can provide valuable insight into various pathological processes1,2,3. However, due to the vast differences in the diffusivities between the fluid (perfusion) and tissue compartments, determination of IVIM model parameters –particularly the perfusion indices –remains a challenge and methods proposed to-date can have errors of 50% or more4.
The purpose of this work is twofold: (a) Propose a new analytical segmented (AS) method, to extract IVIM model perfusion related parameters; and (b) to compare the performance of the AS method to widely used conventional methods using numerical simulations.
METHODS
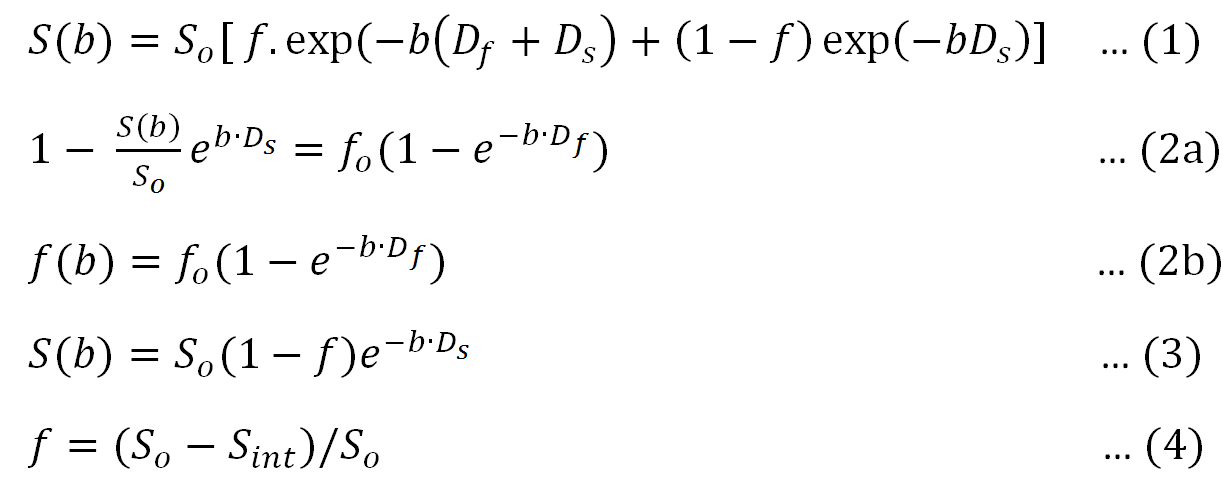
Theory: IVIM model describes MR signal (S) decay due to diffusion weighting (diffusion sensitivity parameter 'b’ in s·mm-2), by equation 15 (Figure 1).
AS method: This approach consists of two steps:
(1) Analogous to other segmented approaches, tissue diffusion (Ds) is estimated by fitting the DWI images with b-values (e.g., b > 200 s·mm-2) large enough to substantially reduce the signal contribution from the high diffusivity perfusion compartment.
(2) By rearranging Equation 1, one obtains Eq. 2a, and we define f(b) (Eq. 2b). Perfusion related parameters (f, Df) are extracted directly by fitting f(b) to Equation 3, (Figure 1).
The three commonly used approaches for extracting IVIM parameters considered are:
(i) Full Method (F): S(b) is fitted to the Eq. 1 using a Nonlinear Least Squares approach to extract IVIM parameters (f, Df, and Ds).
(ii) Segmented Method (S): This method exploits the clinical observation that Df is often one or two orders of magnitude greater than Ds7, and therefore the S(b) at high b values are not affected by the perfusion component. In the first step, Ds is extracted by fitting signal acquired at high b values using equation 3, and rest of the parameters (f, Df) are estimated by fitting Equation 1, with the additional knowledge of Ds.
(iii) Oversegmented Method (OS): The first part of OS approach is similar to that of segmented approach after which the fitted monoexponential is extrapolated to obtain S-intercept and then f is calculated using Equation 4. Df is estimated by fitting the entire signal into IVIM equation after fixing both f and Ds estimated in previous steps.
Numerical Simulations: MR signal was simulated using Eq. 1 for tissues with a broad range of Df /Ds ratios ranging from 1 to 50 in increments of 1, f values ranging from 1-50% in increments of 1%, and a Ds value of 0.001, resulting in 2500 numerical tissue samples. Gaussian noise was added to generate MR signal for each sample at SNR levels of 10, 20 and 50. Eight b values(0,10,50,100,150,200,250,400,800 s·mm-2) were used . Each sample was simulated 200 times.
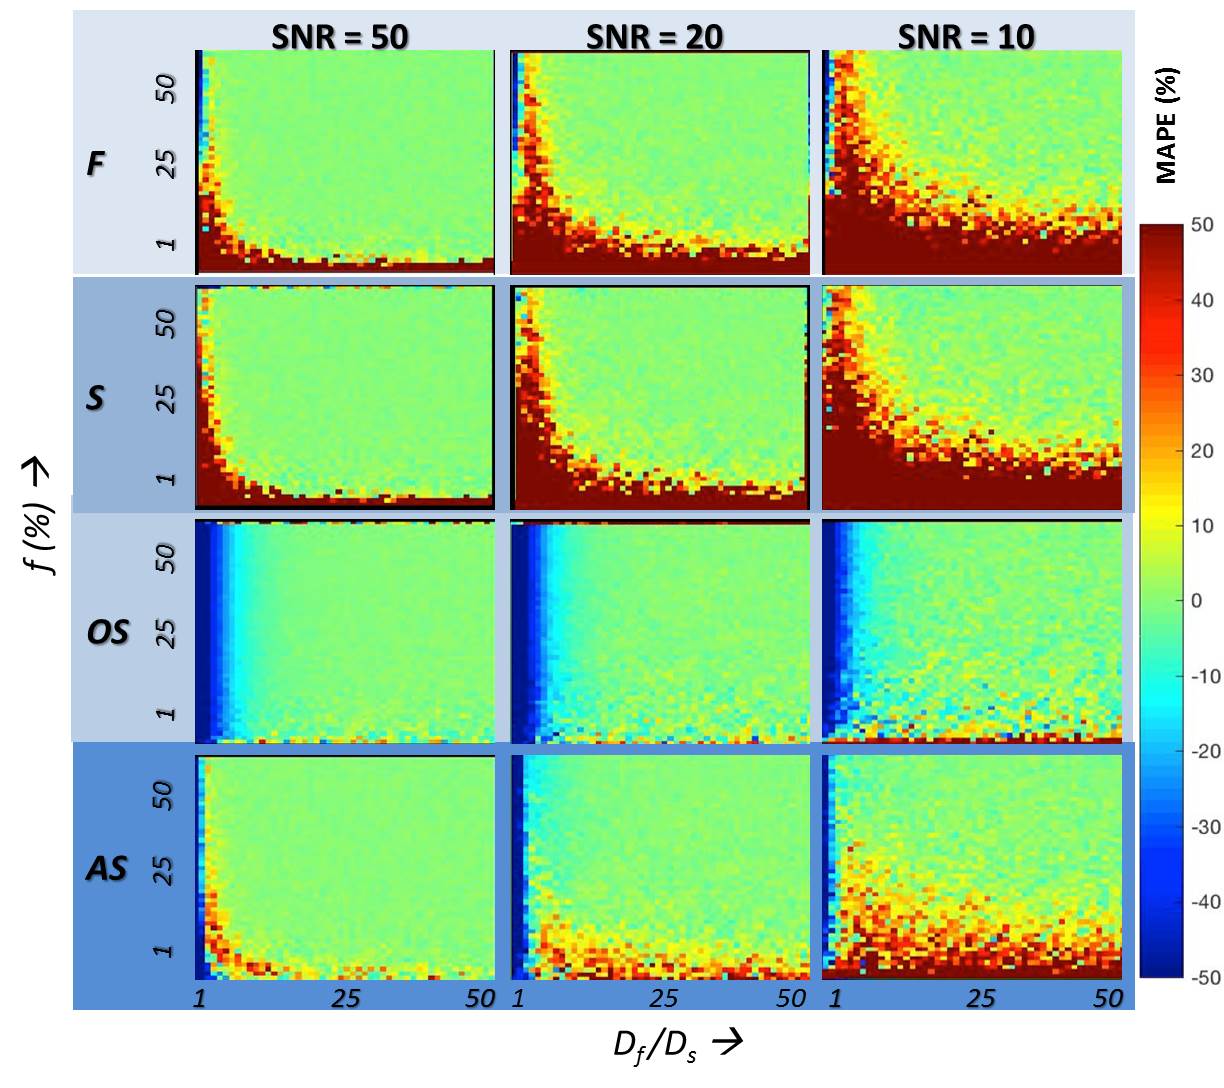
Data Analysis: Mean average percentage error (MAPE) for each parameter (f, and Df) was calculated as the ratio of the signal difference between the estimated and true value of the parameter normalized by the true value of the parameter, and expressed as a percentage, for each of four analysis methods considered.
RESULTS
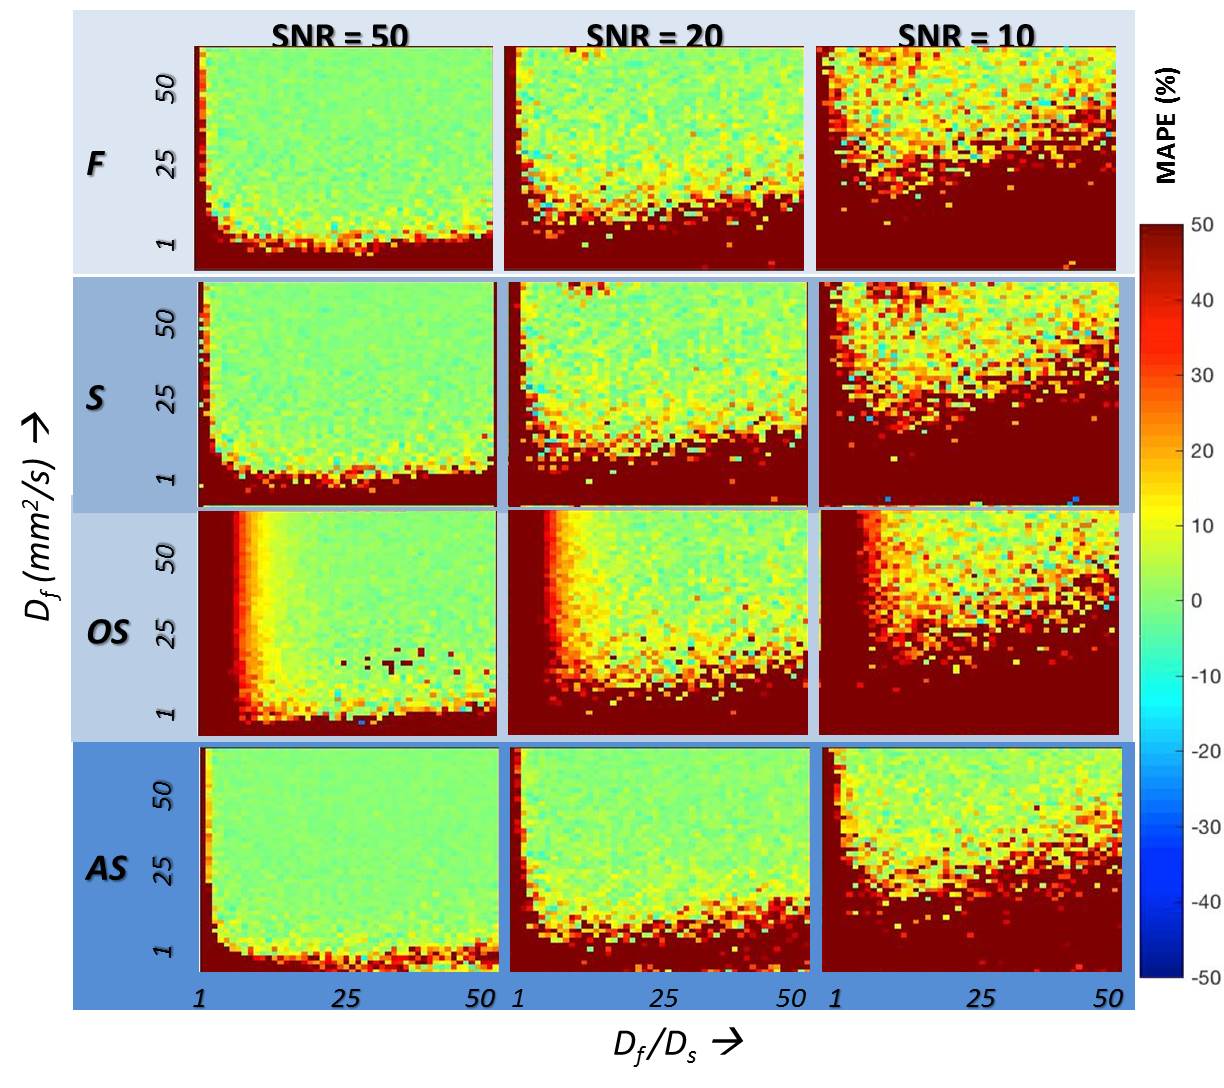
MAPE for the estimation of f and Df for the range of tissue models and for the four methods is given in Figures 2 and 3 respectively. A brief summary of key results are:
(a) Among the conventional methods (F, S, and OS), the OS method outperforms F and S when the Df /Ds ratio is >15, for the estimation of both f and Df at all SNR levels independent of the f-value.
(b) The proposed AS method outperforms the OS method at even lower Df /Ds ratios (>5) when estimating f.
(c) At all Df /Ds ratios, AS method outperforms F, S, and OS methods, at all SNR levels in the estimation of Df.
DISCUSSION AND CONCLUSION
While both S and AS methods simultaneously estimate (f, and Df), AS method performs better than the S method for estimating both f and Df, across the range of Df /Ds at all SNR levels. While the OS method is superior in the estimation of f when Df /Ds ratio is >15, the proposed AS method outperforms the OS method at even lower Df /Ds ratios (>5) at all SNR levels. Recent work by Jerome et al and others suggest that IVIM based estimation of f needs to be corrected for T2 difference between the two compartments6. Equation 2 proposed here needs to extended to include the T2 effect.
The proposed AS approach would be preferred where both f and Df are of interest as well as when Df /Ds ratio is expected to be <15 while OS would be preferred where only f is of interest and the expected Df /Ds ratio is >15.
Acknowledgements
No acknowledgement found.References
1. Federau, C., Sumer, S., Becce, F., Maeder, P., O’Brien, K., Meuli, R., & Wintermark, M. (2014). Intravoxel incoherent motion perfusion imaging in acute stroke: initial clinical experience. Neuroradiology, 56(8), 629-635.
2. Cho, G. Y., Moy, L., Zhang, J. L., Baete, S., Lattanzi, R., Moccaldi, M., ... & Sigmund, E. E. (2015). Comparison of fitting methods and b‐value sampling strategies for intravoxel incoherent motion in breast cancer. Magnetic resonance in medicine, 74(4), 1077-1085.
3. Togao, O., Hiwatashi, A., Yamashita, K., Kikuchi, K., Mizoguchi, M., Yoshimoto, K., ... & Honda, H. (2015). Differentiation of high-grade and low-grade diffuse gliomas by intravoxel incoherent motion MR imaging. Neuro-oncology, 18(1), 132-141.
4. Andreou, A., Koh, D. M., Collins, D. J., Blackledge, M., Wallace, T., Leach, M. O., & Orton, M. R. (2013). Measurement reproducibility of perfusion fraction and pseudodiffusion coefficient derived by intravoxel incoherent motion diffusion-weighted MR imaging in normal liver and metastases. European radiology, 23(2), 428-434.
5. Le Bihan, D., Breton, E., Lallemand, D., Aubin, M. L., Vignaud, J., & Laval-Jeantet, M. (1988). Separation of diffusion and perfusion in intravoxel incoherent motion MR imaging. Radiology, 168(2), 497-505.
6. Jerome, N. P., d’Arcy, J. A., Feiweier, T., Koh, D. M., Leach, M. O., Collins, D. J., & Orton, M. R. (2016). Extended T2-IVIM model for correction of TE dependence of pseudo-diffusion volume fraction in clinical diffusion-weighted magnetic resonance imaging. Physics in medicine and biology, 61(24), N667.
7. Le Bihan, D. (2008). Intravoxel incoherent motion perfusion MR imaging: a wake-up call. Radiology, 249(3), 748-752.
Figures