5359
Differential Diagnosis of Intrahepatic Cholangiocarcinoma and Hepatocellular Carcinoma by Using Diffusion-tensor ImagingLihua Chen1, Ailian Liu2, Qingwei Song2, and Lizhi Xie3
1The First Affiliated Hospital of DaLian Medical University, Dalian, China, 2The First Affiliated Hospital of Dalian Medical University, Dalian, China, 3GE Healthcare, MR Research China, Beijing, China
Synopsis
The advent of functional MR imaging has facilitated an increased role for imaging in risk stratification and treatment planning. In this study, DTI and DWI MR measurements were performed to investigate the correlation of the FA and ADC values in ROIs of the intrahepatic cholangiocarcinoma (ICC) and hepatocellular carcinoma (HCC), and in further the sensitivity, specificity and accuracy of the parameters for the diagnosis. DTI working at present scanning hardware are more capable to detect the pathophysiological changes unattainable compare to conventional MRI techniques.
Target audience
Physicians and scientists, interested in the diagnosis of intrahepatic cholangiocarcinoma and hepatocellular carcinoma, and the application of DTI in abdomen.Purpose
To evaluate and compare the FA of DTI and the ADC of DWI in differentiating intrahepatic cholangiocarcinoma (ICC) and hepatocellular carcinoma (HCC) .Introduction
While biopsy and alpha fetal protein testing have been the primary tools used for tumour detection, these methods have clear limitations of prone to result in missed diagnoses of cancer. Magnetic resonance (MR) imaging was previously ordered in routine most commonly for disease staging, while the multi-parametric MR imaging has facilitated an increased role for imaging in risk stratification and treatment planning1. Among various functional MR imaging techniques, diffusion-weighted imaging (DWI) is well accepted and applied as a clinical marker of tumor aggressiveness, Ichikawa et al.2 suggested that ADC must be obtained right lobe on high b value DWI for limitation of perfusion effect. At high b values, the contribution of perfusion effect to the ADC values and T2 effect on trace images decrease. The FA value of DTI reflects the direction of molecular motion, can probe the microscopic structure and the pathological changes of the organism.Methods
Forty two patients were recruited in the study. All the patients who have written informed consent obtained were performed MRI exams on a 1.5T MR system (GE-Signa HDXT) in a protocol containing the routine T1WI, T2WI, contrast-enhanced MRI, DWI(b value=0, 600s/mm2) and DTI (b value=0, 600s/mm2, in 6 directions). From the following histopathological examination, it was confirmed that ICC was in 10 and HCC was in 32. The MR images (Fig 1) were blindly reviewed and analyzed by two observers who have 3 and 10 years’ experience of MR diagnosis respectively, and the values of ADC and FA of the focus measured using the FuncTool on GE AW4.4 workstation.The SPSS17.0 statistical software has been used for the data analysis, P value less than 0.05 was considered statistically significant. Intraclass correlation coefficient test (ICC-test) was applied to test the consistency of two observers; compared FA value and ADC value of two groups by t-test.Results and Discussion
The ICC-test value of the DWI parameter (ADC) and DTI parameters (ADC and FA) were all greater than 0.75 in the ICC group and HCC group, exhibiting an amenable consistency, Table 1. The mean FA of ICC (0.495±0191) were significantly higher (p < 0.01) than the HCC (0.342±0.165), while the mean ADC of DWI and DTI in ICC group were all found to be lower (p > 0.05) than that in HCC group, Table 2. FA value of DTI reflects the direction of water molecule explicitly, it shows bigger anisotropy and better direction when its value was close to 1. In this study, the FA value of ICC group was higher than that of HCC group, considering the causes for the cancer cells of ICC were small focal nests which contain lots of fibrous connective tissue with strong direction.The FA value of DTI showed a stronger capability than the ADC value of DWI and DTI in differentiating the ICC from HCC. The FA values of DTI are suggested to be measured in diagnosis of ICC and HCC.Acknowledgements
No acknowledgement found.References
[1] Turkey B, et al. Am J Roentgenol, 2009, 192(6): 1471-1480. [2] Mesude T, et al. European Journal of Radiology, 2013, 82(2):203-207.Figures
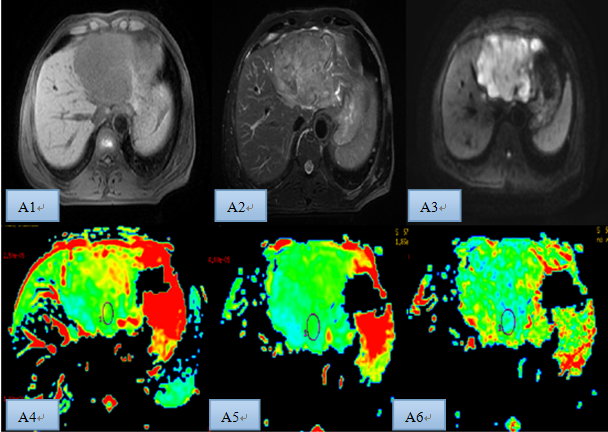
Patient, male, 57 years old, ICC in the caudate lobe of liver. A-C: shows the T1W
image (hypointense), T2W image (hyperintense), and DWI image (hyperintense)
respectively. D-F: shows ADC image of DWI, D, and FA image of DTI respectively.
The ADC, D, and FA values were 1.155×10⁻⁹m2/s,
1.465×10⁻⁹m2/s, and 0.571.

Patient, male, 62 years old, HCC in the right
lobe of liver. A-C: shows the T1W image (hypointense), T2W image
(hyperintense), and DWI image (hyperintense) respectively. D-F: shows ADC image
of DWI, D, and FA image of DTI respectively. The ADC, D and FA values were 1.350×10⁻⁹m2/s, 1.655×10⁻⁹m2/s,
and 0.399.
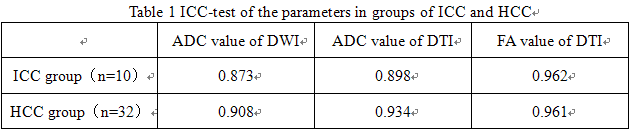
The Intraclass
correlation coefficient value of all the parameters were higher than 0.90.
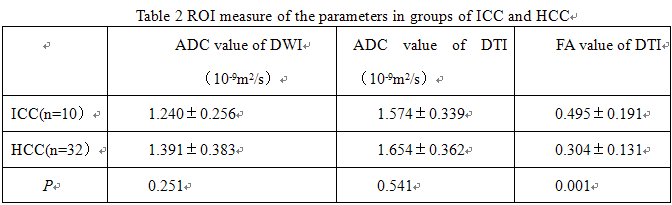
FA value of ICC group was significantly higher than
HCC.