5357
Intravoxel Incoherent Motion Imaging of Thermoregulation in Skeletal Muscle1Radiation Oncology, Erasmus Medical Center, Rotterdam, Netherlands, 2Radiology Department, Erasmus Medical Center, Rotterdam, Netherlands
Synopsis
Accurate temperature dependent perfusion maps are needed for accurate thermal modelling. In this study, perfusion maps were created for human leg muscle at rest and under cold stress using Intravoxel Incoherent Motion (IVIM) Diffusion Weighted Imaging. IVIM parameters decreasesignificantly under cold stress. Consistency of inter-subject measurements proved IVIM method is suitable for imaging temperature dependent perfusion maps.
Introduction
During radio frequency hyperthermia, heating to 40-44°C is used to selectively sensitize tumor cells for ionizing radiation1. Amongst others2, perfusion plays an important role in the effectiveness of hyperthermia but the focus of dosimetry is currently only on heating. In addition, current thermal modeling is unable to accurately predict the distribution of tissue temperature due to the absence of quantitative perfusion measurements in humans under heat-stress conditions, i.e. thermoregulation. Current knowledge is based on a studies conducted on dog and mice3,4. In order to fill these gaps in human perfusion dosimetry and thermal modelling, a method is needed that allows repeatable imaging, i.e. without "exogeneous contrast injection", imaging of perfusion in humans. Intravoxel Incoherent Motion (IVIM) imaging, first described by Le Bihan in 19885 and previously shown feasible for dynamic body perfusion measurements6, may be a suitable candidate for this application. The purpose of this study was to investigate the feasibility of using IVIM for monitoring thermoregulation related changes in perfusion. Hereto, IVIM parameters and T1, as temperature surrogate, of human leg muscle were measured before and after cold stress.Methods
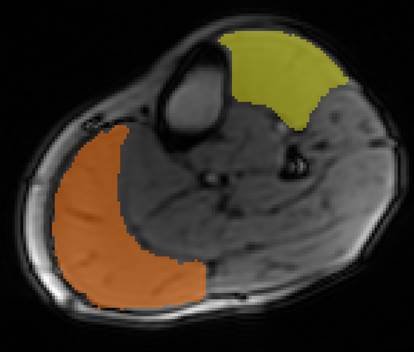
Right leg calf muscles of three healthy volunteers were scanned three times; at rest, after cooling by a dedicated ice pack for 45 minutes, and 45 minutes after the cooling was stopped. Ice pack was wrapped around the leg and stress was mainly directed to the orange region of interest (ROI), illustrated in Figure 1. MR images were acquired on a 1.5T GE MR450w scanner (GE Healthcare, Waukesha, WI) with 16-channel wrap around coil. A standard single shot spin echo pulse sequence was used to acquire the diffusion weighted images: slice thickness 10 mm, field of view 260×130 mm2, matrix 128×64, repetition time 2000 ms, echo time 67.5 ms, 12 b values (0, 10, 30, 60, 100, 140, 170, 200, 300, 400, 600, 800 sec/mm2), number of excitations (NEX) 3. Volunteers were taken out of the scanner to apply cooling so T1 mapping was used to detect changes in tissue temperature, i.e. a SPGR sequence with varying flip angles: slice thickness 10 mm, field of view 260×130 mm2, matrix 128×64, repetition time 18 ms, echo time 2.9 ms, 5 flip angles (10°, 15°, 20°, 30°, 40°), 2 NEX. The flip angle 30° of the T1 mapping was used as anatomical image.
For the IVIM analysis, a multi-step approach was applied per voxel. First, diffusion coefficient (D) is calculated for each b values from:
$$S(b) = S_{0}e^{-bD}$$
where S0 is the calculated signal intensity at b=0. Perfusion fraction (f) is then calculated by the ratio of measured signal at S(0) and S07.
$$f = \frac{S(0)-S_{0}}{S_{0}}$$
In the last step, the pseudo-diffusion term (D*) is calculated by fitting all signal intensity values to the following equation:
$$S(b) = S(0)(fe^{-bD^{*}}+(1-f)e^{-bD})$$
All algorithms are implemented in house using standard Matlab functions (Mathworks, Natick, MA). For each slice, two ROIs were drawn for two muscles: see Figure 1. Mean and standard deviation values of IVIM parameters and T1 values were calculated for each ROI and each volunteer before and directly after applying cooling for 45 minutes, and 45 minutes after cooling was stopped.
Results
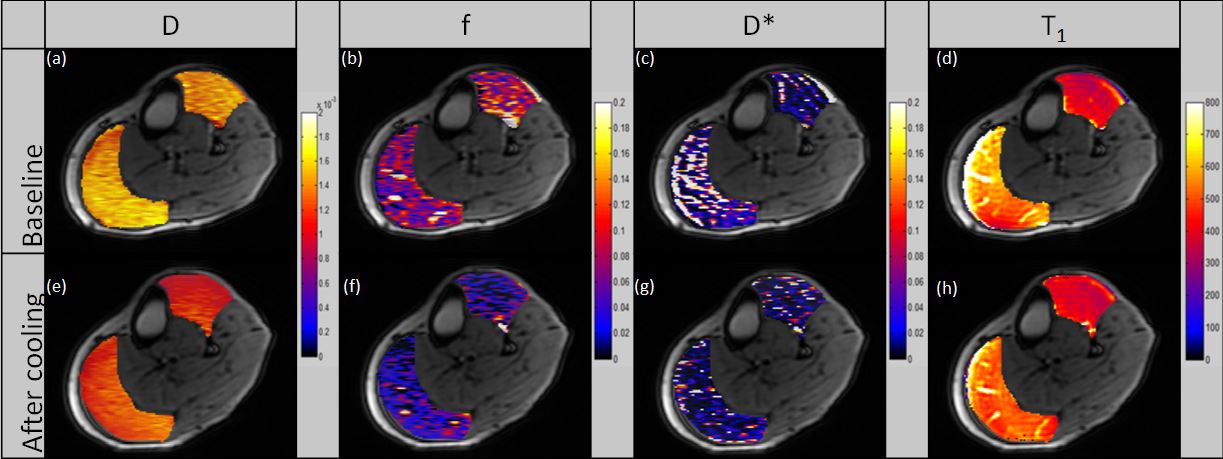
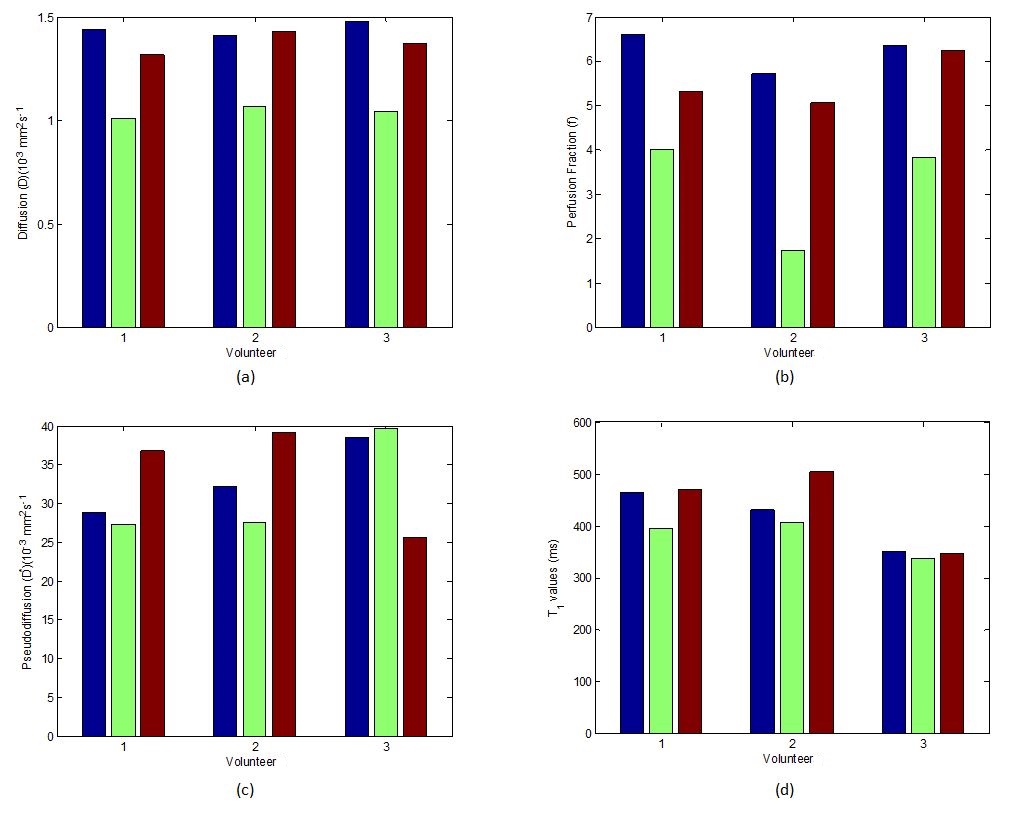
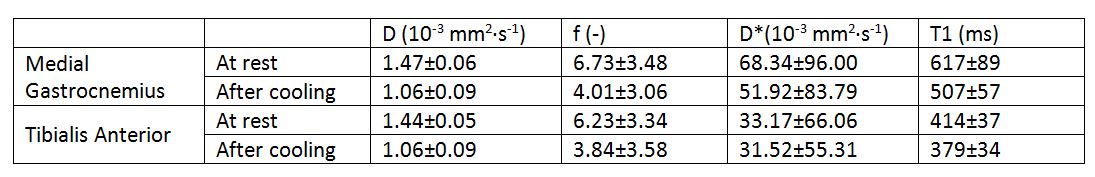
Figure 2 shows an example of IVIM parameter maps at rest and after cooling for one volunteer. Table 1 summarizes the data for the three volunteers. The diffusion coefficient and T1 values have a good correlation (R2=0.71) indicating that the observed effect is indeed due to the change in temperature. All three IVIM parameters showed a decreasing trend after cooling, but only the diffusion coefficient was significant (p=0.001). After the cooling stopped, IVIM parameters returned to the values at rest (Figure 3), i.e. within ±20% after 45 minutes.
Discussion and Conclusions
Earlier, the relation between D and temperature was shown8. In this study, we found that f and D* also decrease with decreasing temperature. We speculate that this is related to the constriction of the vessels under cold. Although inter-subject differences were observed in D* levels, the consistency between volunteers validates that the IVIM method can be used to image perfusion variations for subjects under cold or heat-stress considering the observations when the cooling effect was removed. Based on this study, we regard IVIM as a promising candidate for imaging perfusion during hyperthermia therapy and a promising tool to establish more accurate human temperature models.Acknowledgements
References
1. Cihoric, N., Tsikkinis, A., van Rhoon, G., Crezee, H., Aebersold, D. M., Bodis, S., ... & Ghadjar, P. (2015). Hyperthermia-related clinical trials on cancer treatment within the ClinicalTrials. gov registry. International journal of hyperthermia, 31(6), 609-614.
2. van den Tempel, N., Horsman, M. R., & Kanaar, R. (2016). Improving efficacy of hyperthermia in oncology by exploiting biological mechanisms. International journal of hyperthermia, 32(4), 446-454.
3. Vujaskovic, Z., & Song, C. W. (2004). Physiological mechanisms underlying heat-induced radiosensitization. International Journal of Hyperthermia, 20(2), 163-174.
4. Vaupel, P. W., & Kelleher, D. K. (2010). Pathophysiological and vascular characteristics of tumours and their importance for hyperthermia: heterogeneity is the key issue. International Journal of Hyperthermia, 26(3), 211-223.
5. Le Bihan D, Breton E, Lallemand D, Aubin ML, Vignaud J, Laval-Jeantet M. Separation of diffusion and perfusion in intravoxel incoherent motion MR imaging. Radiology 1988; 168 (2): 497–505.
6. Filli, L., Boss, A., Wurnig, M. C., Kenkel, D., Andreisek, G., & Guggenberger, R. (2015). Dynamic intravoxel incoherent motion imaging of skeletal muscle at rest and after exercise. NMR in Biomedicine, 28(2), 240-246.
7. Park, H. J., Sung, Y. S., Lee, S. S., Lee, Y., Cheong, H., Kim, Y. J., & Lee, M. G. (2017). Intravoxel incoherent motion diffusion‐weighted MRI of the abdomen: The effect of fitting algorithms on the accuracy and reliability of the parameters. Journal of Magnetic Resonance Imaging, 45(6), 1637-1647.
8. Le Bihan, D., Delannoy, J., & Levin, R. L. (1989). Temperature mapping with MR imaging of molecular diffusion: application to hyperthermia. Radiology, 171(3), 853-857.
Figures