5355
An open-source framework for analysis of multidimensional diffusion MRI data implemented in MATLAB1Clinical Sciences Lund, Radiology, Lund University, Lund, Sweden, 2Random Walk Imaging, Lund, Sweden, 3Clinical Sciences Lund, Medical Radiation Physics, Lund University, Lund, Sweden, 4Department of Chemistry, Physical Chemistry, Lund University, Lund, Sweden, 5Brigham and Women's Hospital, Harvard Medical School, Boston, MA, United States
Synopsis
Reproducible research requires robust methods for data management and analysis. We have developed a comprehensive analysis framework for diffusion MRI data based on a robust but flexible management of data and metadata, which enables rapid prototyping and sharing of code. The framework is tailored to deal with multidimensional diffusion MRI data featuring novel types of diffusion encoding strategies, such as b-tensor encoding. It also features routines for higher order tensor mathematics as well as adapted volume registration for motion correction, an analysis GUI and other tools.
Introduction
The zoo of diffusion MRI methods is ever evolving.1–7 This development is prone to spawn isolated software solutions, which is inherently counterproductive to reproducible science. We have developed a framework that supports rapid implementation and comparison of analysis methods by a well-defined code structure and a comprehensive set of support functions. The design goal is to provide a framework with predictable structure and requirements, facilitating code sharing with minimal setup time. A unique feature of the framework is that it comprises models and standards adapted to the use of multidimensional diffusion data,8 that is, the use of non-conventional diffusion encoding strategies such as b-tensor encoding with variable shapes.6–7 Since such strategies go beyond the half-century old Stejskal-Tanner paradigm,9 the framework also includes tools to analyze arbitrary gradient waveforms. As such, it supports not only q-trajectory encoding,10–11 but also double diffusion encoding12–13 and encoding with oscillating gradients.14Platforms and distribution
The framework is an open source package written primarily in Matlab (The Mathworks, Natick, MA, USA) and can thus be used at multiple platforms (Windows, Linux, Mac). Analysis methods can be applied in real time in ‘regions of interest’ (ROIs) as well as to compute parameter maps (Figure 1, 2, and 3). The code is available at https://github.com/markus-nilsson/md-dmri, together with documentation. It is free of charge for non-commercial use, but not for commercial use (license holder: Random Walk Imaging AB). The main features of the framework are summarized in the following sections.Packages
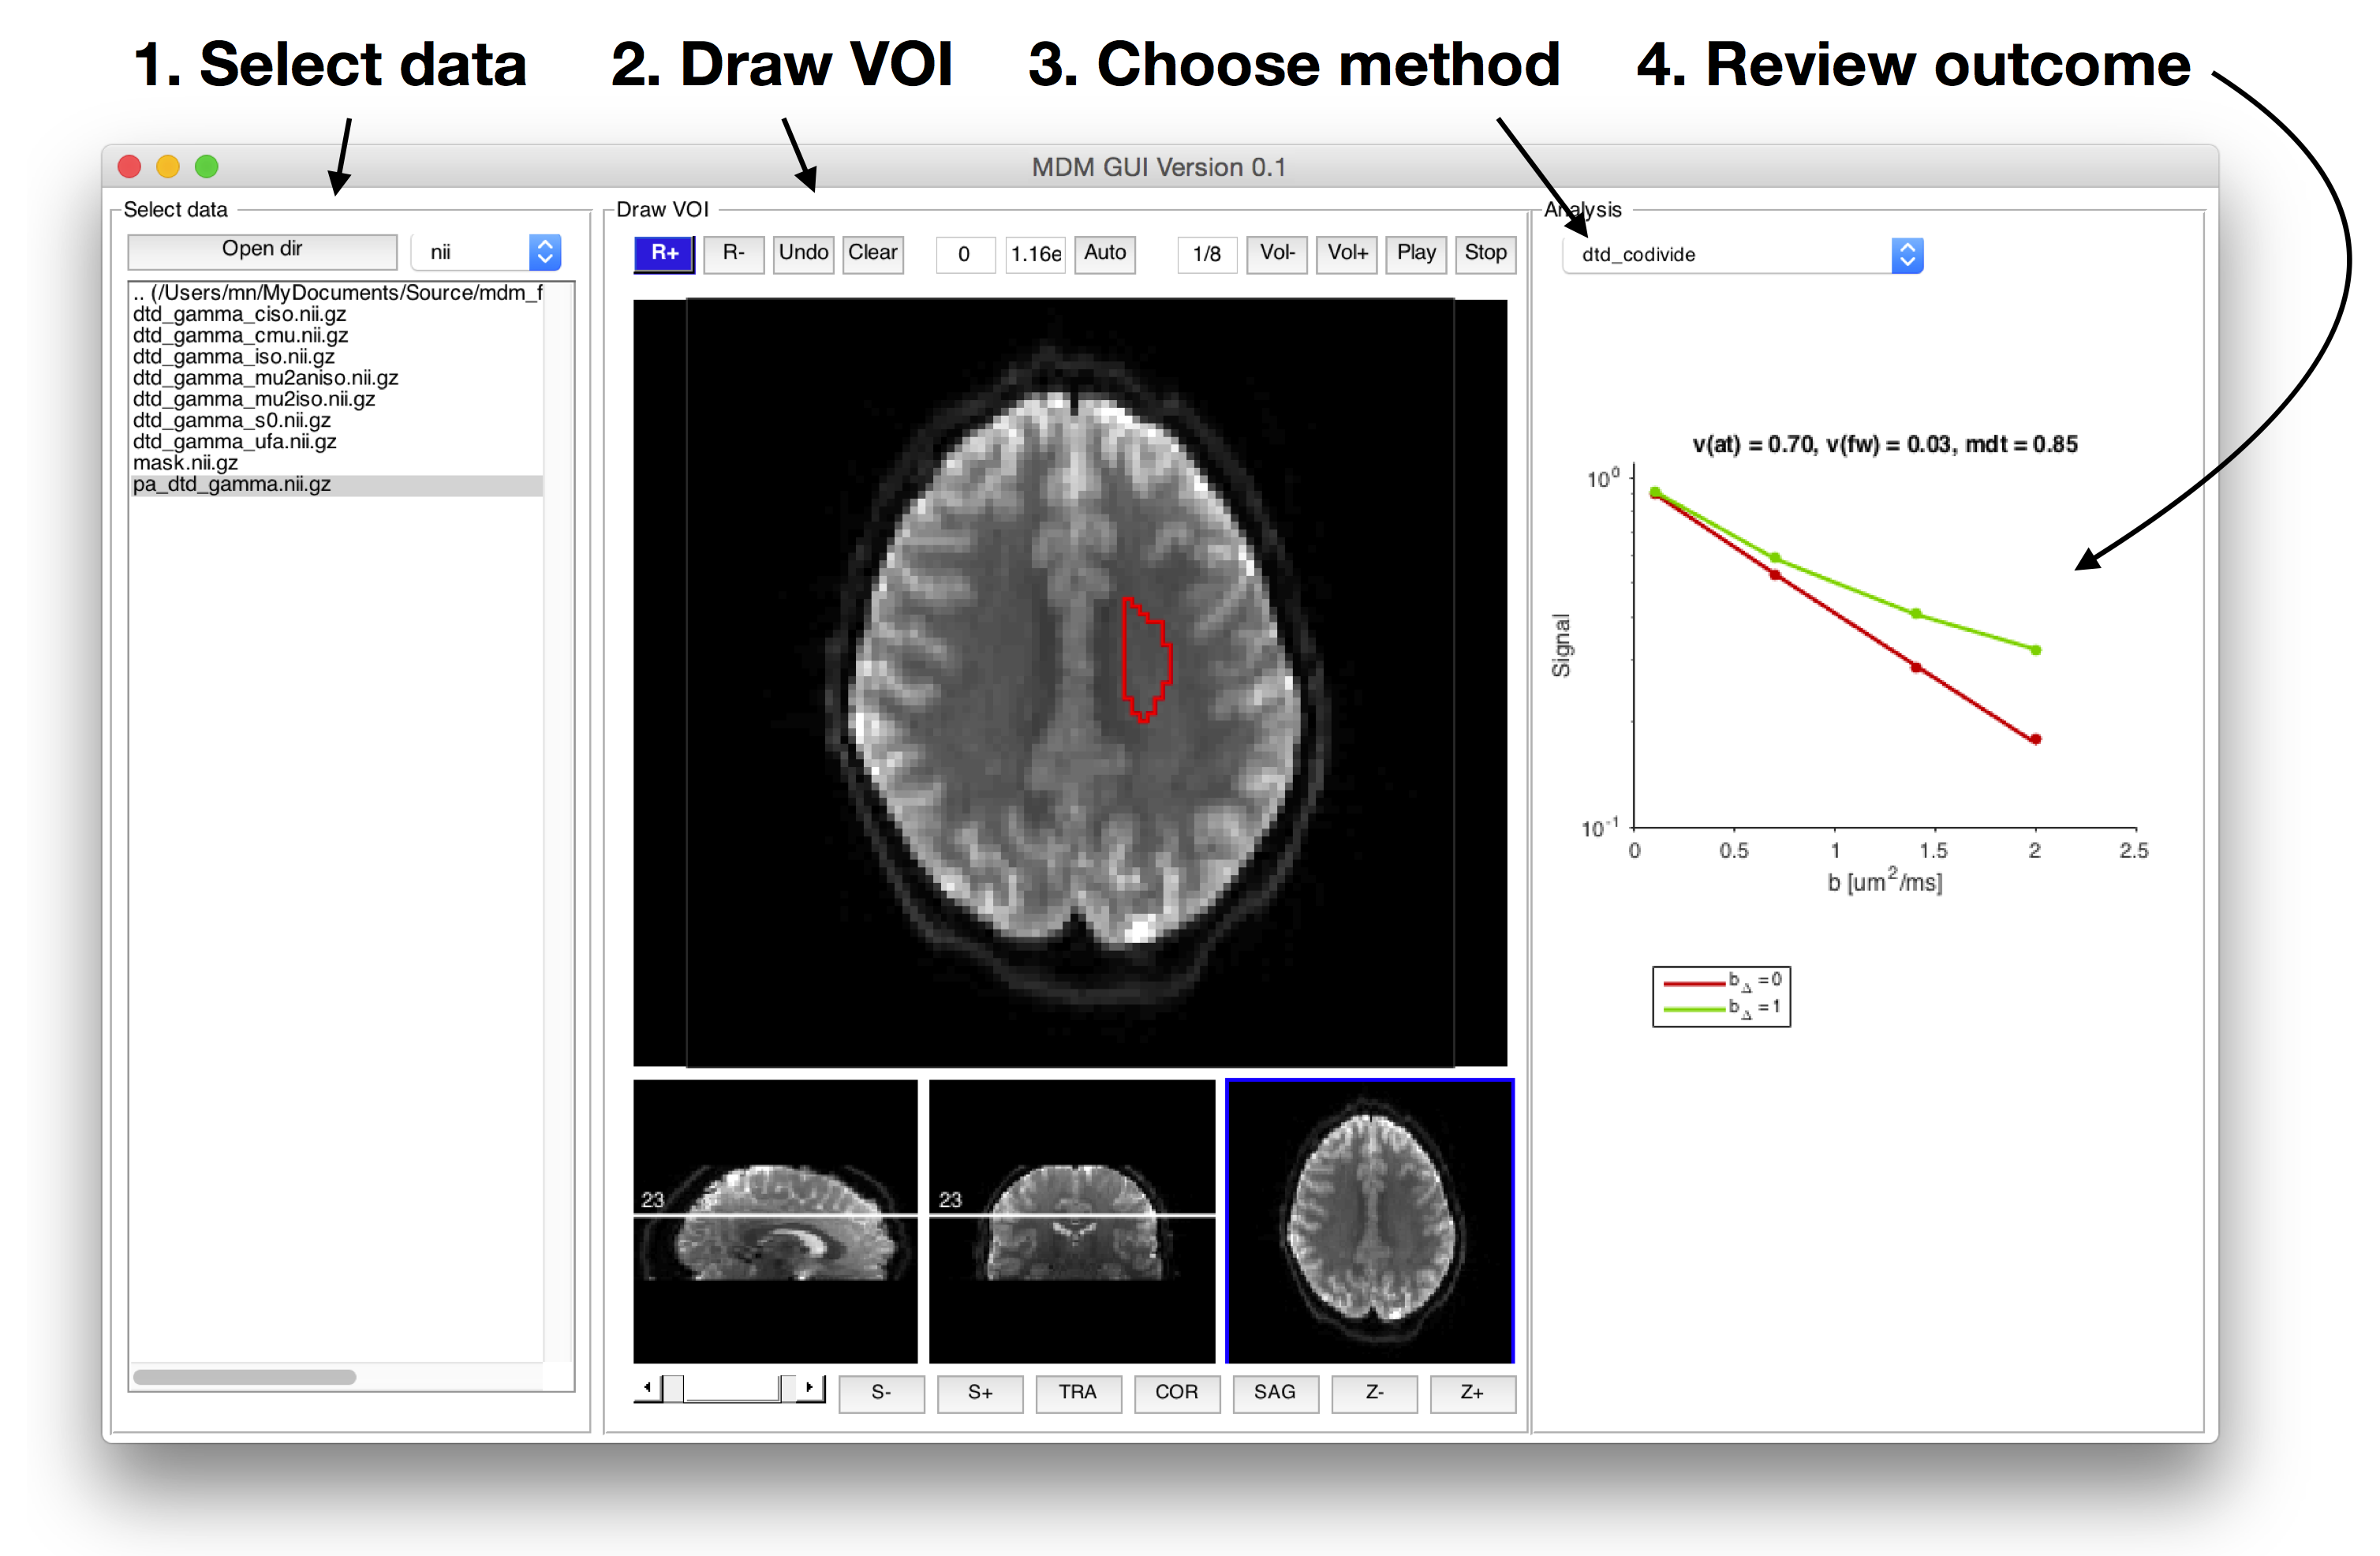
Multidimensional data analysis GUI (‘mgui’): A graphical user interface for review of data, parameter maps, and real time fitting of data signals in ROIs. The user can draw ROIs, select a data analysis method, and directly obtain the result (Figure 2).
Examples of methods that are implemented:
- dtd: Unconstrained inversion to diffusion tensor distribution (DTD).15
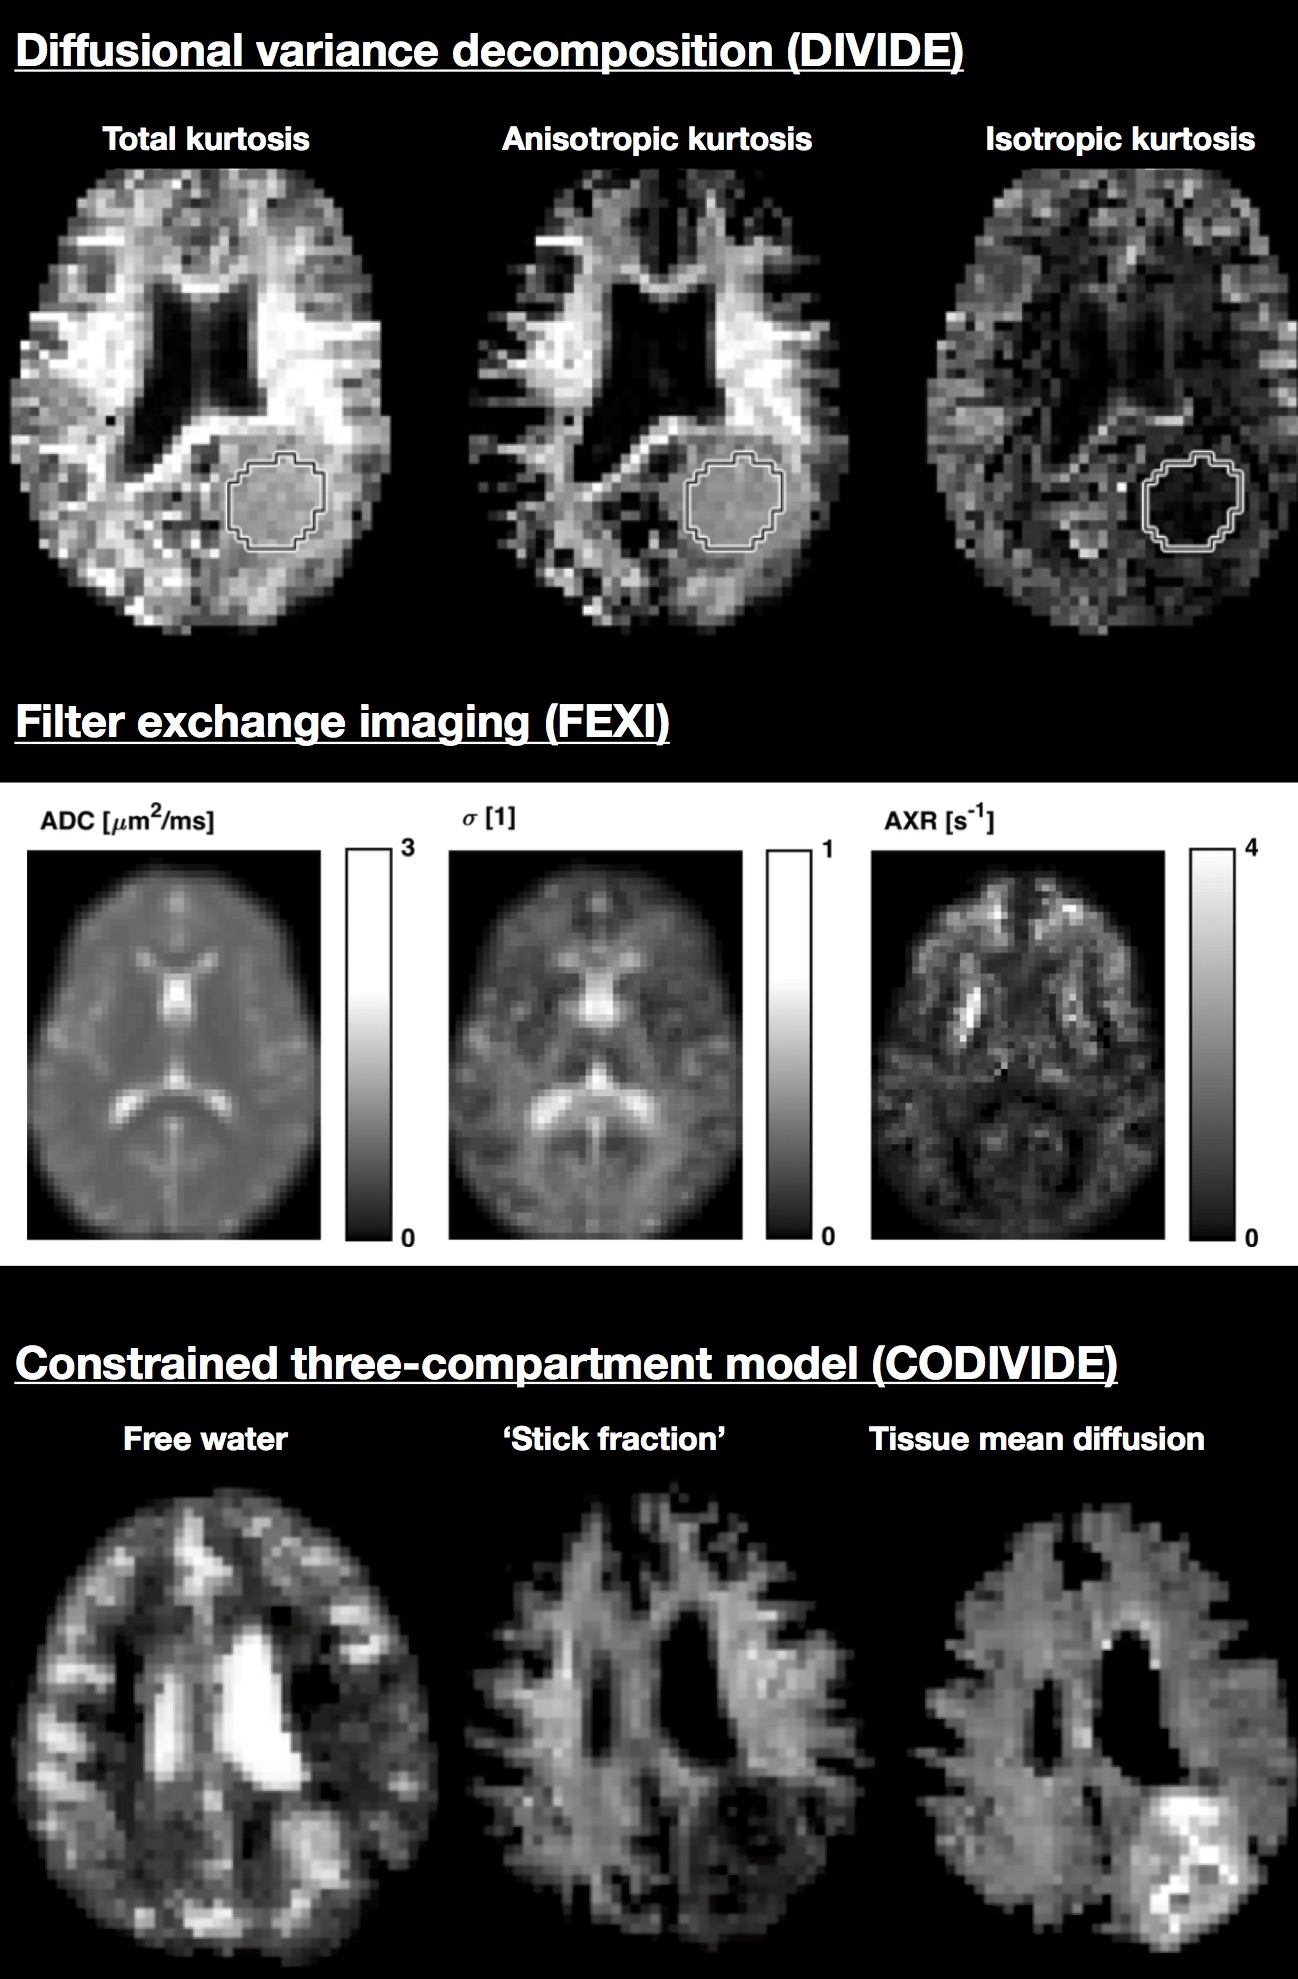
- dtd_gamma: Gamma distribution fit giving statistical descriptors of the DTD - mean and variance of isotropic diffusivity, mean-square anisotropy.6
- dtd_codivide: Constrained fit to three-component DTD, ‘stick fraction’.16
- fexi: Rate of diffusional exchange between tissue environments with low and high diffusivity.5
- vasco: Estimation of the blood volume by joint fitting to flow-compensated and non-compensated data.17
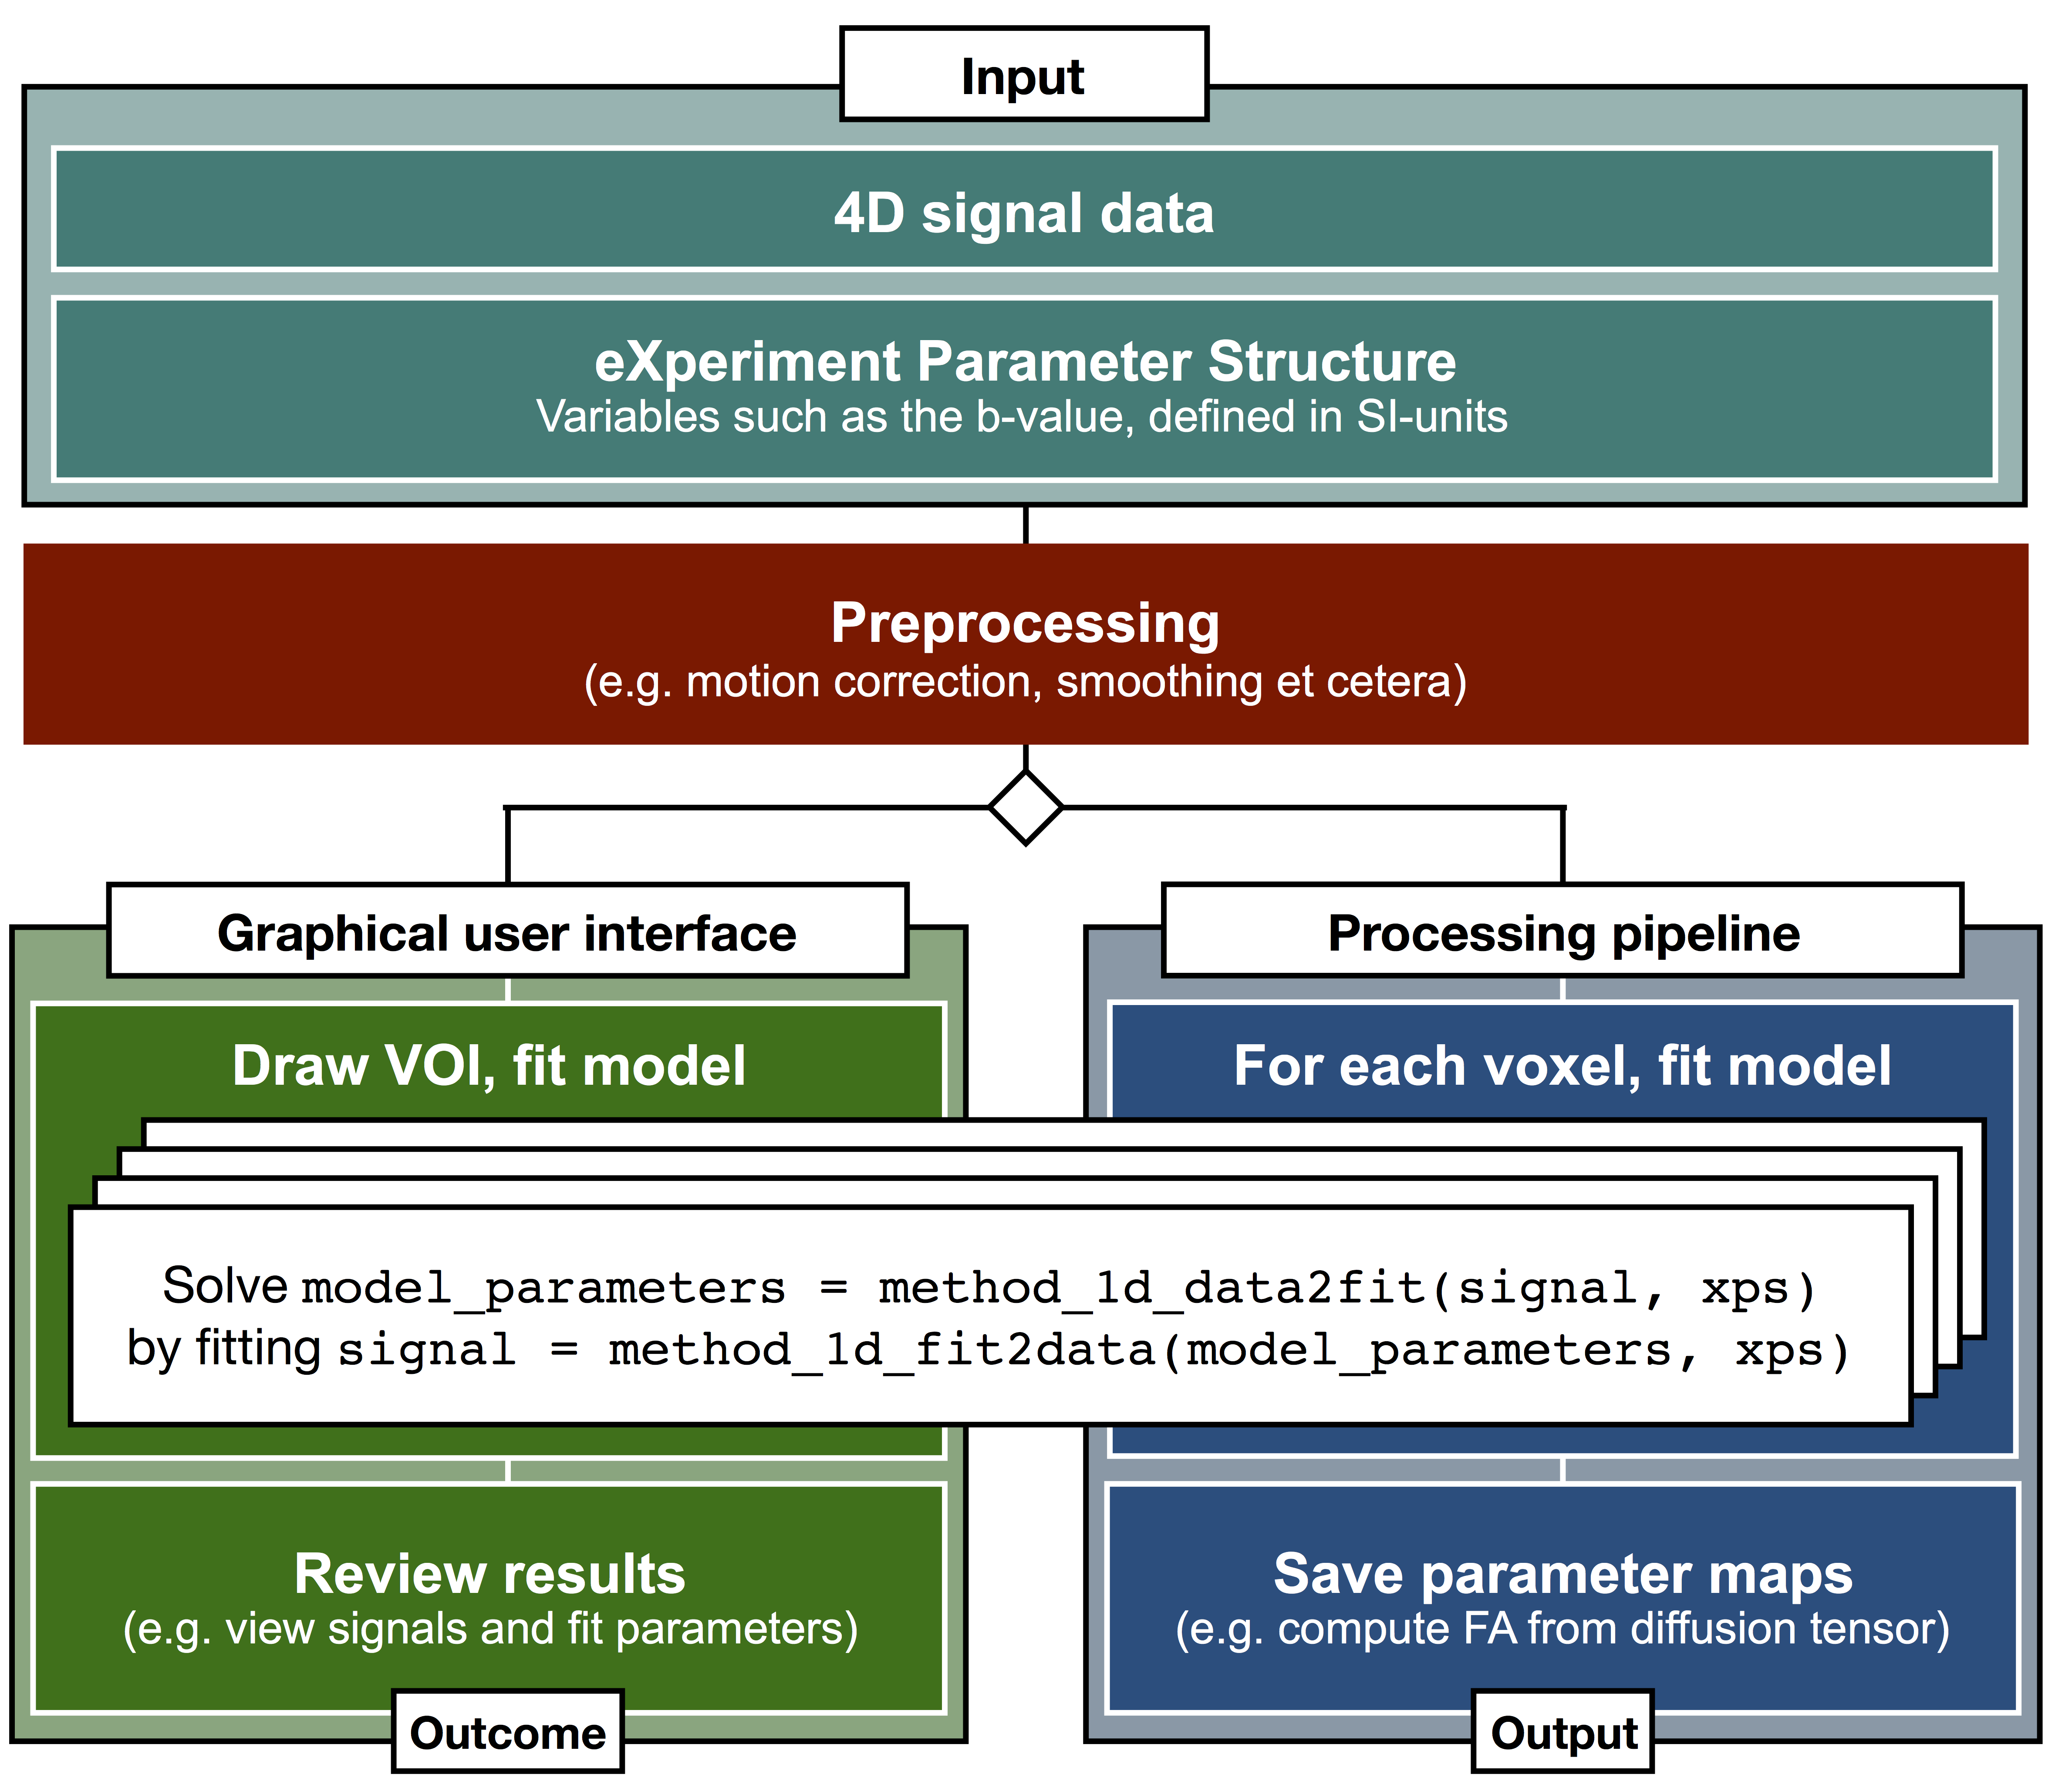
Examples of parameter maps from different methods are shown in Figure 3. For each method, standardized functions take as input a signal vector and an experimental parameter structure and outputs a vector of fitted model parameters (‘method_name_1d_data2fit’ functions). Each method also has a function that predicts the signal given a model fit vector and an experimental parameter structure (‘method_name_1d_fit2data’). The experimental parameter structure, which is clearly documented, has fields with predefined names, e.g., ‘b’ for the b-value, ‘bt’ for the b-tensor, and ‘b_delta’ for the normalized anisotropy of the b-tensor.18 Dimensions of all such fields are given in non-scaled SI units.
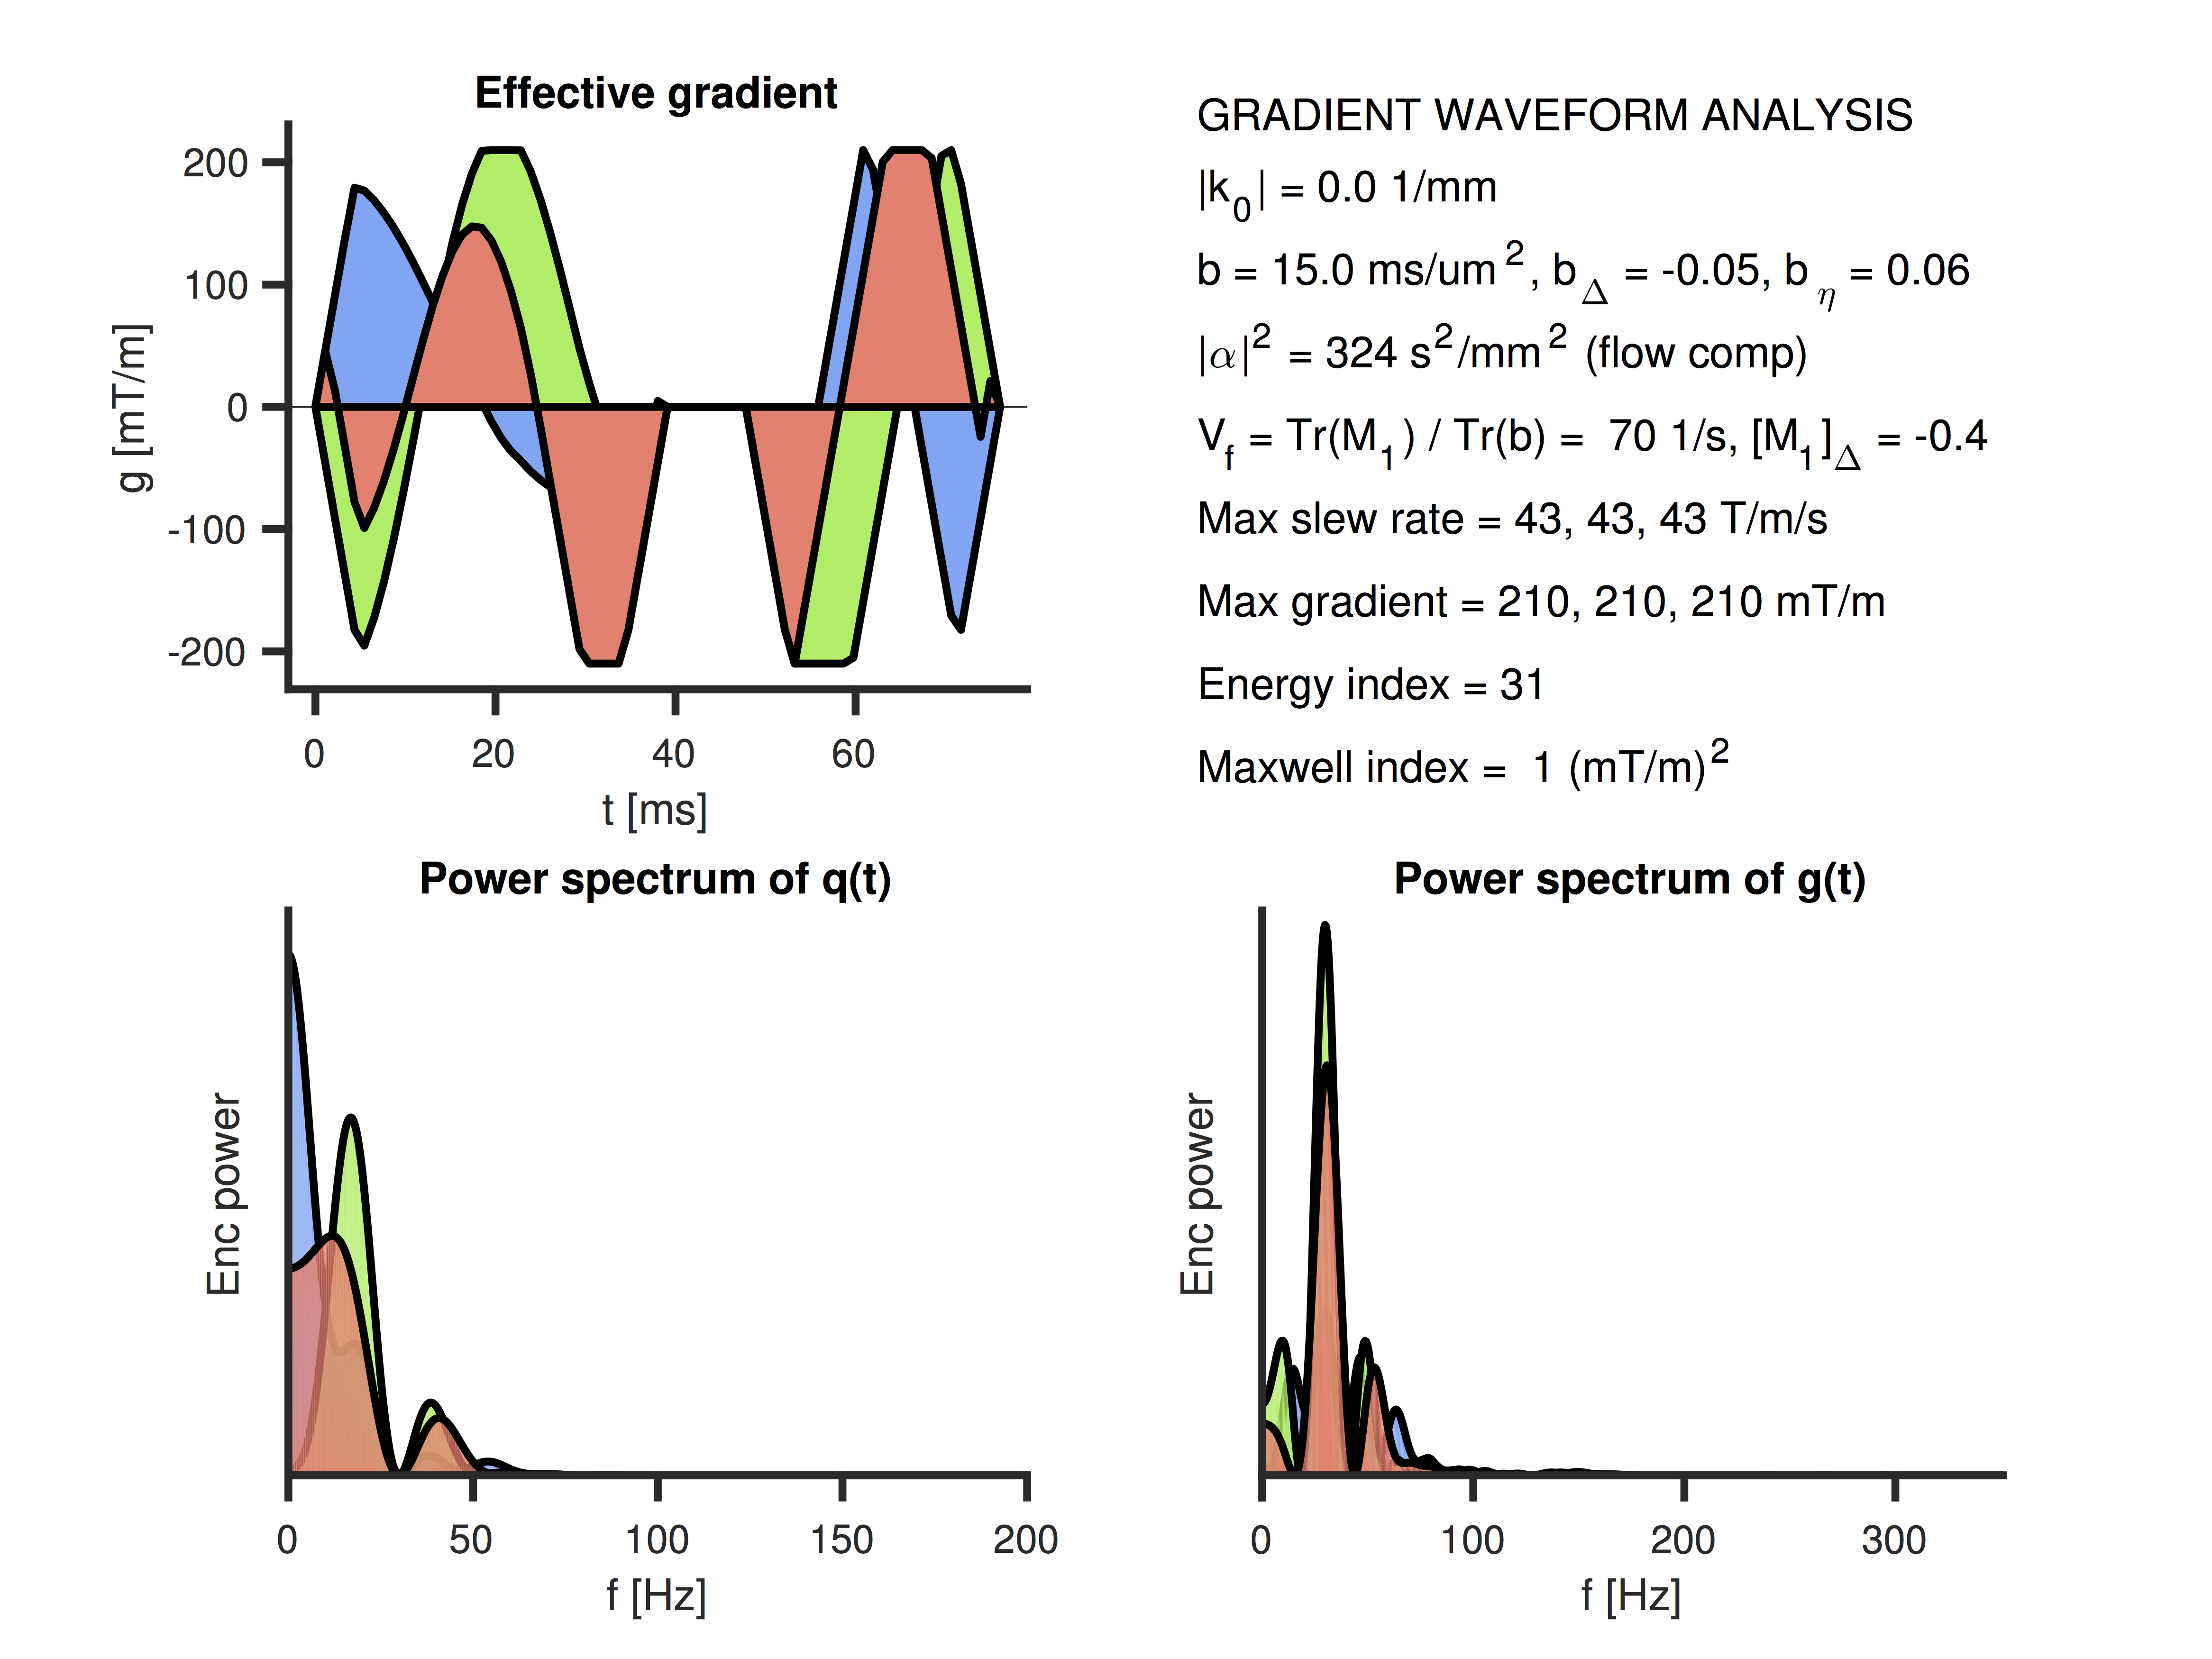
Included is also the package for multidimensional data management (‘mdm’), comprising code to compile and manage the experimental parameter structure and to open and write various types of files. The multidimensional image operations package (‘mio’) has functions for image coregistration, smoothing, masking etc. Furthermore, tools are included (in ‘tools/gwf’) for gradient waveform analysis (Figure 4). The tensor maths package (‘tools/tm’) has vectorized functions for handling second and fourth order tensors.
Summary
We are currently witnessing an explosive growth of different approaches for microstructure imaging with diffusion MRI. At the same time, there is a growing concern regarding reproducible research. Our framework supports sharing of analysis methods by providing well-defined structures for code and experimental variables, together with a comprehensive set of support functions. Thus, sharing of code requires minimal setup time. The methods already implemented support, for example, the estimation of microscopic anisotropy via b-tensor encoding,6,7,11 water exchange via double diffusion encoding,5 and blood volume estimation via flow-compensated encoding.17 Our goal is to help facilitate rapid and reproducible use of advanced diffusion encoding strategies.Acknowledgements
This research was supported by the Swedish Foundation for Strategic Research (grant no. AM13-0090), Random Walk Imaging, and the organizers of the annual multidimensional diffusion MRI hackathons.References
1. Basser, P. J., Mattiello, J., & LeBihan, D. (1994). MR diffusion tensor spectroscopy and imaging. Biophys J, 66(1), 259–267.
2. Jensen, J. H., Helpern, J. A., Ramani, A., Lu, H., & Kaczynski, K. (2005). Diffusional kurtosis imaging: the quantification of non-gaussian water diffusion by means of magnetic resonance imaging. Magn Reson Med, 53(6), 1432–1440.
3. Assaf, Y., Blumenfeld-Katzir, T., Yovel, Y., & Basser, P. J. (2008). AxCaliber: a method for measuring axon diameter distribution from diffusion MRI. Magn Reson Med, 59(6), 1347–1354.
4. Zhang, H., Schneider, T., Wheeler-Kingshott, C. A., & Alexander, D. C. (2012). NODDI: practical in vivo neurite orientation dispersion and density imaging of the human brain. NeuroImage, 61(4), 1000–1016.
5. Lasič, S., Nilsson, M., Lätt, J., Ståhlberg, F., & Topgaard, D. (2011). Apparent exchange rate mapping with diffusion MRI. Magn Reson Med, 66(2), 356–365.
6. Lasič, S., Szczepankiewicz, F., Eriksson, S., Nilsson, M., & Topgaard, D. (2014). Microanisotropy imaging: quantification of microscopic diffusion anisotropy and orientational order parameter by diffusion MRI with magic-angle spinning of the q-vector. Frontiers in Physics, 1–35.
7. Westin, C. F., Szczepankiewicz, F., Pasternak, O., Özarslan, E., Topgaard, D., Knutsson, H., & Nilsson, M. (2014). Measurement Tensors in Diffusion MRI: Generalizing the Concept of Diffusion Encoding. MICCAI, 8675, 209–216.
8. Topgaard, D. (2016). Multidimensional diffusion MRI. J Magn Reson, 275, 98–113.
9. Stejskal, E. O., & Tanner, J. E. (1965). Spin diffusion measurements: Spin echoes in the presence of a time-dependent field gradient. J Chem Phys, 42(1), 288–292.
10. Eriksson, S., Lasič, S., & Topgaard, D. (2013). Isotropic diffusion weighting in PGSE NMR by magic-angle spinning of the q-vector. J Magn Reson, 226, 13–18.
11. Westin, C.-F., Knutsson, H., Pasternak, O., Szczepankiewicz, F., Ozarslan, E., van Westen, D., et al. (2016). Q-space trajectory imaging for multidimensional diffusion MRI of the human brain. NeuroImage, 135(C), 345–362.
12. Cory, D. G., Garroway, A. N., & Miller, J. B. (1990). Applications of spin transport as a probe of local geometry. Polym. Preprints, 31, 149.
13. Shemesh, N., Jespersen, S. N., Alexander, D. C., Cohen, Y., Drobnjak, I., Dyrby, T. B., et al. (2016). Conventions and nomenclature for double diffusion encoding NMR and MRI. Magn Reson Med, 75(1), 82–87.
14. Callaghan, P. T., & Stepisnik, J. (1995). Frequency-domain analysis of spin motion using modulated-gradient NMR. J Magn Reson.
15. de Almeida Martins, J. P., & Topgaard, D. (2016). Two-dimensional correlation of isotropic and directional diffusion using NMR. Phys Rev Lett
16. Lampinen, B., Szczepankiewicz, F., Mårtensson, J., van Westen, D., Sundgren, P. C., & Nilsson, M. (2017). Neurite density imaging versus imaging of microscopic anisotropy in diffusion MRI: A model comparison using spherical tensor encoding. NeuroImage, 147, 517–531.
17. Ahlgren, A., Knutsson, L., Wirestam, R., Nilsson, M., Ståhlberg, F., Topgaard, D., & Lasič, S. (2016). Quantification of microcirculatory parameters by joint analysis of flow-compensated and non-flow-compensated intravoxel incoherent motion (IVIM) data. NMR Biomed, 29(5), 640–649.
18. Eriksson, S., Lasič, S., Nilsson, M., Westin, C.-F., Topgaard, D. (2015). NMR diffusion encoding with axial symmetry and variable anisotropy: Distinguishing between prolate and oblate microscopic diffusion tensors with unknown orientation distribution. J Chem Phys, 142, 104201.
19. Szczepankiewicz, F., van Westen, D., Englund, E., Westin, C.-F., Ståhlberg, F., Lätt, J., et al. (2016). The link between diffusion MRI and tumor heterogeneity: Mapping cell eccentricity and density by diffusional variance decomposition (DIVIDE). NeuroImage.
20. Lampinen, B., Szczepankiewicz, F., van Westen, D., Englund, E., C Sundgren, P., Lätt, J., et al. (2017). Optimal experimental design for filter exchange imaging: Apparent exchange rate measurements in the healthy brain and in intracranial tumors. Magn Reson Med, 77(3), 1104–1114.
Figures