5353
Physiological noise at low diffusion weighting reduces repeatability of apparent diffusion coefficient independent of underlying diffusion curve characteristics1Department of Circulation and Medical Imaging, Norwegian University of Science and Technology - NTNU, Trondheim, Norway, 2Clinic of Radiology and Nuclear Medicine, St. Olavs University Hospital, Trondheim, Norway, 3Department of Physics, Norwegian University of Science and Technology - NTNU, Trondheim, Norway, 4Department of Cancer Research and Molecular Medicine, Norwegian University of Science and Technology - NTNU, Trondheim, Norway, 5Department of Surgery, St. Olavs University Hospital, Trondheim, Norway
Synopsis
The apparent diffusion coefficient is a powerful imaging biomarker, sensitive to microstructure properties, and possessing excellent repeatability. Exclusion of perfusion influence (b<150 s.mm-2) reflects true diffusivity, although fewer data points reduces precision, and thus repeatability. We investigate repeatability of experimental breast diffusion data, and show an unexpected increased repeatability with low b-value data inclusion, in contrast to simulated data. This indicates that experimentally-acquired low b-values contains additional noise, perhaps modulated by the non-Gaussianity of the underlying diffusion processes, that decreases diffusion modelling repeatability independent of the true diffusion curve, and should be considered as part of the analysis strategy.
Introduction
The apparent diffusion coefficient (ADC) is a well-known and robust marker for characterising tissue cellularity, and is a standard in clinical imaging for oncology. ADC remains a preferred metric from diffusion-weighted imaging (DWI) owing to its sensitivity to a range of microstructure properties, but also from excellent repeatability1. ADC is often calculated without low b-values (b<150 s.mm2) in order to exclude perfusion influence and give a value more accurately reflecting true diffusivity, although a reduced dataset (from either fewer b-values or signal averages) may be expected to also reduce precision, and thus repeatability, in the absence of confounding factors and assuming consistent noise characteristics across the b-value range used. This phenomenon should be independent of the underlying truth of the diffusion decay curve, and should apply to ADC fitting even to known or apparent non-Gaussian systems. In this study, investigation of this effect compares simulated diffusion data with experimental breast cancer cohort data, and reveals a decreased coefficient of variation (CoV) when including experimentally acquired low b-value data.Methods
Experimental data was collected from patients with confirmed benign breast lesions recruited to a prospective repeatability study (informed consent, approved by regional committee for medical and health research ethics). Patients underwent DWI on two occasions (approx. 1 week apart) with identical protocol: sagittal SE-EPI with bipolar encoding, TR/TE: 11600/86ms, FOV: 180x180mm, matrix: 90x90, slice thickness: 2.5mm, slices: 60, iPAT: GRAPPA 2, b-values: 0, 10, 20, 30, 40, 50, 70, 90, 120, 150, 200, 400, 700 s.mm-2, with an additional phase-reversed b=0 scan to allow distortion correction. An additional, simulated data set (5000 voxels, 20 ‘patients’, 2 repeat visits) was constructed with known parameters using mono- and bi-exponential equations, with Gaussian noise added (approx. SNR 20, 10, and 5 calculated from std/mean of signal at b=700 s.mm-2), and b-values matching the experimental protocol.Analysis
Tumour ROIs were drawn on high-b-value images for the whole lesion using contrast-enhanced images as reference. All fitting, for simulated and experimental diffusion data, was conducted on each voxel using Levenberg-Marquardt algorithm, using 1) all b-values, and 2) b=150 s.mm-2 and above for experimental data, and successively excluding lowest b-value for simulated data. Repeat-measures CoV were calculated for each centile of the resulting ADC histogram for the two visits across the cohort2.Results
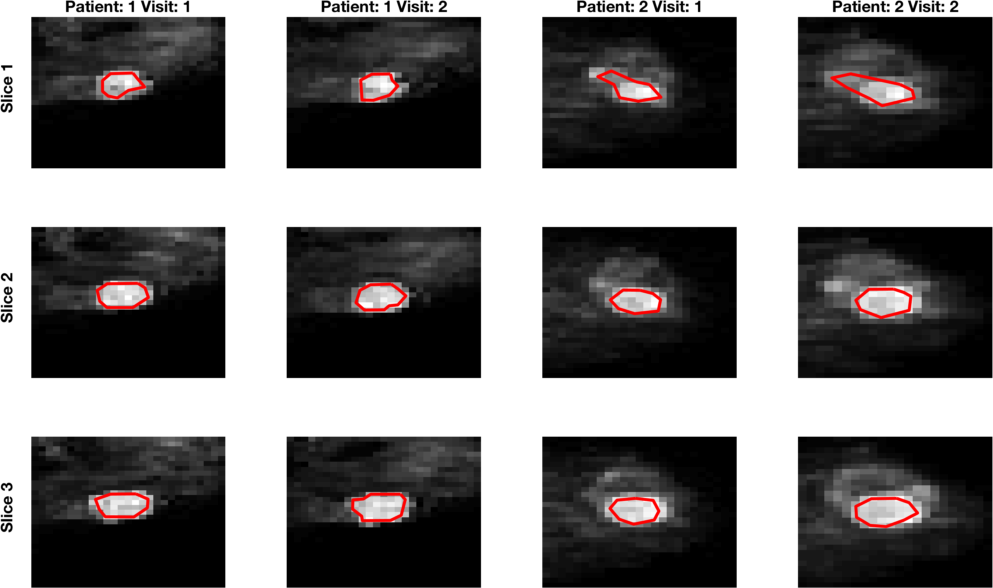
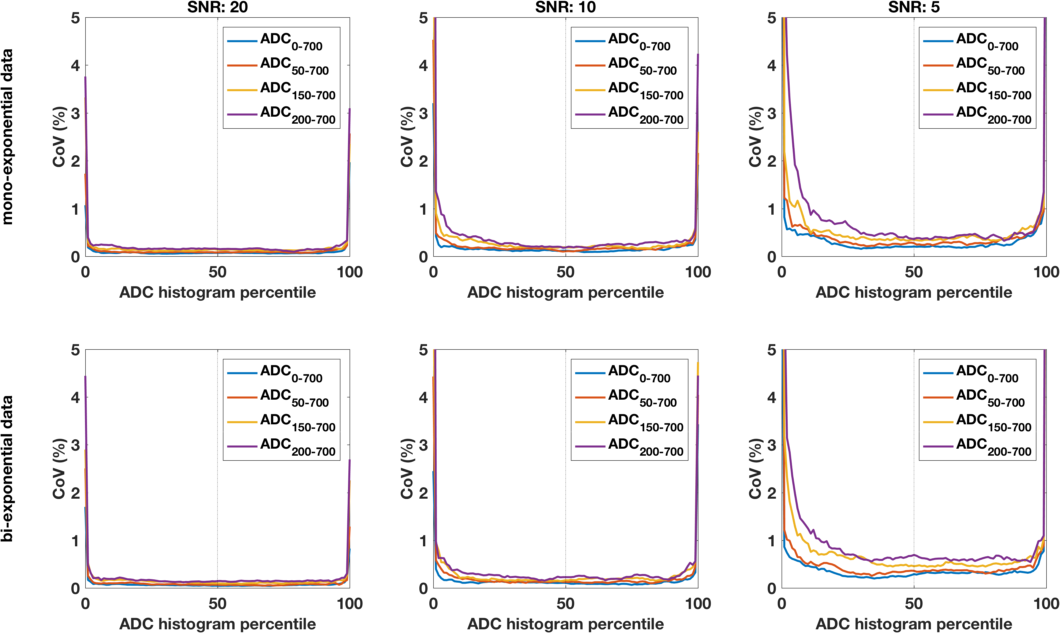
DWI data was successfully acquired from 13 patients (median age 24, range 19-50 years), yielding 12 repeated datasets (1 patient withdrew following 1st scan) from benign tumours (0.345 to 8.25 cm3). Example images are shown in Figure 1; ROI size for tumours was very repeatable (CoV 8.7%). Simulated data shows the expected behaviour of excellent repeatability across the ADC histogram (CoV<5%), with increased CoV corresponding to extreme values giving a ‘bathtub’ profile. With decreasing SNR, the curves for fitting with different amount of data separate more (Figure 2), and demonstrate that maximal stability is given by inclusion of the most data. This is true when using the ADC model for simulated data based on underlying mono- and bi-exponential behaviour (top and bottom rows, respectively), and as such is independent of ‘ground truth’. In contrast, fitting the ADC model using experimental data from benign lesions (where ‘ground truth’ of the decay curve is unknown, and likely complex) shows increased CoV (ie poorer repeatability) from using all data. This is true across the whole ADC histogram, but more marked above the median. In these data, including low b-value data leads to a decreased confidence in resulting ADC values, independent of concerns of accuracy and/or perfusion influence.Discussion
While the application of diffusion models more complex than the mono-exponential decay assumed by the ADC model may give more detailed insight to tissue composition, repeatability remains a critical part of clinical biomarker development that is nevertheless difficult to include in clinical studies. The inclusion of low b-values for ADC calculation may or may not be desirable, depending on the desire to reduce or examine perfusion influence, and ultimately the accuracy of ADC (or other markers) is less important than sensitivity of such to relevant physiological and microstructural features that can aid diagnosis or prognosis. Results from this study indicate that low b-value data contains noise of a physiological origin, which may be modulated by the degree of non-Gaussianity of the underlying diffusion processes (including perfusion), that can decrease the repeatability of diffusion modelling. This is true regardless of the nature of the diffusion curve and should be considered as part of the analysis strategy.Acknowledgements
We acknowledge support from the liaison Committee between the Central Norway Regional Health Authority and the Norwegian University of Science and Technology.References
1. Winfield JM, Tunariu N, Rata M, et al. (2017) Extracranial Soft-Tissue Tumors: Repeatability of Apparent Diffusion Coefficient Estimates from Diffusion-weighted MR Imaging. Radiology 284:88–99.
2. Jerome NP, Miyazaki K, Collins DJ, et al. (2017) Repeatability of derived parameters from histograms following non-Gaussian diffusion modelling of diffusion-weighted imaging in a paediatric oncological cohort. Eur Radiol 27:345–353.
Figures