5352
Brain q-space imaging: Mean displacement measurement by SMS, grid sampling, and multi-shell QSI1Kyoto Prefectural University of Medicine, Kyoto, Japan, 2Kyoto Prefectural University of Medicine Hospital, Kyoto, Japan, 3Siemens Healthcare K. K., Tokyo, Japan
Synopsis
The comparisons of mean displacement (MD) from multi-shell QSI (msQSI) and grid sampling QSI (gsQSI) were executed by anisotropic diffusion phantom and human brain. In addition, the effect of the number of slices excited and acquired simultaneously (SMS factor) we also investigated. The MDs of msQSI and gsQSI were different. The shorter diffusion time on gsQSI might effect these differences. SMS factors on msQSI showed difference among the acceleration. On contrary, SMS factors on gsQSI did not show any difference among the acceleration.
PURPOSE
Simultaneous multi-slice (SMS) [1] echo planar imaging (EPI) acquisition appears usefulness for clinical diffusion tensor imaging (DTI) to reduce acquisition time dramatically. Furthermore, this method can be applied for q-space imaging (QSI), which is one of extended method of DTI with multi b-values, and made whole brain QSI acquisition less than 10 minutes. However, the effects of data sampling methods of SMS-EPI for clinical QSI remains unclear. In this paper, we compared mean displacement (MD) from multi-shell QSI (msQSI) and grid sampling QSI (gsQSI) by anisotropic diffusion phantom and human brain. In addition, we also investigated the effect of the number of slices excited and acquired simultaneously (SMS factor).METHODS
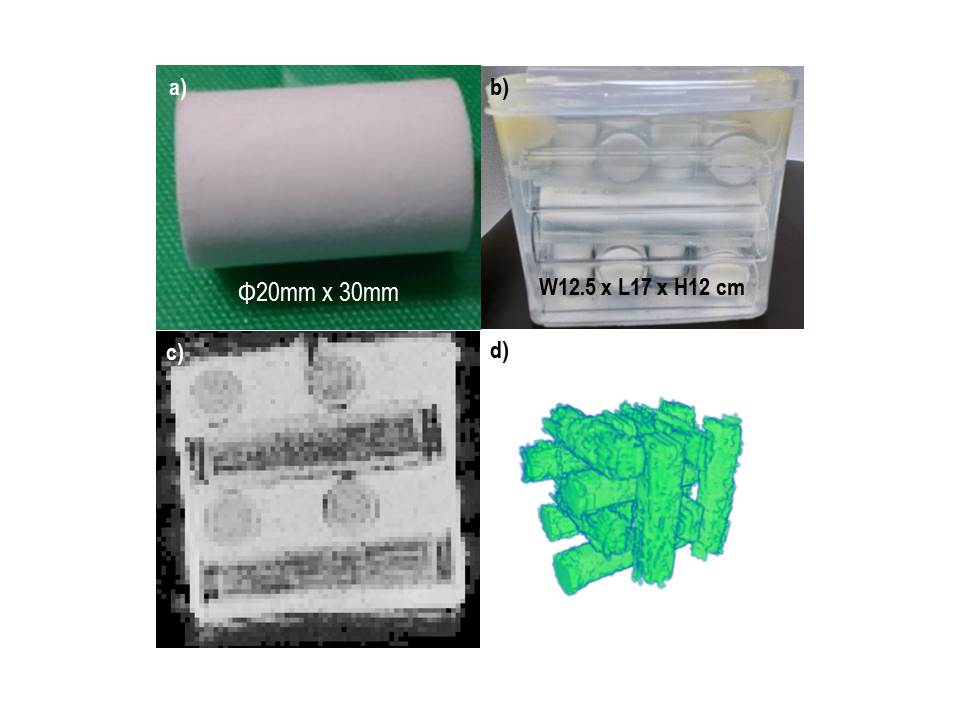
Anisotropic diffusion phantom: The astriction cotton (length = 30 mm, diameter = 20 mm, Hakujuji Co. Ltd., Tokyo, Japan) into acryl tubes (diameter = 25 mm) were arranged in parallel crosses [2] (Figure 1a). The phantom size was 12.5 cm wide x 17.0 cm long x 12.0 cm high (polyethylene container) (Figure 1b).
Subject: This study was approved by the ethics committee at our institution. The subject consisted of one healthy, 49-year-old, male volunteer.
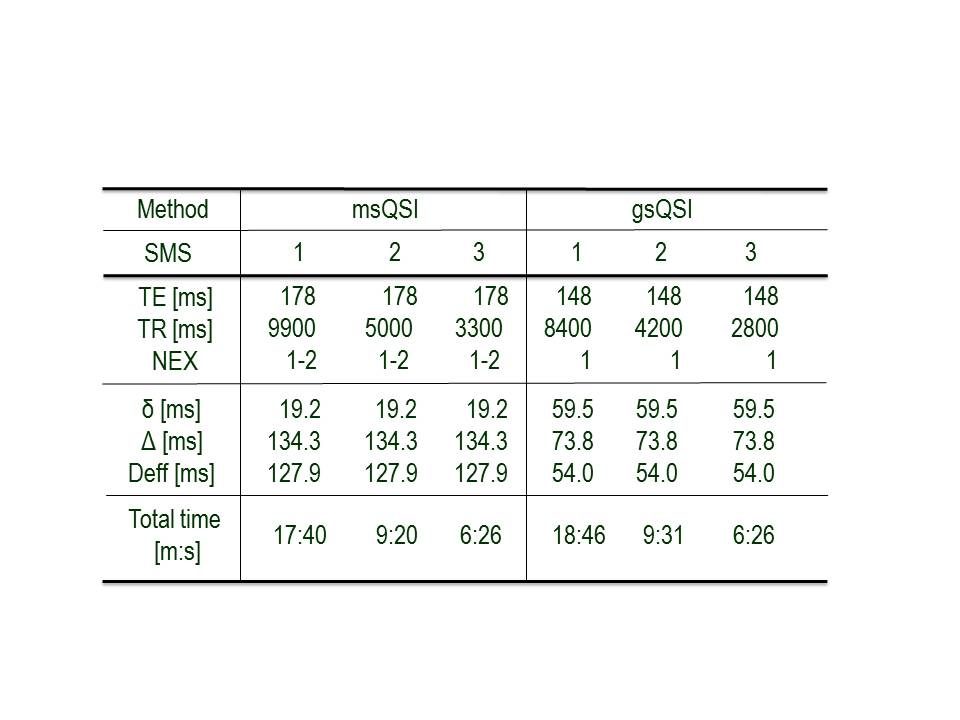
QSI acquisition: MRI examinations were performed on a clinical 3 T whole-body scanner (MAGNETOM Skyra, Siemens Healthcare, Erlangen, Germany) with a 32ch head coil. Scan parameters were: in-plane field of view (FOV): 240 x 240 mm, acquisition matrix: 120 x 108, maximum b value = 8,000 s/mm2, 11 steps of q-values for msQSI, 5 steps q-values for gsQSI (upper limit = 5), 6 diffusion directions were acquired. A total of 50 3-mm-thick slices were obtained without inter-slice gaps with SMS factor 1, 2, and 3. Repetition time, echo time, NEX, and total acquisition time are summarized in Table 1.
QSI analysis: The q-space analysis was performed on a pixel-by-pixel basis, according to previously described methods [3] by in-house Matlab® based software.
MD and SNR comparison: MD comparisons of phantom was used manual segmented region of interest (ROI, Figure 1d) on b0 images (Figure 1c). We obtained a registered brain parcelation map [4] by LDDMM on Diffeomap [5] for MD comparisons of human brain. The relative SNR to conventional DTI (SMS1) was compared on each parcel at different SMS factors and different inter slice image shifts [6].
RESULTS AND DISCUSSION
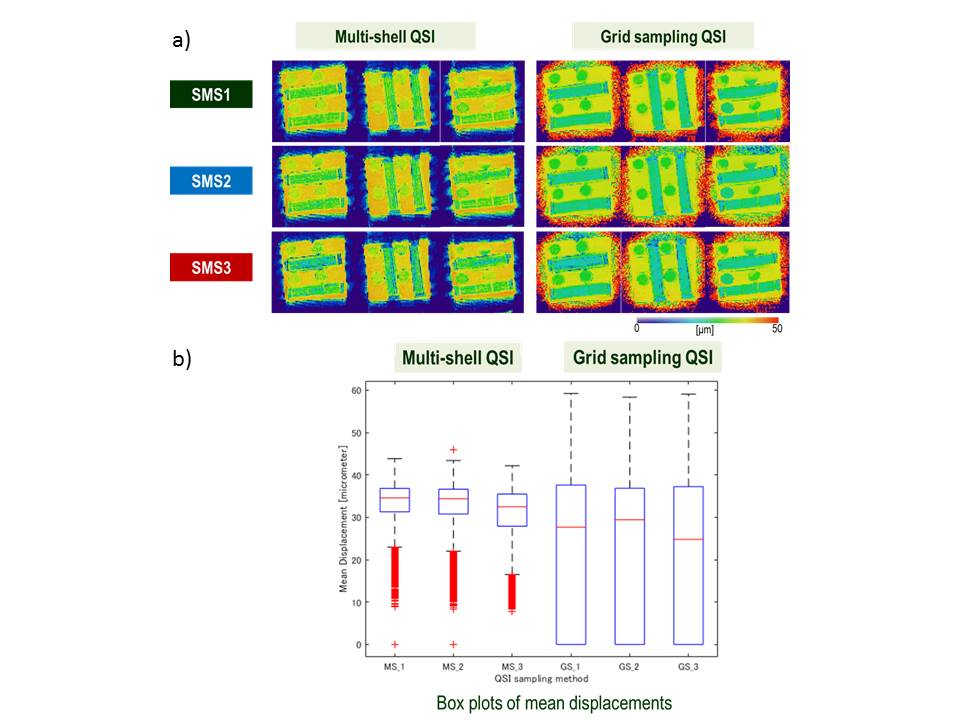
Effect of SMS factors and sampling methods for phantom: Figure 2a shows representative slices of MD mapping on phantom. gsQSI showed large noises around the phantom. Figure 2b shows the box plots of MD for msQSI and gsQSI with different SMS factors. The differences between msQSI and gsQSI showed significant (p<0.01 by t-test). gsQSI showed wider range of MD than msQSI on phantom. The shorter diffusion time on gsQSI might effect these differences.
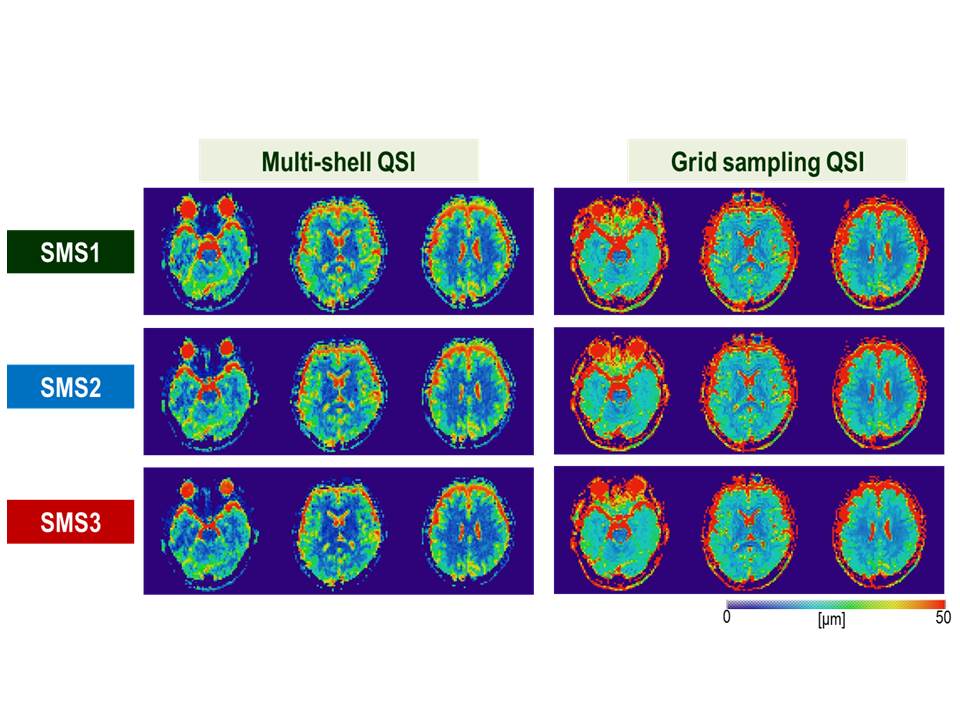
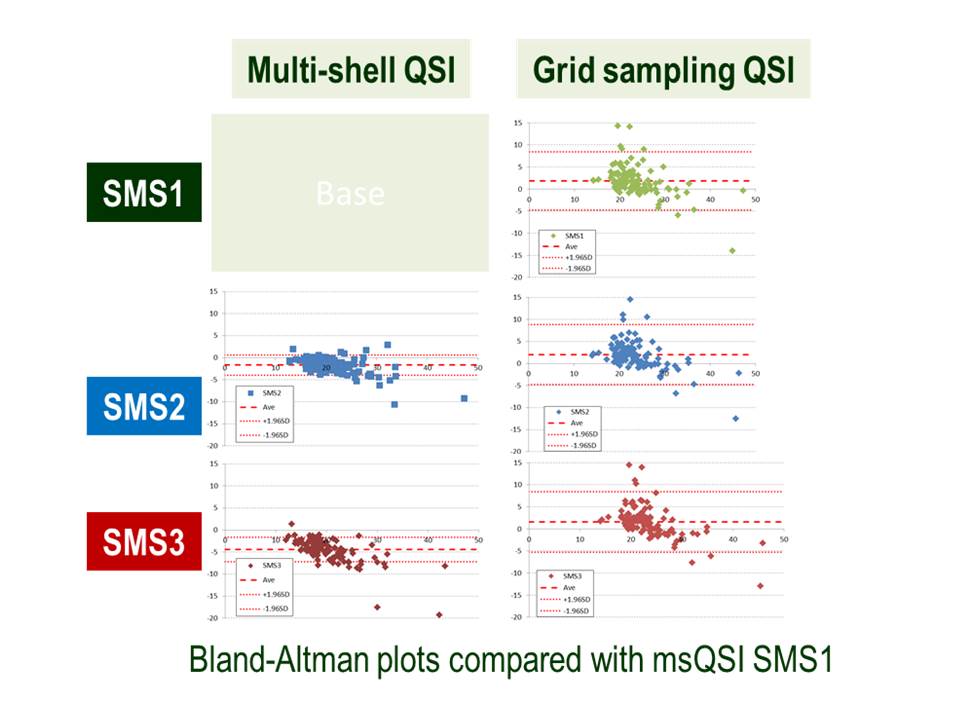
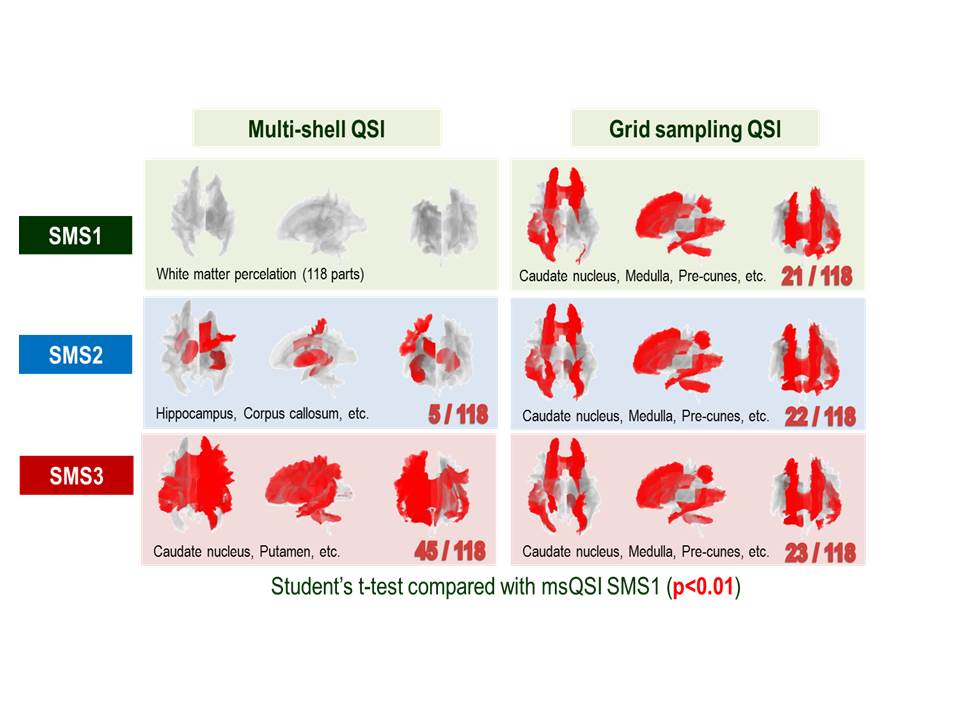
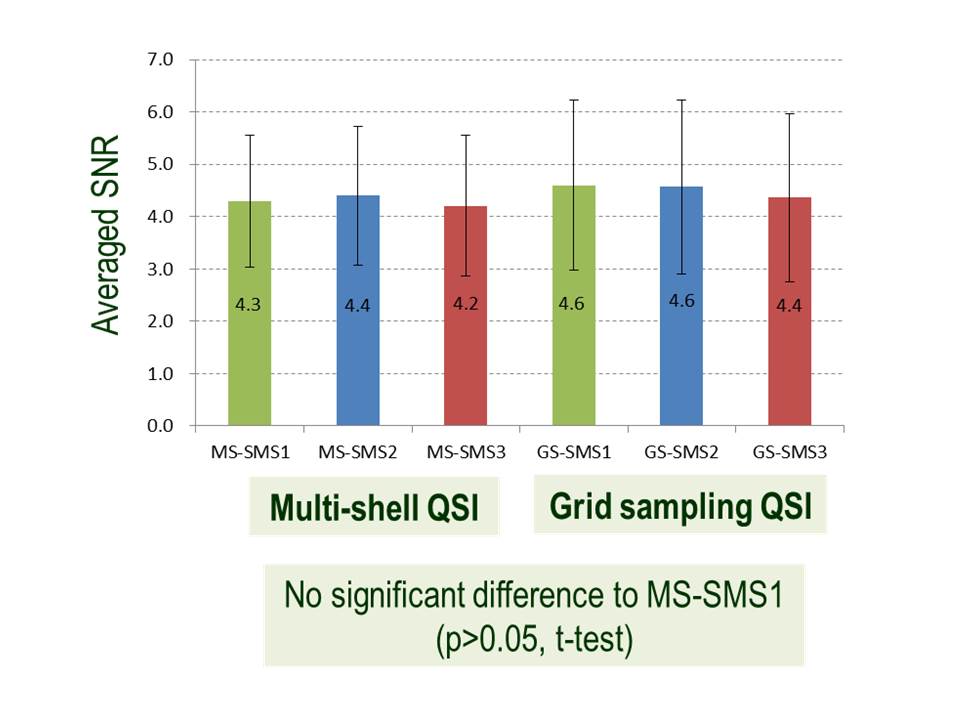
Effect of SMS factors and sampling methods for human brain: Figure 3 shows representative slices of MD mapping on a human brain. Figure 4 shows Bland-Altman plots compared with msQSI SMS1. The plots showed similar trends to Figure 2b. gsQSI also showed wider range of MD than msQSI. Figure 5 shows significantly different MD values (in red) from msQSI SMS1 in 181 perceled region of human brain. msQSI SMS3 showed the largest difference. On the contrary, gsQSI showed constant difference to msQSI. Figure 6 shows SNR on both msQSI and gsQSI. There were no significant differences among the QSI method and SMS factors.
LIMITATIONS
Only one healthy volunteer was investigated in this study. For better statistical reliability, further investigation with a larger number of participants is needed. Further investigations are needed before clinical applications can be countenanced.CONCLUSION
The MDs of msQSI and gsQSI were different. SMS factors on msQSI showed difference among the acceleration. On contrary, SMS factors on gsQSI did not show any difference among the acceleration.Acknowledgements
No acknowledgement found.References
[1] Setsompop et al., MRM, 2012; 67: 1210-1224
[2] Sakai et al., Proceedings of the ISMRM 2017, 3465
[3] Cohen and Assaf, NMR Biomed, 2002; 15: 516-542
[4] Oishi et al., Nuroimage 2009; 46(2): 486-499
[5] Diffeomap, http://www.mri-resource.kennedykrieger.org/software
[6] Steckner, Med Phys 37(9) 2010 5072-9.
Figures