5350
Diffusion and Perfusion Analysis using Intravoxel Incoherent Motion (IVIM): A Twenty Patient Study with OsteosarcomaEsha Baidya Kayal1, Devasenathipathy Kandasamy2, Kedar Khare3, Raju Sharma2, Sameer Bakhshi4, and Amit Mehndiratta1,5
1Centre for Biomedical Engineering, Indian Institute of Technology, Delhi, New Delhi, India, 2Radiodiagnosis, All India Institure of Medical Sciences, New Delhi, New Delhi, India, 3Department of Physics, Indian Institute of Technology, Delhi, New Delhi, India, 4Department of Medical Oncology, IRCH, All India Institure of Medical Sciences, New Delhi, New Delhi, India, 5Department of Biomedical Engineering, All India Institute of Medical Sciences, New Delhi, New Delhi, India
Synopsis
Quantitative analysis of Intravoxel incoherent motion (IVIM) effect of diffusion weighted imaging can assess both diffusion and perfusion component of tissue separately. To the best of our knowledge, IVIM analysis in primary bone tumors has not been reported yet and no reference for IVIM parameter values in bone tumors is available for simulation study. We estimated quantitative IVIM parameters using state-of-the-art IVIM analysis method – Bi-exponential model with adaptive Total Variation penalty function (BE+TV) in a cohort of twenty patients with Osteosarcoma that is useful for IVIM analysis in bone tumors for prognosis and can serve as standard reference for future studies.
Purpose:
Quantitative analysis of Intravoxel incoherent motion (IVIM) effect of diffusion weighted imaging (DWI) can assess both diffusion and perfusion component of tissue separately1,2. Though Bi-exponential model (BE) and its variations have been used widely in research, however there is no standard methodology that is in clinical use2. To the best of our knowledge, IVIM quantitative analysis in primary bone tumors has not been reported and no reference IVIM parameter values in bone tumors are available. The purpose of this study was to perform quantitative IVIM parameter estimation using state-of-the-art IVIM analysis method - BE with adaptive Total Variation (TV) penalty function (BE+TV)3 in a cohort of twenty patients with Osteosarcoma.Methods:
IVIM dataset for twenty patients (n=20, M:F=18:2, Age=16.0±2.9yrs), with Osteosarcoma were acquired under the Institutional Review Board approved protocol (IEC-103/05.02.2016,RP-26/2016) before commencement of chemotherapy. The acquisition was performed on a 1.5T Philips Achieva MRI scanner with Spin Echo-Echo Planar imaging sequence at 11 b-values (0,10,20,30,40,50,80,100,200,400,800 s/mm2), with TR/TE=7541/67msec, matrix size=192×192, slice-thickness/Gap=5mm/0.5mm, field-of-view=250×250mm2, voxel-size= .98/3.52/5.0mm. Apparent diffusion coefficient (ADC) was estimated using mono-exponential (ME) model for b≥200s/mm2; as perfusion component is dominant in lower b-values. IVIM parameters Diffusion coefficient (D), Perfusion coefficient (D*), Perfusion fraction (f) were estimated using state-of-the-art IVIM analysis method, BE with adaptive Total Variation Penalty function (BE+TV)3. Commonly used IVIM analysis methodologies like BE model2, segmented techniques with 2-parameter fitting4,5, and 1-parameter fitting4,5 optimize the signal fitting at each voxel independently; overlooking the spatial context of the signal resulting in high noise in estimated parameters2. As spatial homogeneity in the tissue is expected physiologically, the image gradient based penalty Total Variation6 was incorporated in the BE+TV method3 to reduce non-physiological spatial inhomogeneity. BE+TV applies non-linear least square optimization for data fitting and the desired spatial homogeneity in the parametric images was achieved by updating the parametric images (D,D*,f) iteratively with the corresponding adaptive penalty function TV to produce qualitatively and quantitatively improved IVIM parameter estimation3. Region of interest (ROI) for tumor and normal tissue were demarcated for each slice manually by a radiologist (>9yrs of experience in cancer MR imaging) for all patients (Figure1.a&b). Tumor ROIs were drawn to include only solid tumor part, excluding bone and necrosis areas. Mean and standard deviation for the estimated quantitative parameters were calculated in tumor and normal tissue volumes. Nonparametric two-sample Kolmogorov-Smirnov (KS) test was perform among estimated parameters in normal and tumor tissue to evaluate statistically significant (p<0.05) difference. Coefficient-of-variation (CV) was calculated as a measure of heterogeneity to evaluate the regional variation within the tissue. Analysis methods were implemented in an in-house built analysis toolbox implemented in MATLAB® (MathWorksInc.,v2013,Philadelphia,USA).Results:
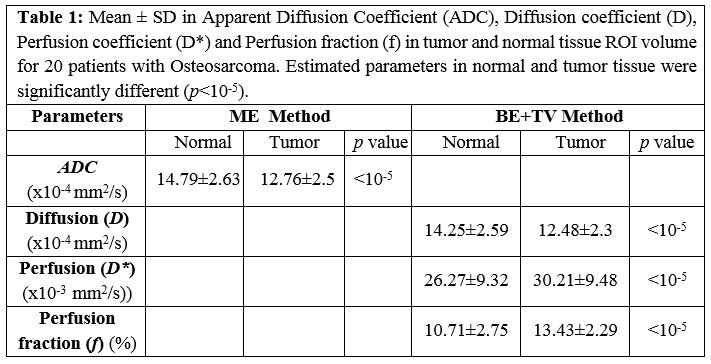
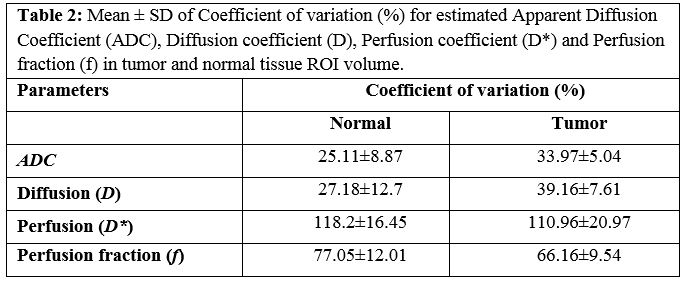
Figure1.c shows the IVIM signal fitting with BE+TV method in tumor and normal tissue ROIs presented in Figure1.b. Mean values of diffusion and perfusion parameters for tumor and normal ROI volume for 20 patients are presented in Table1. Both ADC & D were in close range to each other and were observed to be lower in tumor (12.76±2.5x10⁻⁴mm2/s and 12.48±2.3x10⁻⁴mm2/s respectively) than normal tissue (14.79±2.63x10⁻⁴mm2/s and 14.25±2.59x10⁻⁴mm2/s respectively); while both D* & f (30.21±9.48x10⁻³mm2/s and 13.43±2.29% respectively) were higher in tumor than normal tissue (26.27±9.32x10⁻³mm2/s and 10.71±2.75% respectively). Average inter-patient variability in estimated ADC,D,D*,f were 2.53x10⁻⁴mm2/s, 2.3x10⁻⁴mm2/s, 9.48 x10⁻³mm2/s and 2.29% respectively. Average intra-patient variations in estimated ADC,D,D*,f in tumor volume across all data were observed as 4.38±0.79x10⁻⁴mm2/s, 4.7±0.76x10⁻⁴mm2/s, 25.68±3.55x10⁻³mm2/s and 8.82±2.39% respectively. CV for all parameters in normal and tumor tissue volume is represented in Table2. Average CV for estimated ADC,D,D*,f in normal and tumor tissue volume were observed to be 25-34%, 27-39%, 110-118% and 66-77% respectively. Estimated parametric maps for ADC,D,D*,f for one representative patient are shown in Figure2.Discussion:
Estimated ADC (mean:12.76±2.5x10⁻⁴mm2/s; range:7.08-17.58x10⁻⁴mm2/s), and estimated D (mean:12.48±2.3x10⁻⁴mm2/s; range:7.47-16.94x10⁻⁴mm2/s) were in agreement with each other and were comparable with reported ADC values in Osteosarcoma7. Though values for IVIM parameters (D,D* &f) in Osteosarcoma are not widely studied in literature, CV for D,D* &f in tumor were comparable with reported studies at the signal to noise ratio (SNR=20) similar to clinical setup3,5. Higher intra-patient variability in estimated D* and f in tumor volume might be due to the high heterogeneous nature of the tumor. Quantitative IVIM parameters using BE+TV method might be helpful in evaluating changes in tumor heterogeneity in the course of treatment.Conclusion:
IVIM parameters estimated using state-of-the-art IVIM analysis method - BE with adaptive Total Variation penalty function in Osteosarcoma are reported that are useful for IVIM analysis in bone tumors in the course of treatment and can serve as reference for future simulation studies.Acknowledgements
Authors would like to thank the Government of India for the funding support required for the study. EBK was supported with the research fellowship funds from Ministry of Human Resource Development, Government of India.References
- Le Bihan D. et al. Separation of Diffusion And Perfusion In Intravoxel Incoherent Motion MR Imaging. Radiology. Aug, 1988; 168(2):497-505.
- Koh D.M. et al. Intravoxel Incoherent Motion in Body Diffusion-Weighted MRI: Reality and Challenges. AJR. June, 2011;196: 1351–1361.
- Kayal EB. et al. Quantitative Analysis of Intravoxel Incoherent Motion (IVIM) Diffusion MRI using Total Variation and Huber Penalty Function. Med Phys. 2017 Aug 17. doi: 10.1002/mp.12520.
- Merisaari H. et al. Fitting methods for intravoxel incoherent motion imaging of prostate cancer on region of interest level : repeatability and gleason score prediction. Magn Reson Med. 2017;77:1249-1264. doi:10.1002/mrm.26169.
- Meeus EM. et al.. Evaluation of intravoxel incoherent motion fitting methods in low-perfused tissue. J Magn Reson Imaging. 2017;(45):1325-1334. doi:10.1002/jmri.25411.
- Rudin LI. et al. Nonlinear total variation based noise removal algorithms. Phys D. 1992;60(1-4):259-268. doi:10.1016/0167-2789(92)90242-F.
- Bajpai J. et al. Role of MRI in osteosarcoma for evaluation and prediction of chemotherapy response : correlation with histological necrosis. Pediatr Radiol. 2011;41:441-450. doi:10.1007/s00247-010-1876-3.
Figures
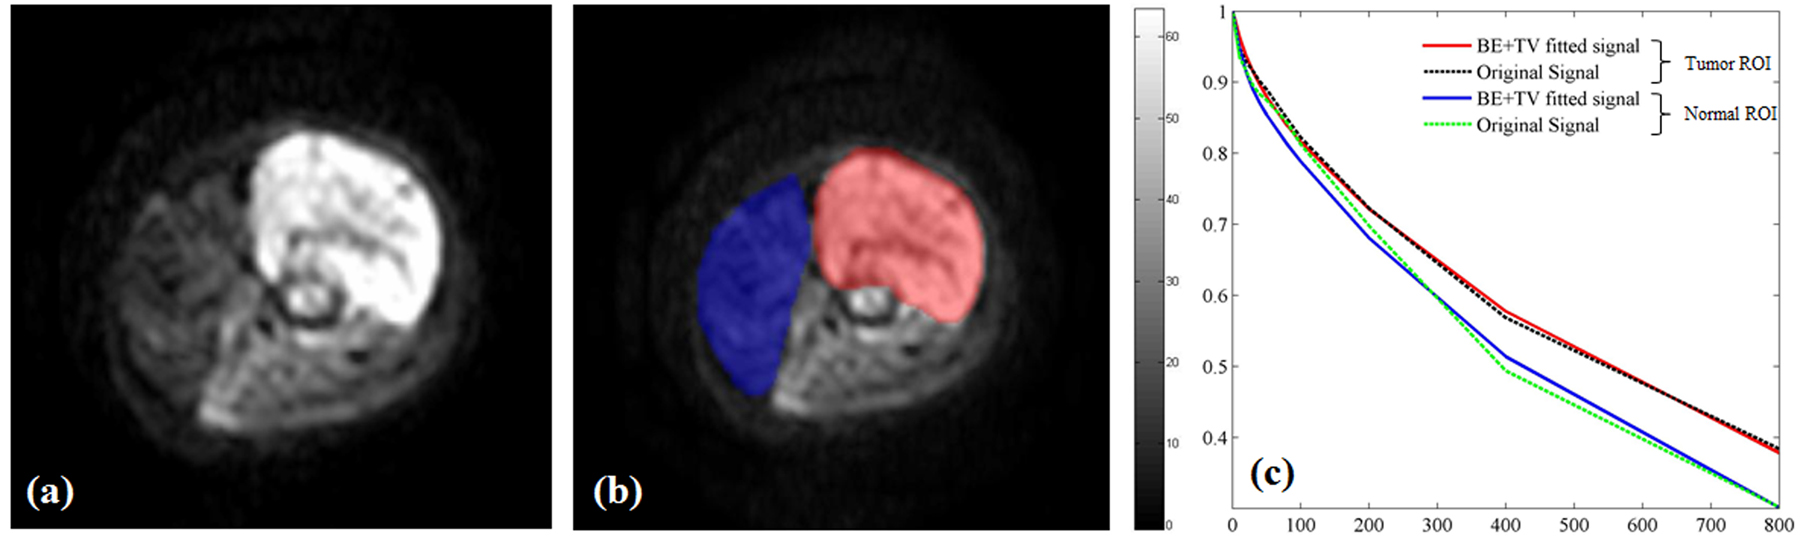
Figure 1: a) DWI
(b=800s/mm2) axial slices of a representative patient (M, 15 years)
with OS in right distal femur, b) ROIs drawn for tumor (red) and normal (blue)
tissue, c) Original and fitted signals for BE+TV method in tumor and normal
tissue ROIs.
.
.
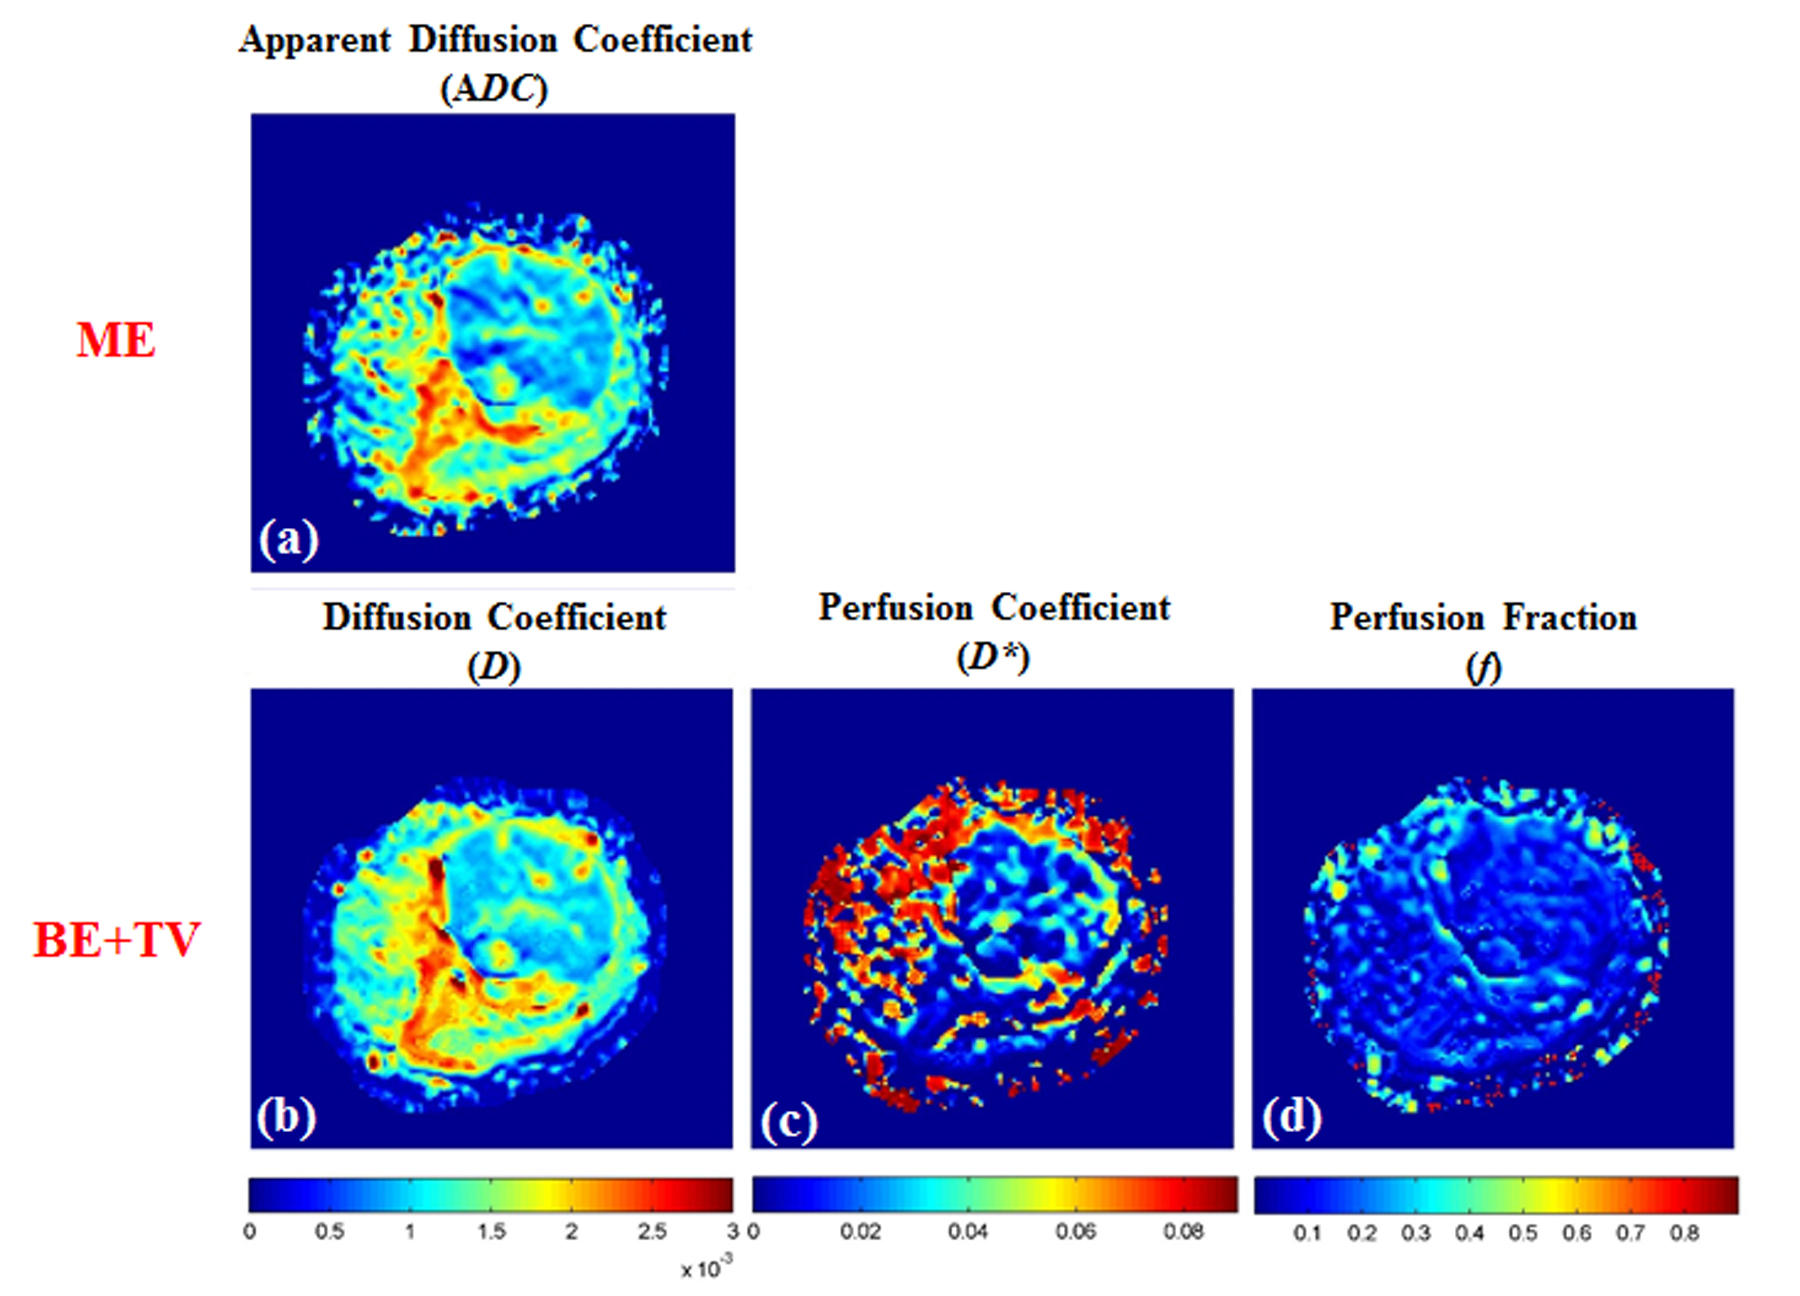
Figure
2: a) Apparent diffusion coefficient
(ADC); b) Diffusion coefficient (D); c) Perfusion coefficient (D*);
d) Perfusion fraction (f) estimated using BE+TV method for the slice
from the same representative patient depicted in Figure 1.a. In ADC and D map, comparatively more restricted diffusion can be seen in tumor
than normal tissue.