5349
Impact of scan and fitting parameters on the accuracy of parameter maps in IVIM-diffusion-MRI of the knee joint1Departement of Diagnostic and Interventional Radiology, Ulm University Medical Center, Ulm, Germany, 2Departement of Internal Medicine II, Ulm University Medical Center, Ulm, Germany
Synopsis
Intravoxel Incoherent Motion (IVIM) imaging has proven its potential for combined diffusion and perfusion imaging of synovitis in the knee joint. In this abstract the impact of the maximum B-value Bmax and the threshold B-value Bcutoff - which separates the B-values for the fitting function in perfusion and non-perfusion part - were investigated. The parameter maps show high dependency on Bcutoff and only slight variations on Bmax.
Purpose
Intravoxel Incoherent Motion
(IVIM) imaging has proven its potential for combined diffusion and perfusion
imaging of synovitis in the knee joint [1]. In literature, a broad spectrum of
maximum B-value Bmax and threshold B-value Bcutoff for
separating the perfusion and diffusion fractions used for IVIM diffusion
imaging. Since the analysis of the very small structures in the knee joint is technically
challenging, it is mandatory to use optimized scan and fitting parameters. The
general dependence of IVIM parameters on the Bcutoff has already been
investigated for liver and kidney by Wurnig [2]. In this work, the variation of
IVIM parameters in muscle and synovia depending on Bcutoff and Bmax
of the knee joint was analyzed.Methods and Materials
Five volunteers (mean age: 27 ± 4 years) and 2 patients (20 ± 1 years) were included. All imaging was performed on a 3T whole body MRI (Skyra, Siemens Medical, Germany). Volunteers underwent an examination including a survey scan and a RESOLVE [3] scan (TE = 58ms / TR = 3810ms; FOV = 180x180mm2; res: 1.3x1.3mm2, slice = 3mm; scan duration 10:29min) with 15 B-values. For investigation of the threshold dependency, the volunteers underwent a protocol where B-values were increased by the default minimum step size of 50mm/s2 from B = 50 to 300 mm/s2 and in steps of 100mm/s2 to a B-value of 800 mm/s2. To investigate the effect of varying Bmax ,additional high B-values (1000, 1250 and 1500 mm/s2) were acquired. Patients underwent a RESOLVE scan with 10-B-values (B= [0 50 100 150 200 300 400 600 800 1000] mm/s2) with a scan duration of 5:32min (TE = 57ms/ TR = 3400ms) during clinical routine and an additional post-contrast transverse T1-weighted scan.
For calculation of the diffusion D, pseudo-diffusion D* and perfusion fraction f parameter maps, the standard IVIM fitting model was applied:
$$ S = S_0 ((1-f)e^{-bD}+fe^{-bD*})$$
The fitting algorithm is separated in two steps. In the first step, only B-values above the threshold Bcutoff were used. Thus the perfusion dependent effects can be neglected and the fitting model results as a mono-exponential decay function , where S0 is obtained from the MR image with no diffusion gradient. In the second step, all B-values where used. D and f are used from the first part of the fitting algorithm to obtain D*.
The threshold for the segmented fit varied from B = 50 to 300 mm/s2. For quantitative analyses, an ROI for was manually identified in the muscle. For the patients, the synovium and effusion was investigated additionally.
Results
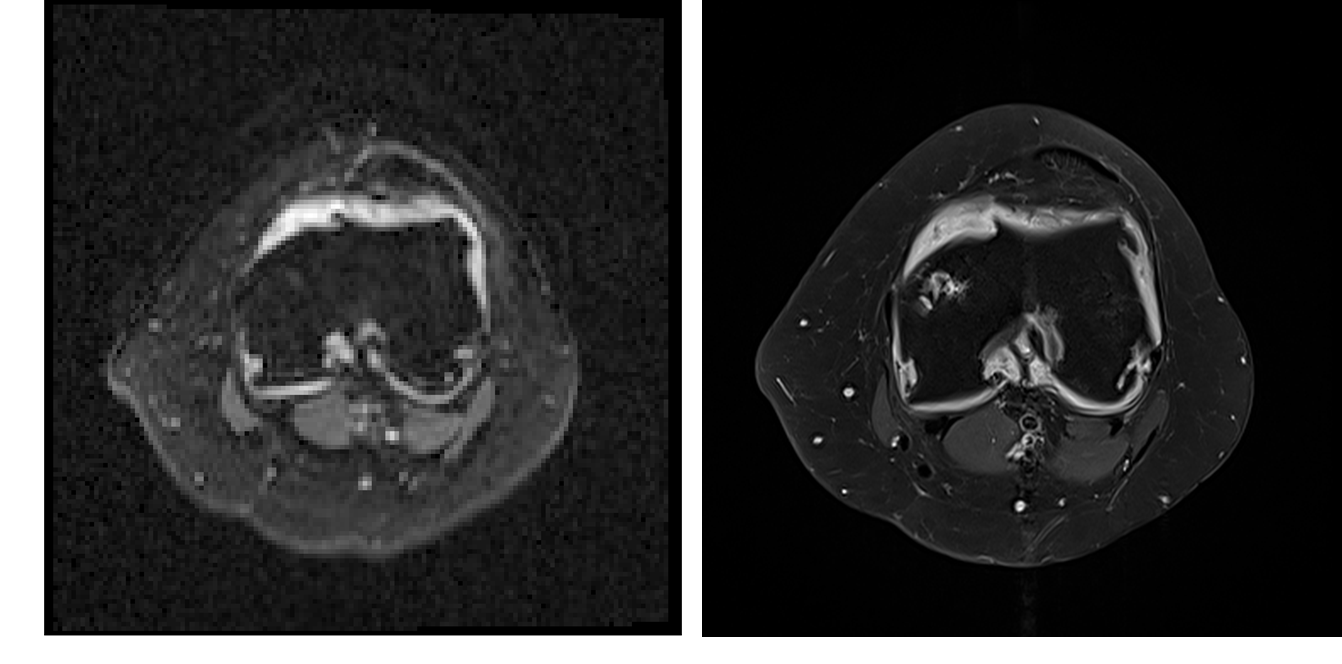
The contrast-enhanced T1-weighted image (a) and the diffusion weighted image at B = 1000mm/s2 (b) are exemplarily shown for a patient with juvenile idiopathic arthritis of the knee in Figure I.
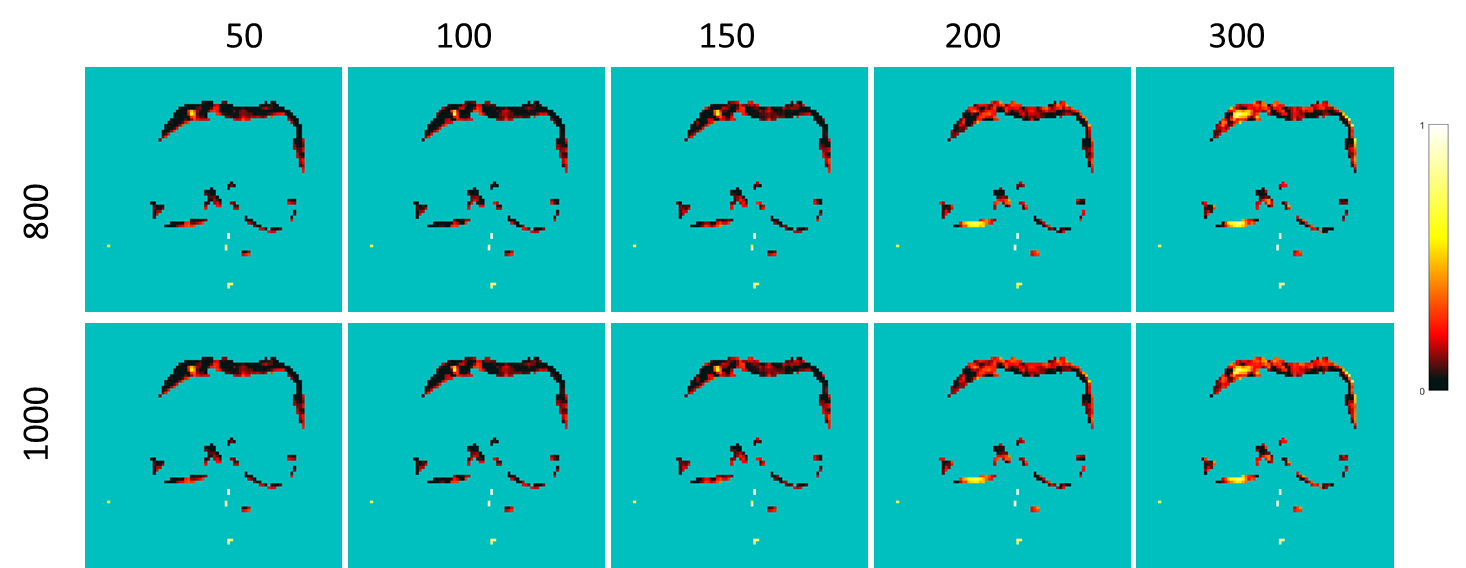
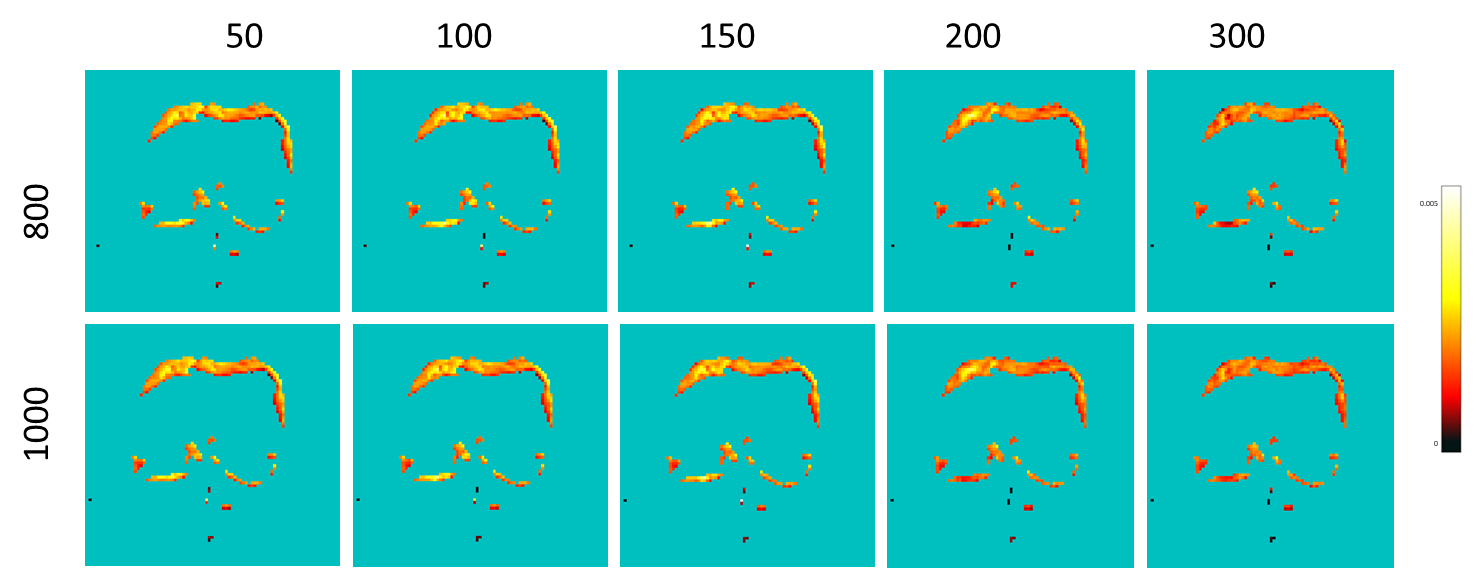
The related parameter maps for perfusion fraction f and diffusion coefficient D are respectively shown in Figure II and Figure III. For the perfusion fraction and diffusion coefficient map an obvious change of the map structure can be observed for Bcutoff> 150.
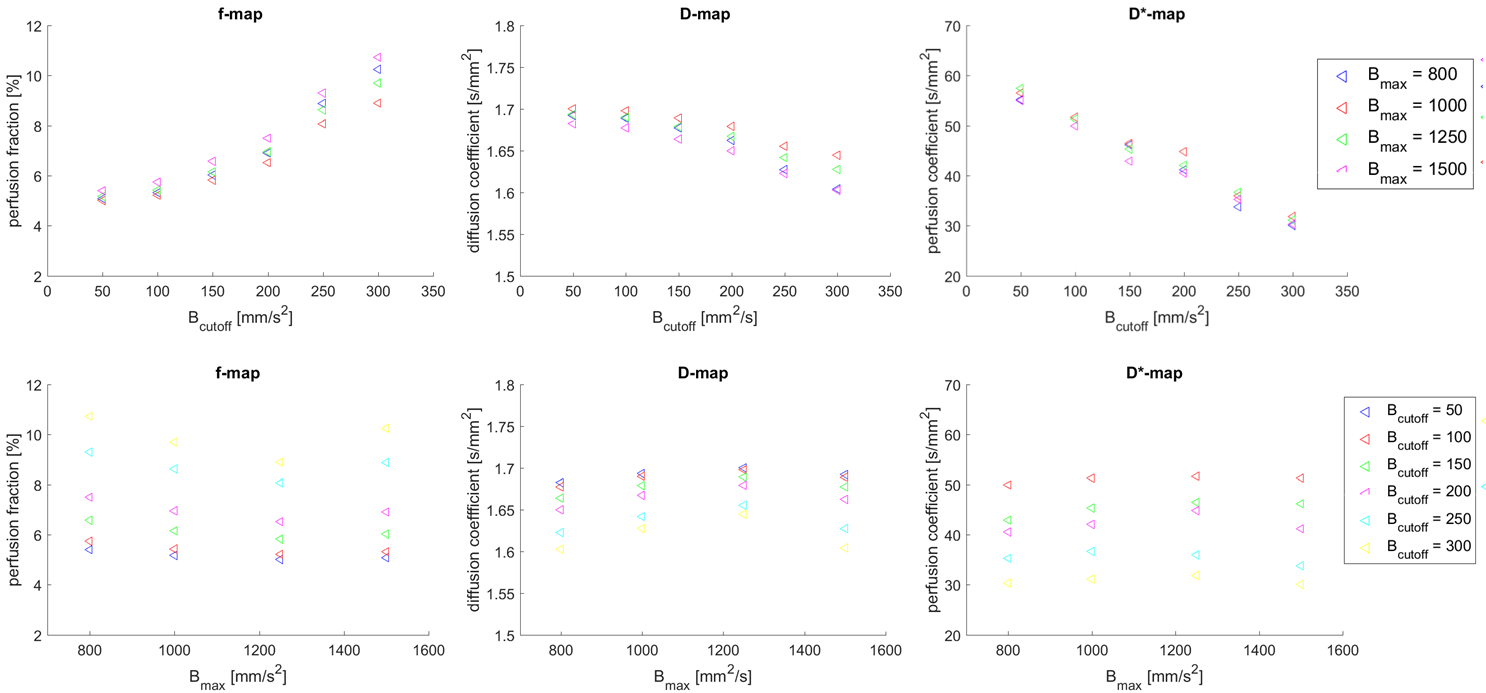
Figure IV presents the quantitative evolution of the IVIM parameters in the muscle over varying Bcutoff (upper row) and Bmax (lower row). The quantitative results confirm the behavior of the parameter maps: While the parameters show only slight variations over Bmax , a strong dependency of all three IVIM parameters on the B-value threshold can be observed. The perfusion fraction f increases with increasing Bcutoff , while the diffusion and perfusion coefficients D and D* result reduced.
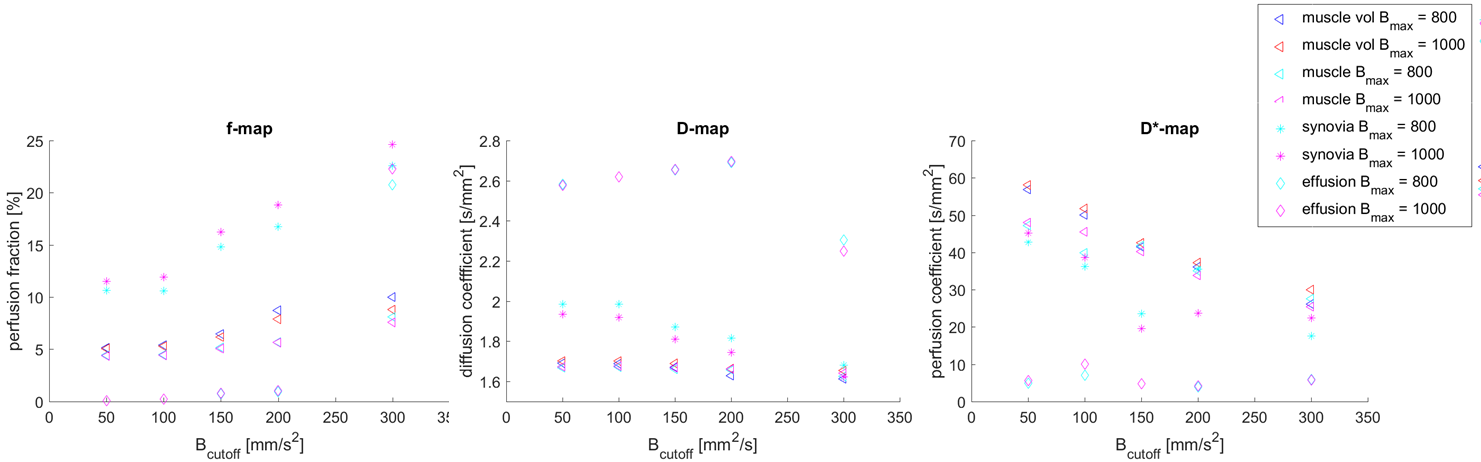
Comparison of IVIM parameters of muscle synovia and effusion are presented in Figure V. As expected, the effusion yields a very low perfusion and high diffusion component. Values from perfusion fraction are separated with increasing Bcutoff and diffusion coefficient of synovia and muscle comply to each other.
Discussion and Conclusion
Our explorative study confirms the theoretically established assumption of significant perfusion effects with B-values between 0 and about 200. Derived IVIM parameters strongly depend on the specific threshold for the fitting algorithm. Since there is no gold standard for estimation of IVIM parameters, no optimum threshold can be specified. It can only be concluded that a too high threshold results in underestimation of the perfusion and diffusion values, thus overestimating the perfusion fraction. A too low threshold reverses the effect. From the maps as well as from the quantitative analyses it can be concluded that for Bcutoff= 300 mm/s2 no reasonable results can be received, since using this cut-off the diffusion coefficient of synovia and muscle result in the same order and a perfusion fraction of 20% is calculated for joint effusion.Acknowledgements
References
[1] Hilbert F. et.al. Intravoxel Incoherent motion magnetic resonance imaging of the knee joint in children with juvenile idiopathic arthritis. Pediatr Radiol. 2017 May;47(6):681-690
[2] Wurnig M.et. al. Systematic Analysis of the Intravoxel Incoherent Motion Threshold Separating Perfusion .Magn Reson Med. 2015 Nov;74(5):1414-22.
[3] Porter D. et al. High resolution diffusion-weighted imaging using readout-segmented echo-planar imaging, parallel imaging and a two-dimensional navigator-based reacquisition. Magn Reson Med 62(2): 468-475
Figures