5348
Digital DWI phantoms for non-Gaussian diffusion with Rician noise1Radiology, University of Michigan, Ann Arbor, MI, United States
Synopsis
Multi-parametric diffusion models describe non-Gaussian diffusivity of tissue observed by quantitative diffusion weighted imaging (qDWI). The ground-truth values for assumed model parameters are useful for both testing the analysis algorithms and optimizing qDWI acquisition. These values can be provided by virtual phantoms, termed digital reference objects (DROs), based on forward modeling. Here we describe a tool to generate DWI DICOM DROs with varying diffusivity model parameters and b-values including physical noise. Application examples are shown for Kurtosis, Stretched Exponential and Perfusion-fraction Intra-Voxel Incoherent-Motion DWI DROs to quantify noise-induced bias and variation in derived qDWI parametric maps.
Introduction
Multi-parameter models are being explored to quantify non-Gaussian tissue diffusivity1-3 observed by diffusion weighted imaging (DWI). To improve fidelity of derived quantitative metrics, both optimization of DWI acquisition protocol and evaluation of fit algorithm are desired. This work presents the tools to generate digital DWI phantoms that provide ground-truth diffusion model parameters and simulate physical acquisition noise to facilitate identification of model-specific and noise-induced errors.Methods
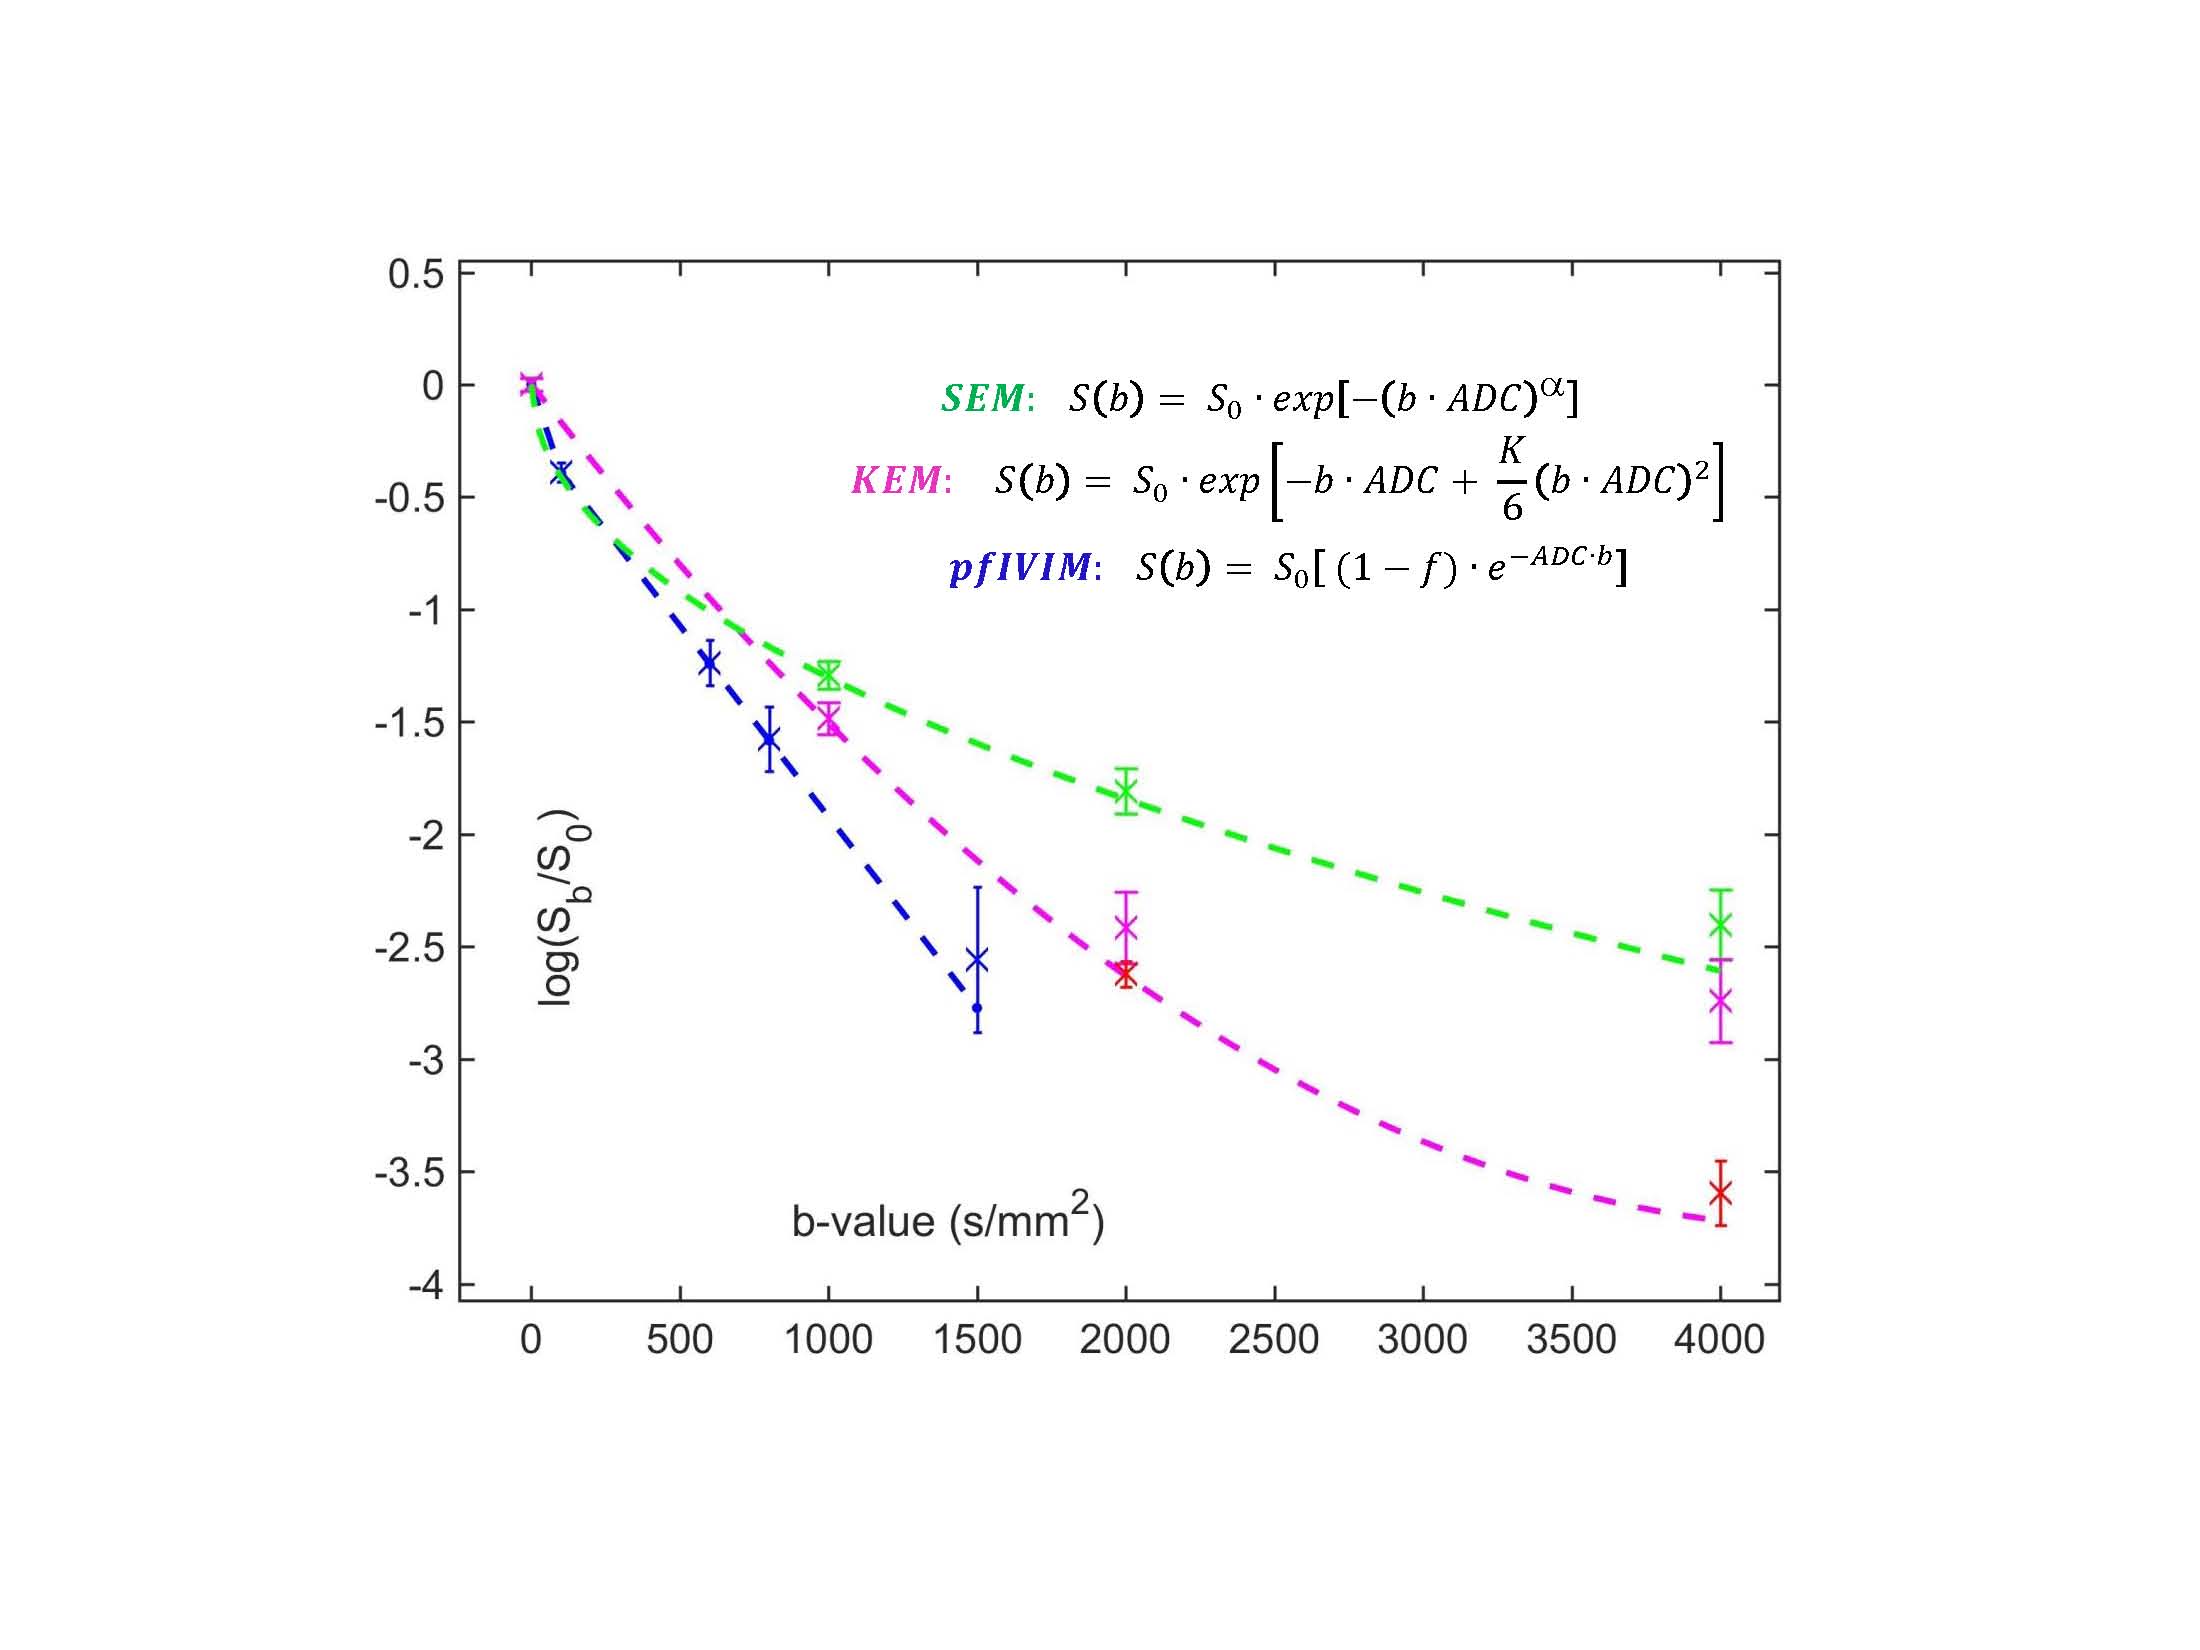
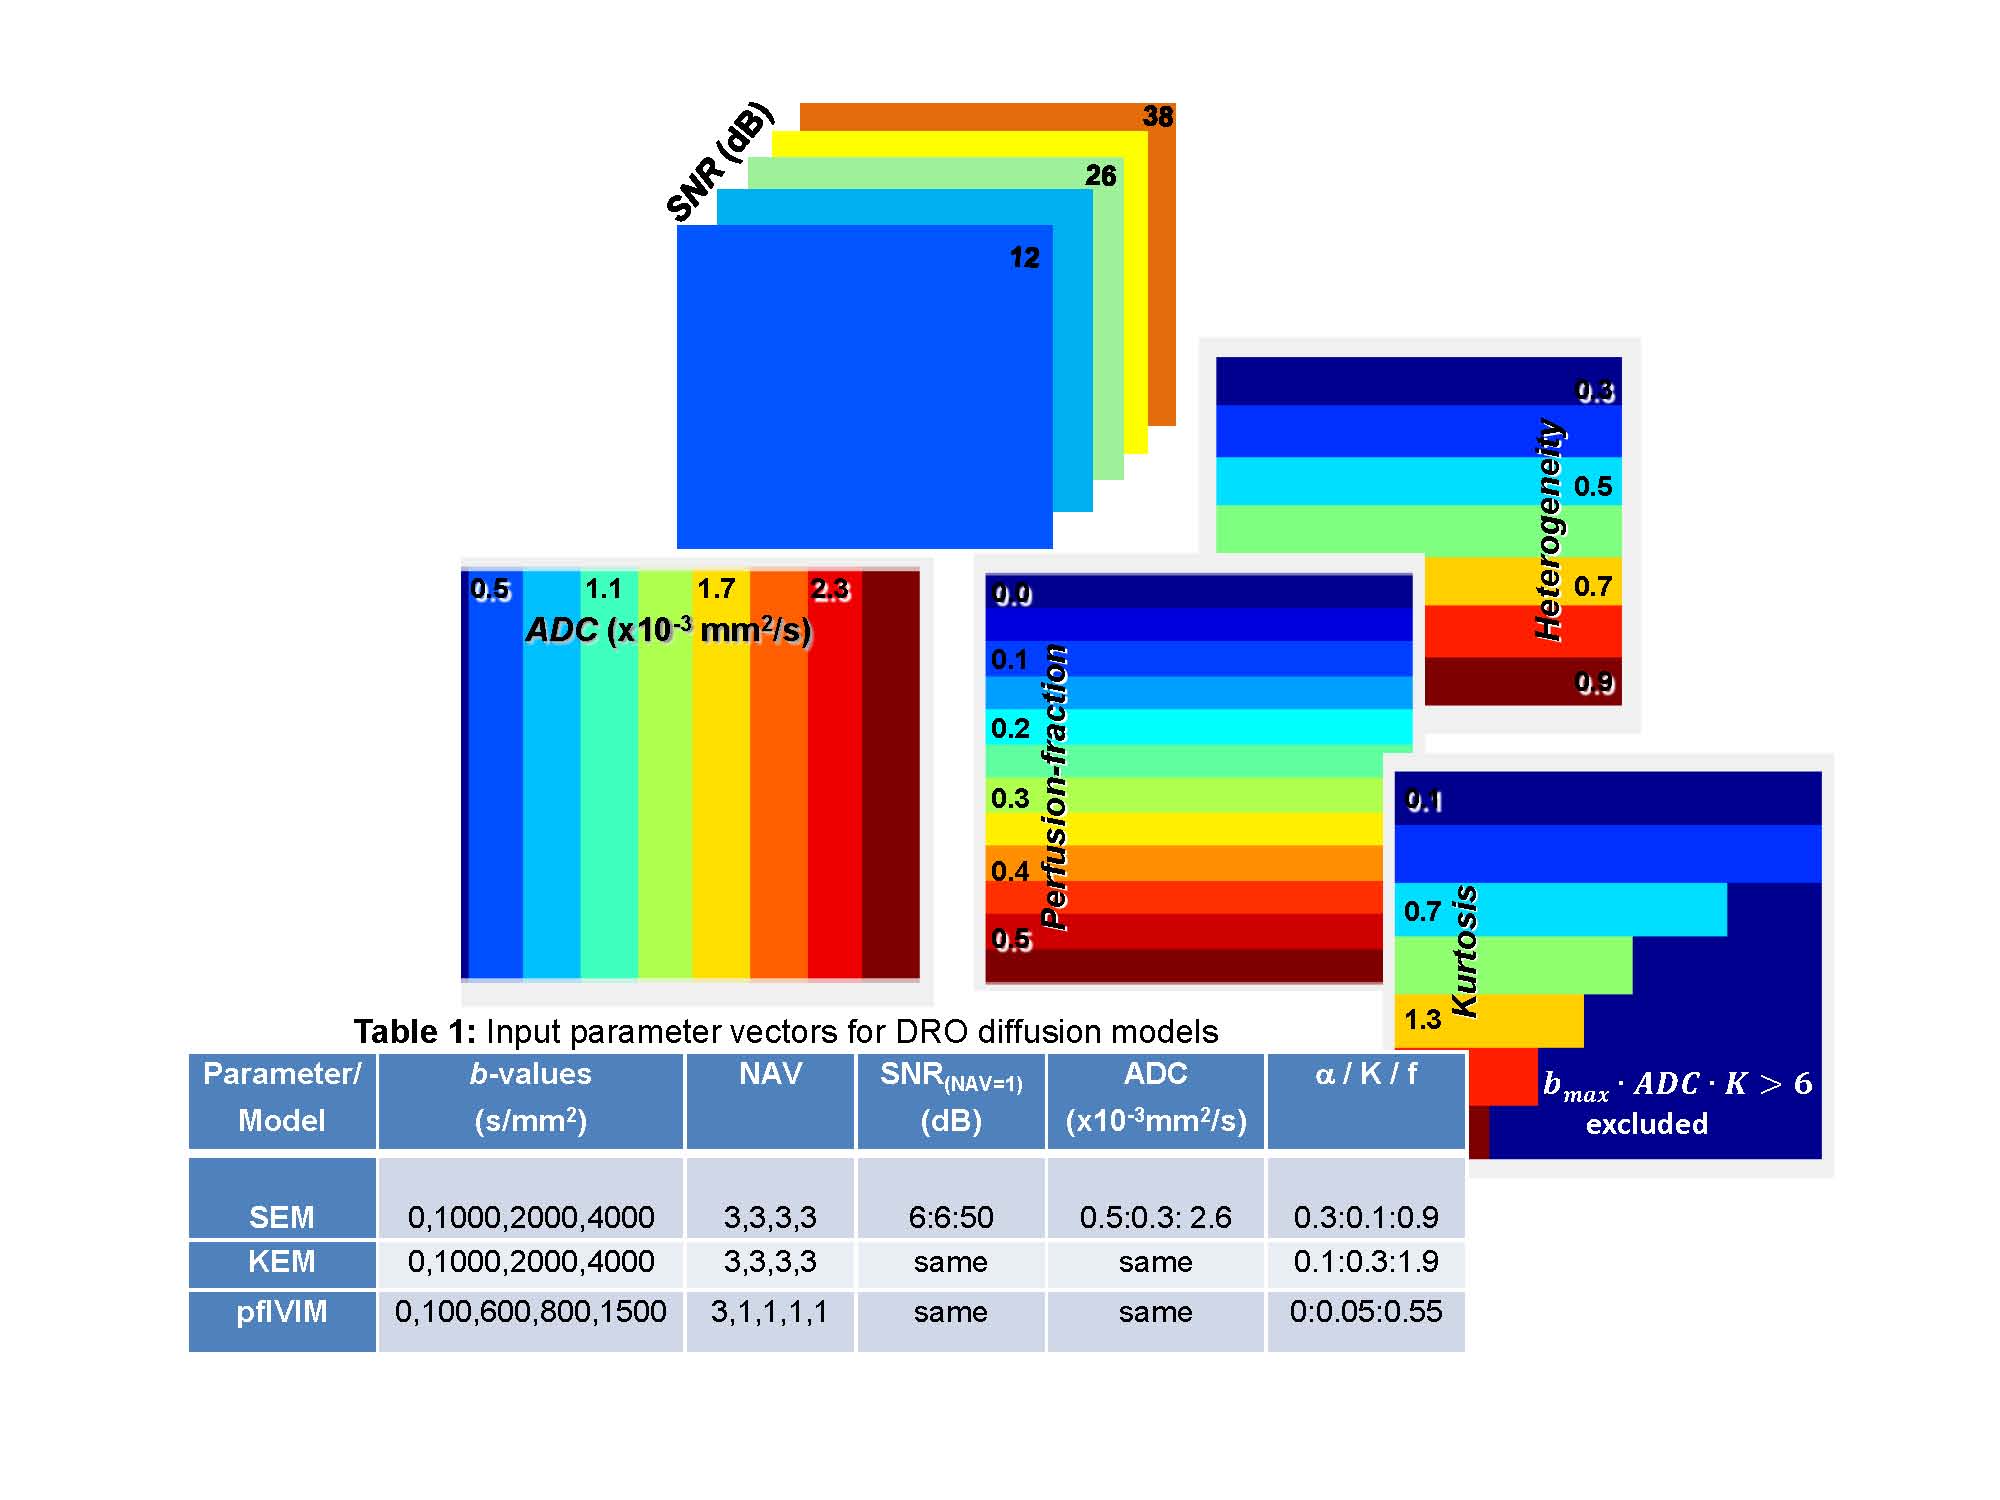
DWI signal variation with b-value were computed according to the analytical expressions in Figure 1 (legend) for perfusion-fraction Intra-Voxel Incoherent Motion (pfIVIM)3, kurtosis (KEM)2, and stretched exponential (SEM)1 models. Here, S0 is the T2w signal at b=0, ADC denotes an isotropic Apparent Diffusion Coefficient, f – perfusion-fraction, K - kurtosis, α - degree of heterogeneity. Input S0 = 1000 a.u. was used for all models. To simulate conventional trace-DWI acquisition, Rician noise was generated by taking the geometric mean of three-direction magnitude data (b>0) from (pseudo) quadrature acquisition with additive complex random noise, sampled from a Gaussian distribution with a standard deviation, SDn = 10. Input SNR was varied by S0-attenuation. Arbitrary number of averages (NAVs) was allowed for different b-values. The 64-bit numerical precision was used for the simulation. The input parameter vectors for three DWI DRO models are summarized in Table 1 (Figure 2).
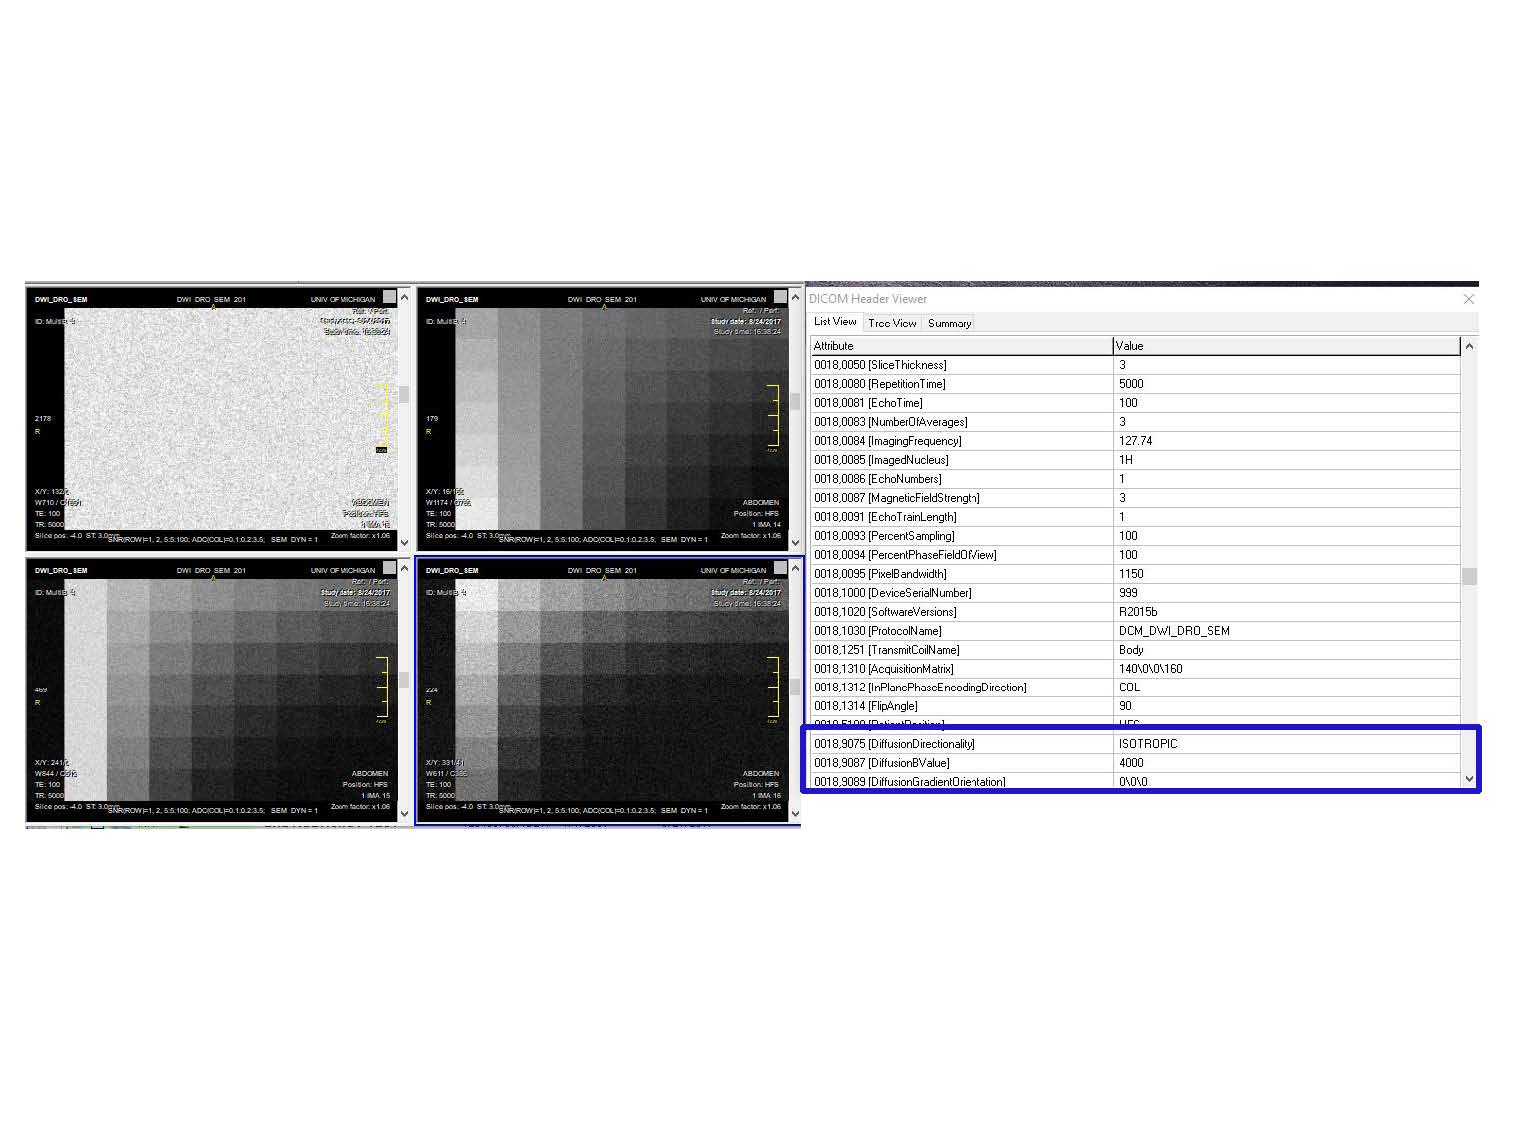
Numerically, each DRO was constructed as a 4D array consisting of 3D block-arrays per b-value, each with multiple 30x40 pixel patches corresponding to the diffusion model parameter pairs, and SNR = 20·log10(S0/SDn) varying along the third (slice) dimension. The leftmost 40-pixel-wide column of each DRO image contained signal-free pure (Rician) noise sample. Single-frame 16-bit DICOM series were generated for each DWI DRO. b-value and directionality metadata required for downstream quantitative analysis were captured in public DICOM tags4. The DWI DICOM was parsed back into numeric arrays (to evaluate noise truncation by DICOM conversion) before fitting to the test model functions. Fminsearch fit algorithm was used for SEM and quadratic and linear lscov for KEM and pfIVIM (b>100 s/mm2), respectively. The derived parametric maps were compared with the DRO inputs to estimate mean fractional bias (ratio of difference between mean fit and input to the input parameter) and SD or coefficient of variance (CV). All DRO generation and analysis was performed in Matlab (R2015b).
Results and Discussion
Figure 1 shows examples of DRO log-signal evolution with b-value for a single parameter pair illustrating noise-induced uncertainties (error-bars) and deviations (bias) with respect to the forward analytical model (dashed) amplified at higher b-values and lower NAVs. The ground-truth parametric maps generated for the input diffusion models in Table 1 are shown in Figure 2. The generated DWI DRO DICOM was successfully parsed and viewed by KPacs 1.6.0 (e.g., Figure 3), OsiriX 8.0.2 and ImageJ 1.45s, confirming back-compatibility with commonly-used DICOM viewers. Perfect fit (zero bias and SD) was achieved for each model in the absence of noise, justifying the choices of fit algorithms. With added noise, the imported 16-bit DICOM intensities deviated from the original 64-bit DRO (more for higher b-values and lower NAVs) indicating the finite noise truncation by DICOM scaling. For pure noise samples, SDn exhibited -30% Rician bias, and effectively scaled with NAV-1/2 , validating the proper implementation of pseudo-acquisition model. The resulting bias of conventional SNRb0 estimate increased exponentially for lower input dB (Table1), ranging from 6.4% (at 50dB) to 42% (at 6dB).
Figure 4 compares the fit results and statistics for pfIVIM parametric maps between two (4-fold different) SNR conditions. Both for ADC and f, bias (negative for ADC and positive for f) and uncertainty (CV/SD) are amplified at lower SNR. Bias is showing stronger dependence on ADC (horizontal color-gradient), while SD/CV is inter-dependent on both parameters (diagonal color-gradient). Similar statistics were generated for KEM and SEM models. ADC bias was amplified for higher ADC with lower f, K and higher α values. Higher absolute bias was predicted for f and K (amplified for lower parameter values) compared to ADC bias of pfIVIM and KEM, with the trend reversed for SEM. Substantial (>50%) bias and/or uncertainty was predicted toward lower or higher end of the parameter range for the derived quantitative metrics of all models with SNRb0<35dB typical of in vivo acquisition.
Conclusion
The generated DWI DRO DICOM (available upon request) allows evaluation of model-specific biases and uncertainties for in vivo parameter ranges and noise levels to guide qDWI optimization. Current analysis shows that SNR-optimized acquisition and processing are essential for the confident measurement of diffusion parameters for all multi-parameter qDWI models.Acknowledgements
National Institutes of Health Grants: R01CA190299, U01CA166104; and National Institute of Biomedical Imaging subcontract to QIBA RSNA: HHSN268201500021C.References
1Bennett KM, Schmainda KM, Bennett RT, Rowe DB, Lu H, Hyde JS. Characterization of continuously distributed cortical water diffusion rates with a stretched-exponential model. Magn. Reson. Med. 2003;50(4):727-34.
2Jensen JH, Helpern JA, Ramani A, Lu H, Kaczynski K. Diffusional kurtosis imaging: the quantification of non-gaussian water diffusion by means of magnetic resonance imaging. Magn. Reson. Med. 2005;53(6):1432-40.
3Lewin M, Fartoux L, Vignaud A, Arrivé L, Menu Y, Rosmorduc O. The diffusion-weighted imaging perfusion fraction f is a potential marker of sorafenib treatment in advanced hepatocellular carcinoma: a pilot study. Eur. Radiol.. 2011;21(2):281-90.
4NEMA, Enhanced Multi-frame DWI MR DICOM object (last accessed 11/2017); http://dicom.nema.org/medical/dicom/2016c/output/chtml/part03/sect_C.8.13.5.9.html
Figures