5347
Automated Pattern Recognition Analysis of Intravoxel Incoherent Motion (IVIM)-diffusion to Segment Hypo-perfused Stroke Region1Ulsan National Institute of Science and Technology, Ulsan, Republic of Korea, 2Athinoula A. Martinos Center for Biomedical Imaging, Massachusetts General Hospital, Cambridge, MA, United States
Synopsis
The variation in fitted perfusion factors (f) from different fitting models and the necessary parameter thresholdings are one of the challenges in the robust interpretation of intravoxel incoherent motion (IVIM) diffusion data [1-3]. The purpose of this study is to investigate the feasibility of applying constrained nonnegative matrix factorization (cNMF) to IVIM-diffusion data for the automatic segmentation of hypo-perfused stroke region of rat brain without any model-fittings nor thresholdings.
Introduction
The intravoxel incoherent motion (IVIM) diffusion [4] is an attractive method to measure diffusion and perfusion (microcirculation of blood in the capillary network) factors simultaneously without the need of contrast agent injection. In IVIM, diffusion coefficient (D), pseudo-diffusion coefficient (D*), and perfusion fraction (f) are main parameters of interest. However, due to variability of the IVIM models and the overfitting issues along with necessary thresholding requirements, the regional segmentation of damaged lesions from IVIM diffusion data is challenging in stokes. The purpose of this work is to apply constrained nonnegative matrix factorization (cNMF) to IVIM-diffusion data for the automatic segmentation of hypo-perfused stroke region of rat brain without any model-fittings nor thresholdings.Method
Simulation
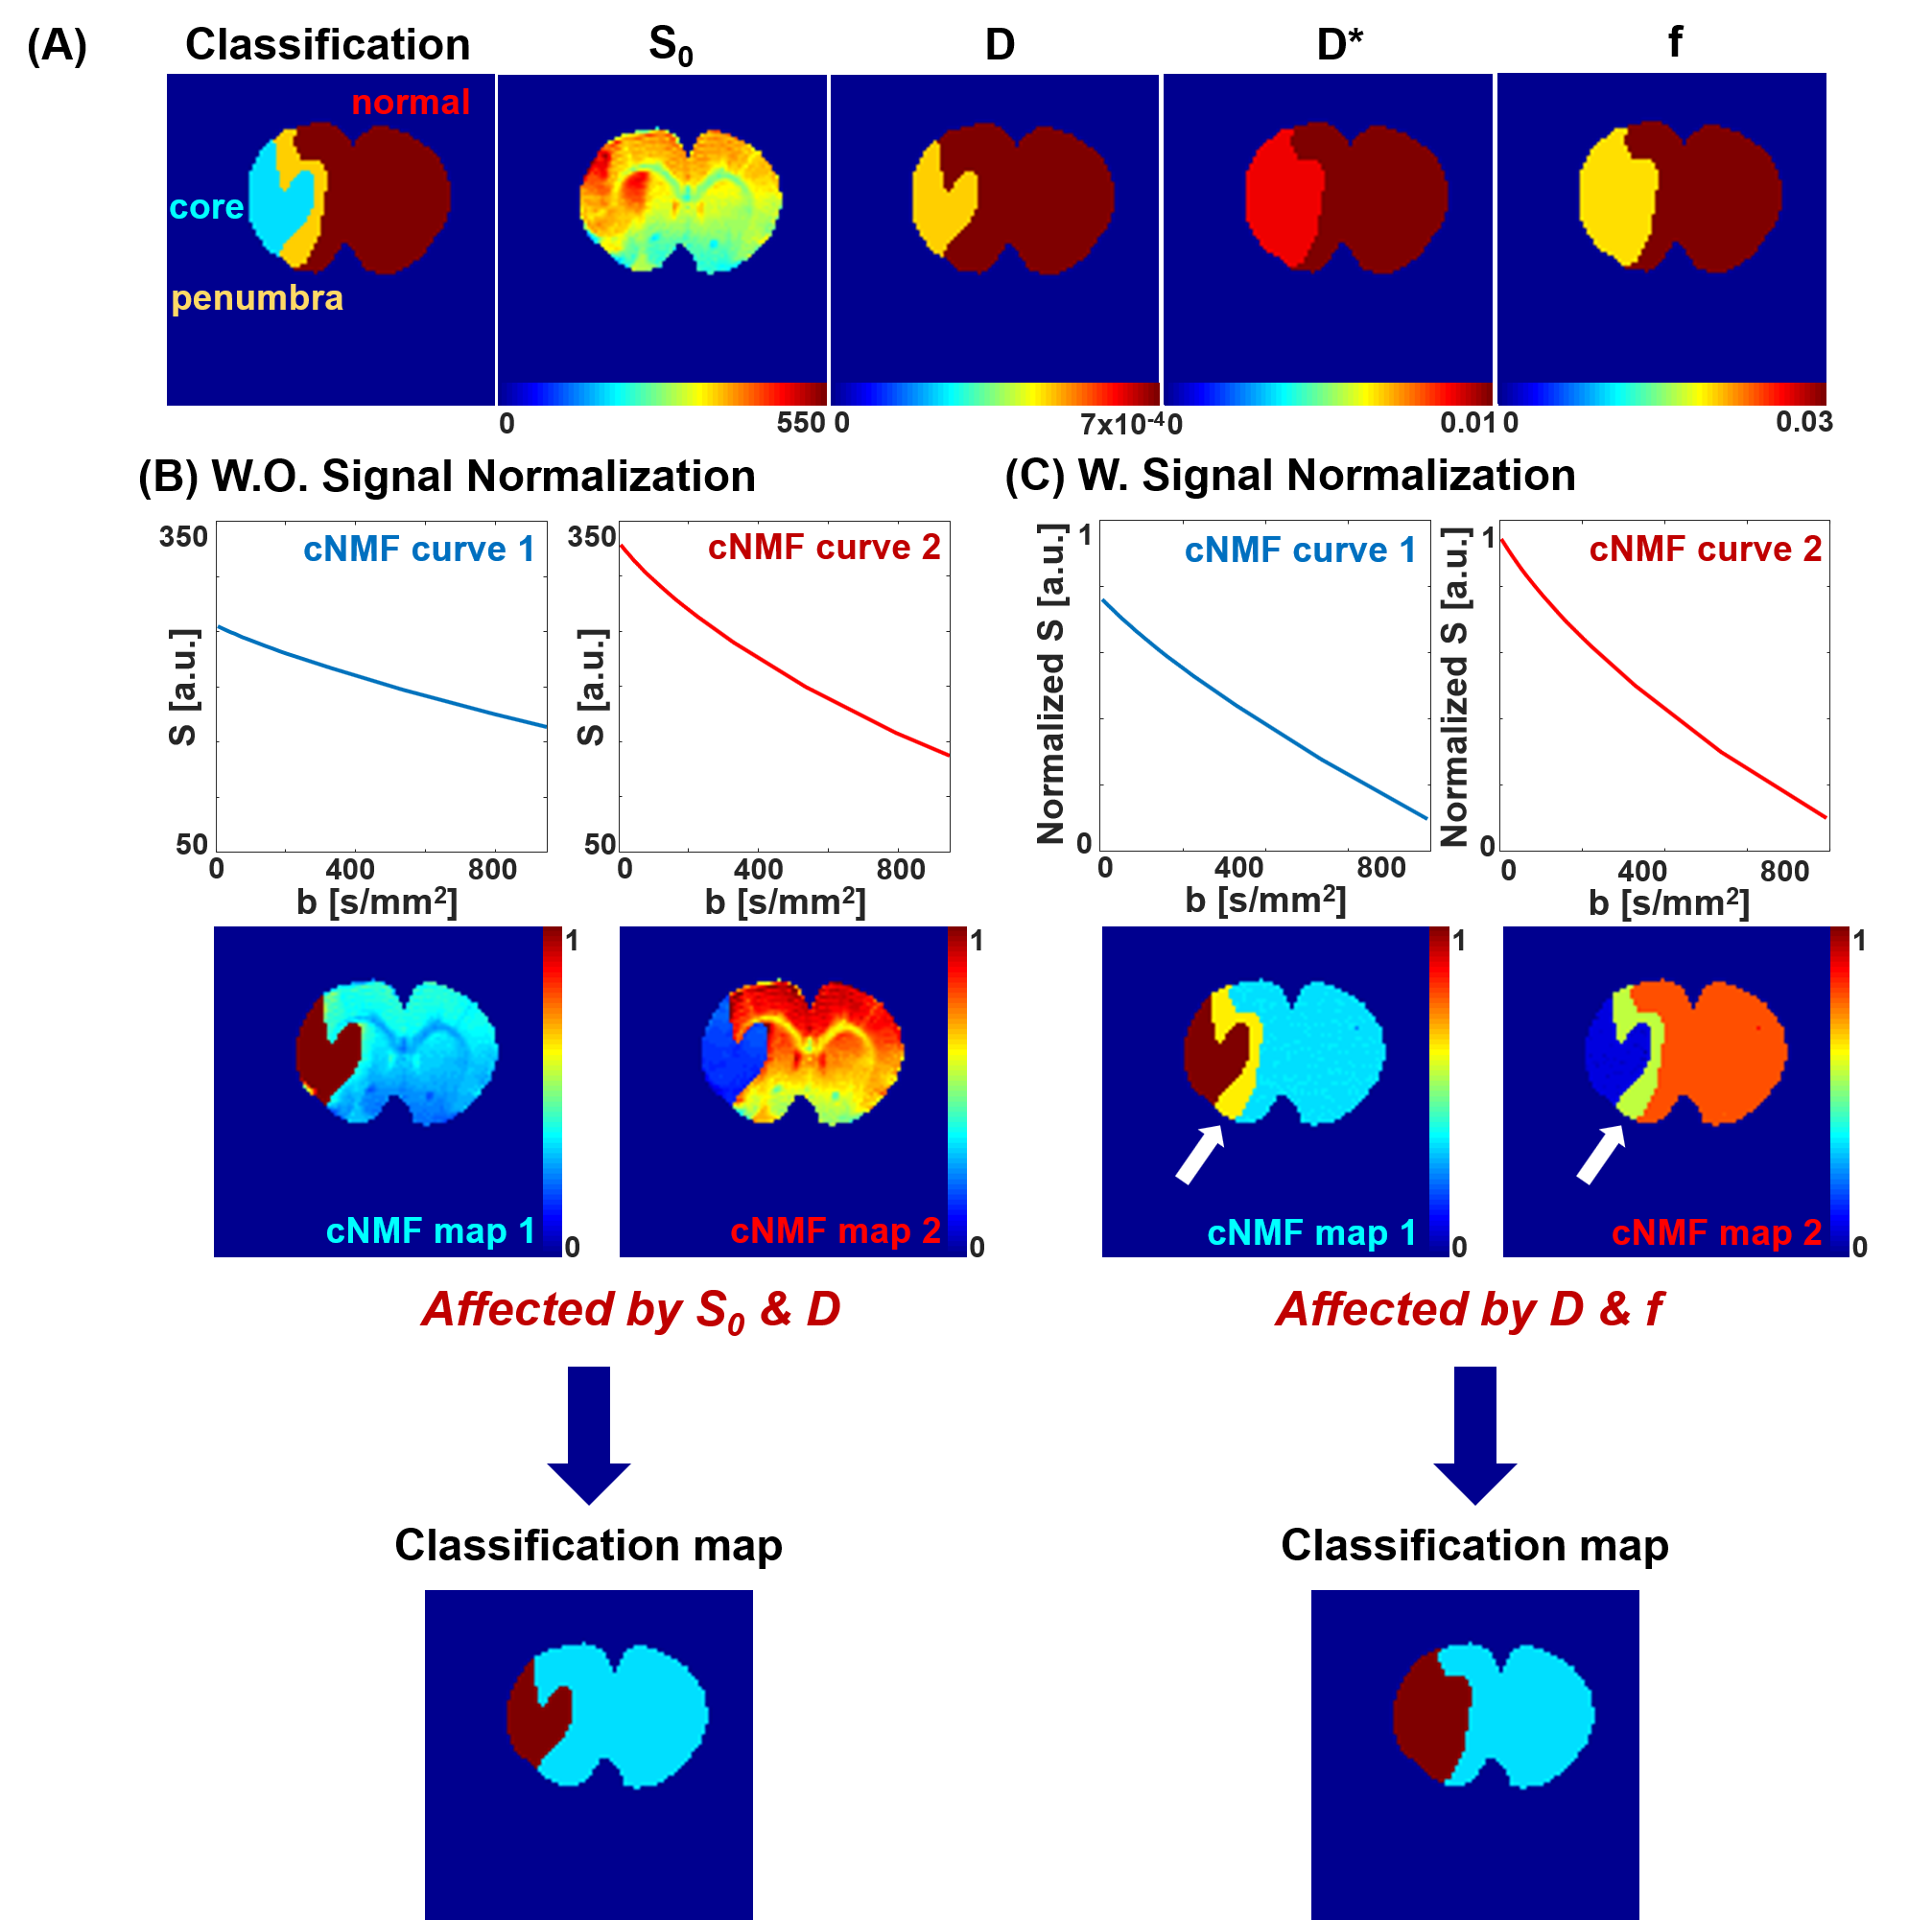
In simulation, the brain region was compartmentalized for normal, penumbra, and infarct region. The simulational input values of relevant IVIM parameters (D, D* and f) were obtained from the averaged experimental IVIM measurements and double exponential fitting of rat stroke model. Then, synthetic exponential attenuations were generated for each compartment following Eq.1
Eq.1 : Sb / S0 = (1-f)×e-bD + f×e-b(D+D*)
The algorithms and details of cNMF mostly followed the previous studies [5]. Specifically, the number of classifier was set as two to effectively distinguish single and double exponential attenuation curves. The cNMF weighting map was generated, which indicates the contribution of each cNMF representative curves in each voxel, and straightforward segmentation of normal, infarct, and hypo-perfusion regions was performed using both raw and normalized IVIM-diffusion signals.
Experiment
The rat model went through middle cerebral artery occlusion (MCAO), re-perfusing one hours later after occlusion. IVIM diffusion data was obtained by using EPI spin echo sequence with twenty b-values (5.9~941.5s/mm2). DSC-MR was performed with EPI sequence with monocrystalline iron oxide nano-particle (MION). The cNMF maps were obtained from both raw and normalized IVIM signals. Then automatic classification of stroke brain regions was correspondingly performed, and the results compared with relative cerebral blood volume (rCBV) map from DSC data.
Results
Simulation
The segmentation of brain region of from cNMF simulations are shown in Figure 1. Upper row shows the input-value distributions of spin density (S0), diffusion coefficient (D), pseudo-diffusion coefficient (D*), and perfusion fraction (f). Infarct core region has lowered D and f, and penumbra region has similar D and lowered f, in comparison with those values from normal region in contra-lateral brain. The change of D* was set to follow that of f [6]. Then, it is observed that the application of cNMF classification on raw (un-normalized) signals mostly separated infarct core from the rest areas due to distinctively lowered D values as shown in Figure 1-(B). Corresponding cNMF classification map with normalized signals were observed to mostly separate hypo-perfused lesion from the rest areas as shown in Figure 1-(C).
Experiment
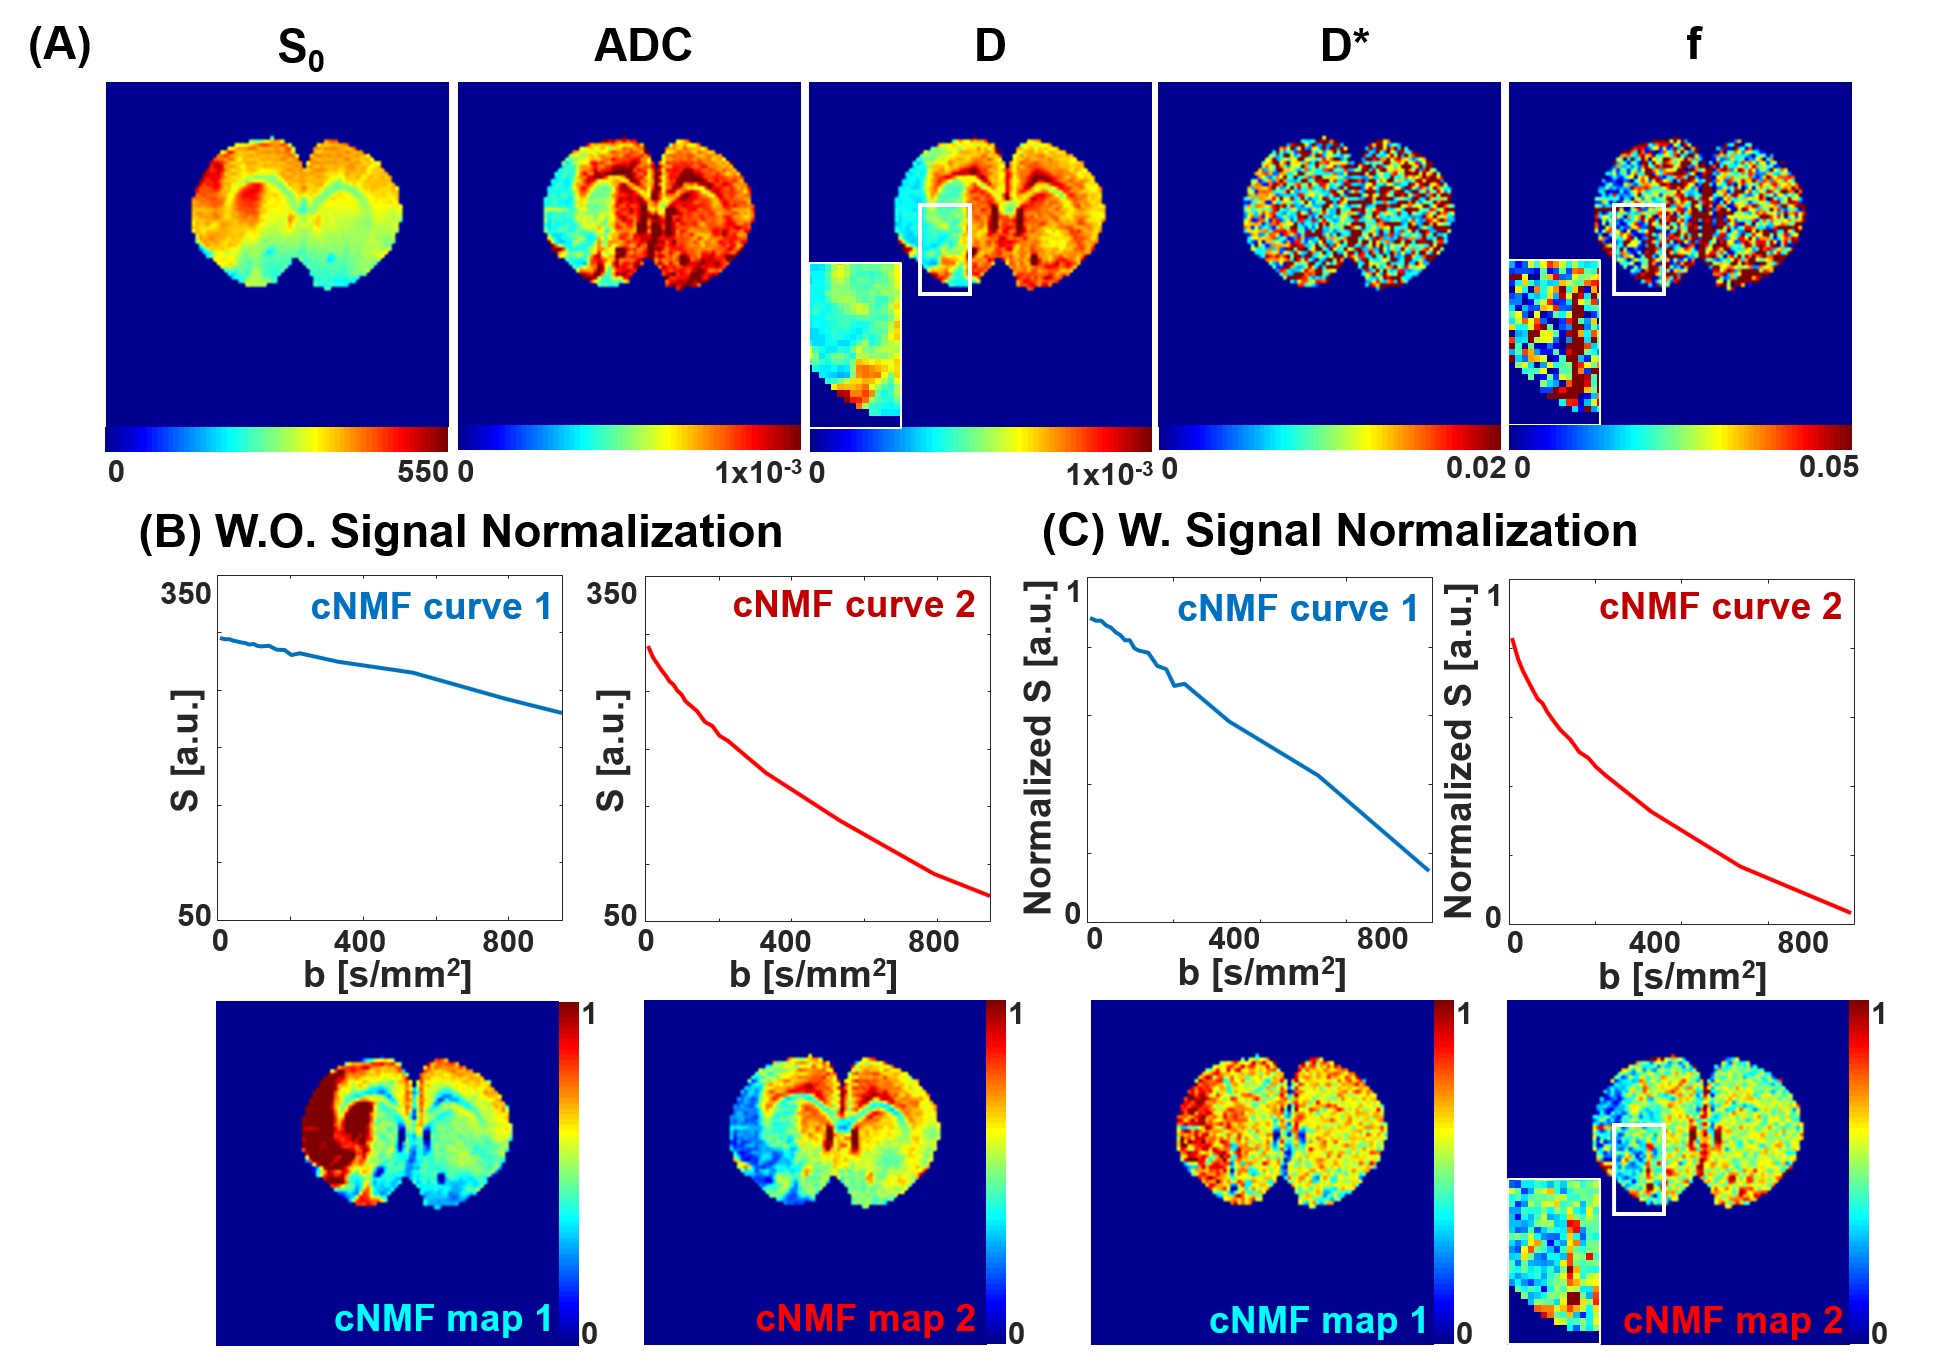
Figure 1-(A) shows fitted IVIM parameters (S0, D, D*, and f) from double-exponential fitting from Eq.1. The cNMF results with raw IVIM-diffusion signals were shown in Figure 2-(B). Highly weighted areas (red) of cNMF map 1, whose lowered diffusive behavior is apparent from representative curves, well corresponded to the areas with lowered D values in Figure 2-(A). The cNMF results with normalized IVIM-diffusion signals were shown in Figure 2-(C). Highly weighted areas (red) of cNMF map 1, whose lowered perfusive behavior is apparent from representative curves, well corresponded to the areas with lowered f values in Figure 2-(A). For example, highly perfused arterial vessel (white boxes) is both apparent in f map and cNMF map 2 of Figure 2-(C) (normalized IVIM), but not in cNMF map 2 of Figure 2-(B) (unnormalized IVIM).
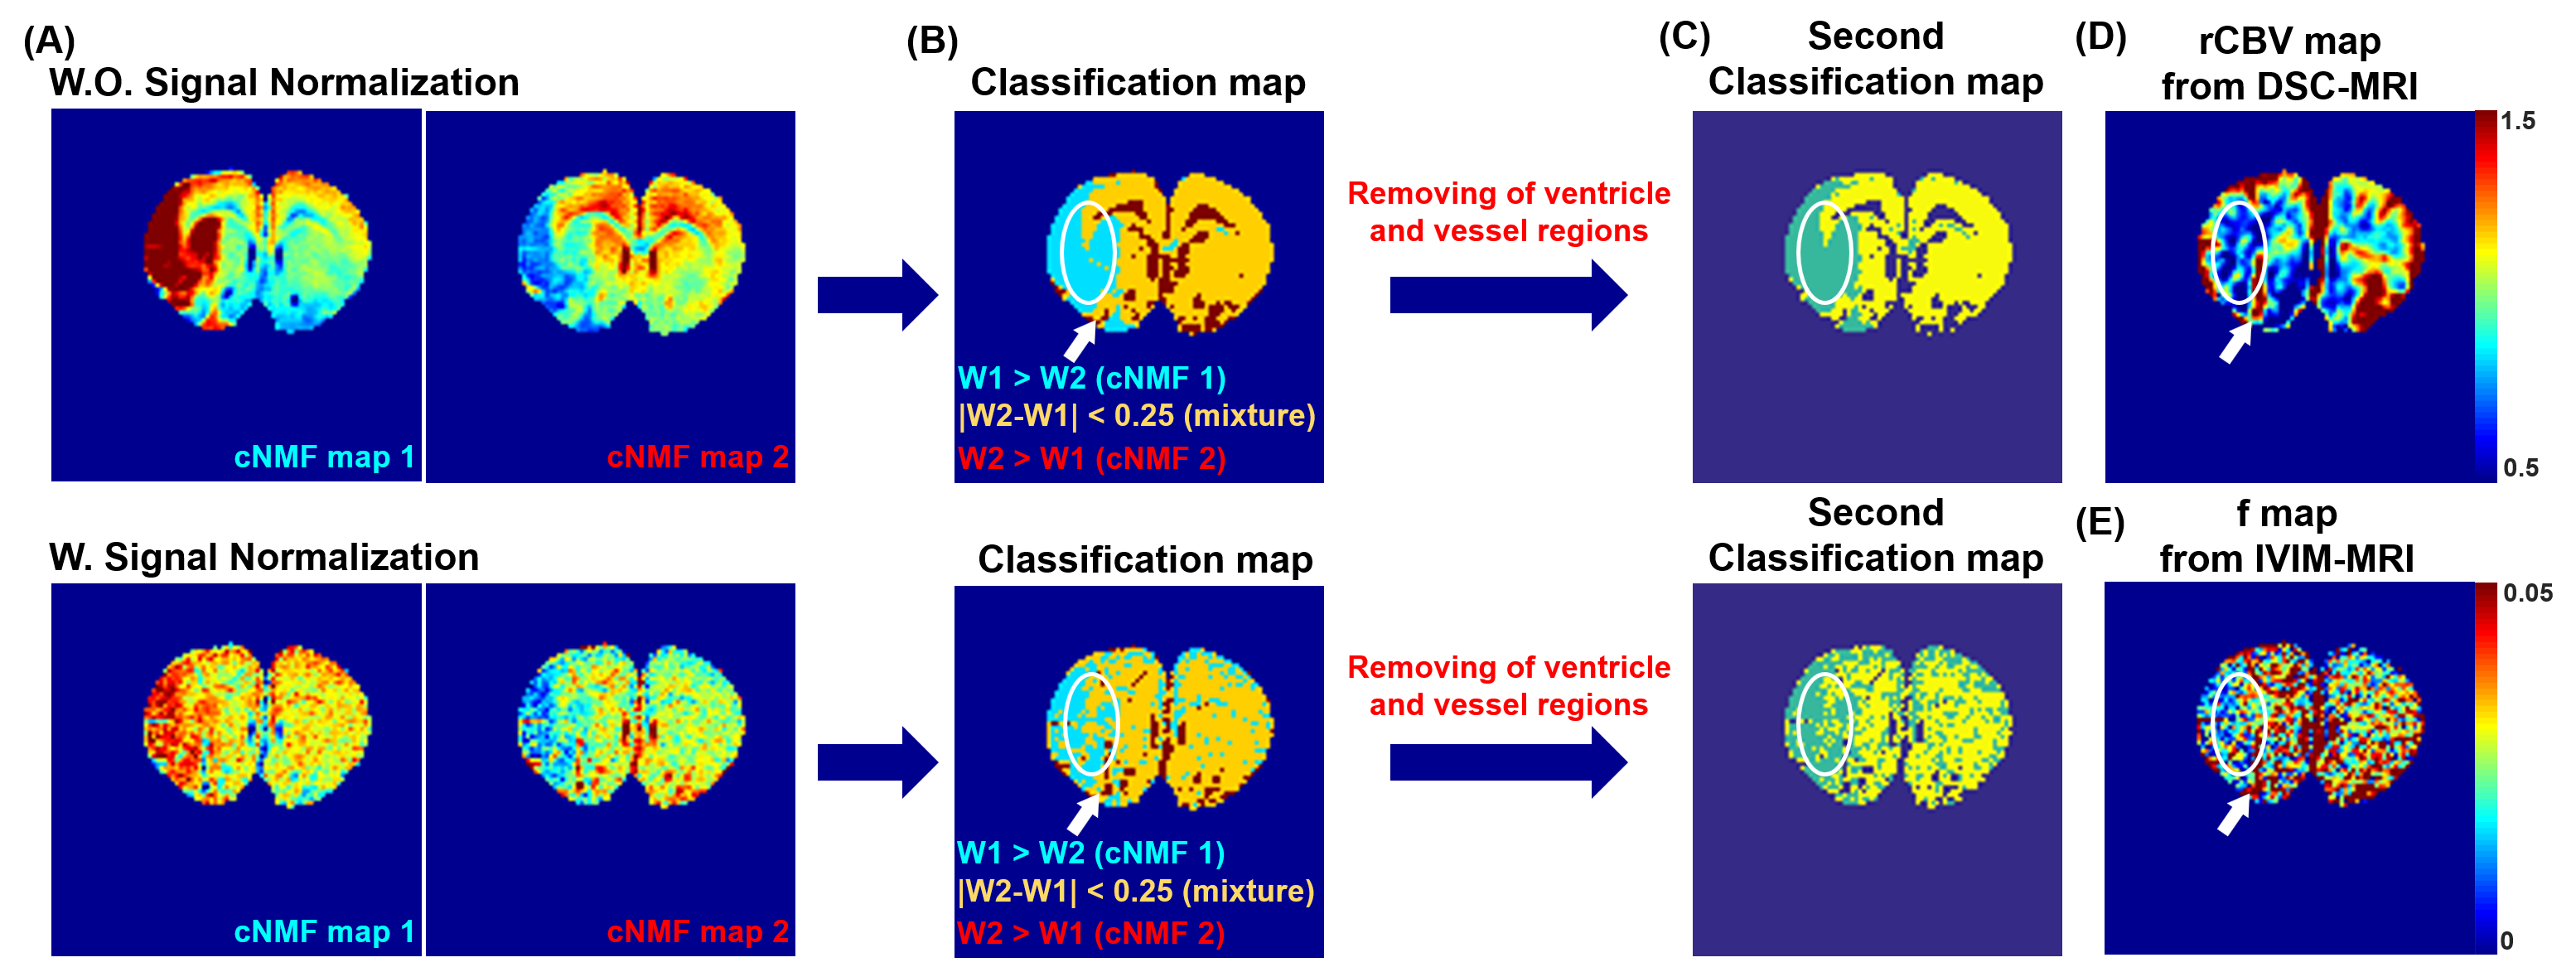
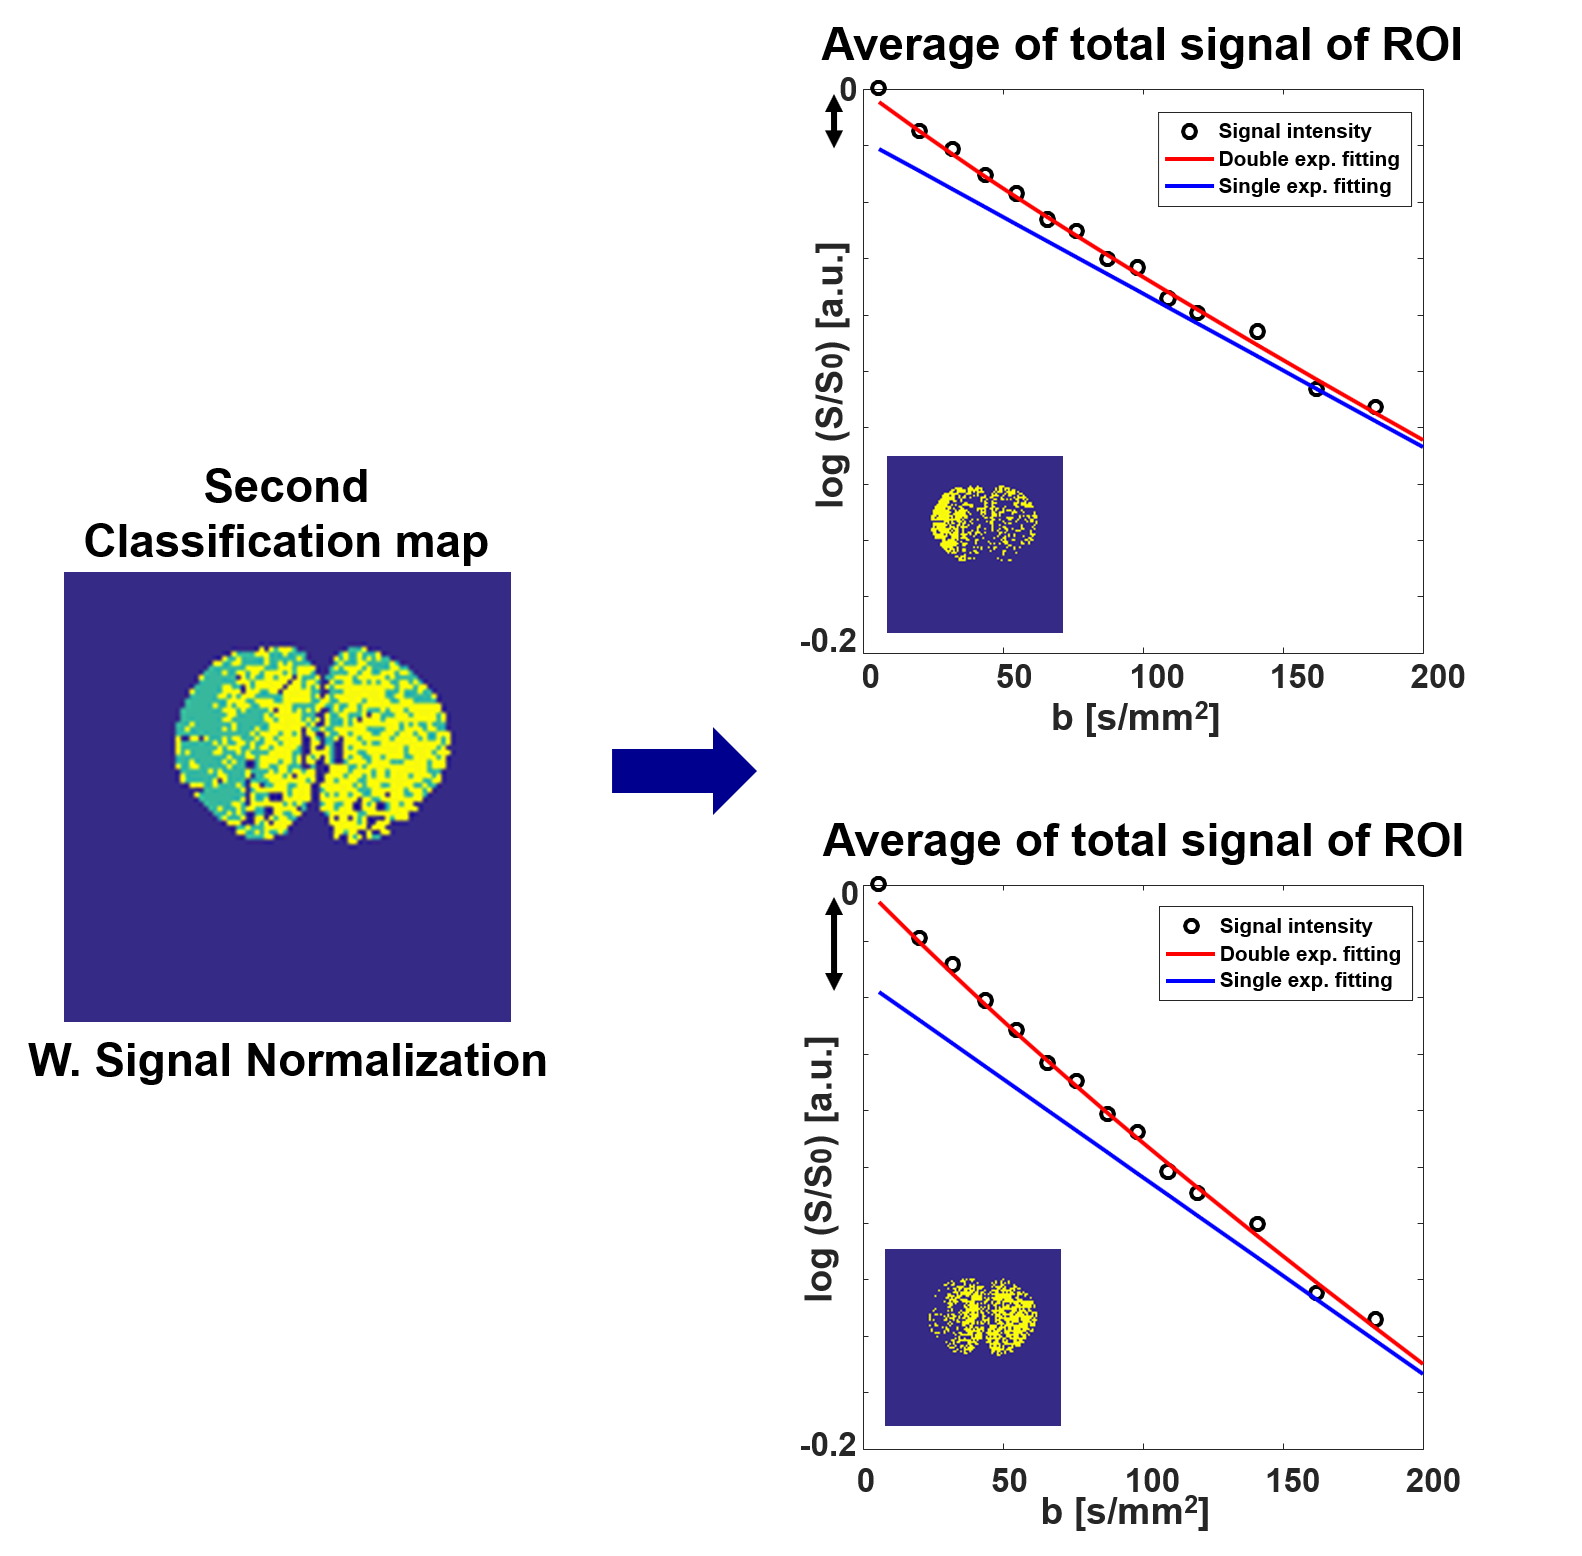
The classification maps derived from each cNMF weighting maps are shown in Figure 3-(B) with raw and normalized IVIM-diffusion, respectively. The second classification map was obtained by removing apparent vessel regions from the first classification map and re-running cNMF. As shown in white circles, the classified (green) region from normalized IVIM-diffusion data agreed well with hypo-perfusion regions from DSC-MRI data, whereas the classified (green) region from un-normalized IVIM-diffusion data agreed well with lowered D value region. Figure 4 shows the reduced double-exponential behavior of cNMF classified hypo-perfusion area.
Conclusions and Discussions
It is observed that the cNMF maps with raw IVIM data were dominantly determined from diffusion factor (reduced and normal diffusions), and cNMF maps with normalized IVIM data were mostly determined by perfusion factor (single versus double exponential). As no model or thresholdings are necessary for cNMF application for IVIM-diffusion, the automatic separation of infarct, penumbra, and normal regions may be feasible with future works with increased sample sizes and further optimizations. In conclusion, the present work validates the cNMF implementation to IVIM-diffusion for automatic pattern recognition analysis of both diffusivity and perfusivity.Acknowledgements
No acknowledgement found.References
1. Keil, V. C., Mädler, B., Gielen, G. H., Pintea, B., Hiththetiya, K., Gaspranova, A. R., ... & Hadizadeh, D. R. (2017). Intravoxel incoherent motion MRI in the brain: Impact of the fitting model on perfusion fraction and lesion differentiability. Journal of Magnetic Resonance Imaging.
2. Suo, S., Lin, N., Wang, H., Zhang, L., Wang, R., Zhang, S., ... & Xu, J. (2015). Intravoxel incoherent motion diffusion‐weighted MR imaging of breast cancer at 3.0 tesla: Comparison of different curve‐fitting methods. Journal of Magnetic Resonance Imaging, 42(2), 362-370.
3. Barbieri, S., Donati, O. F., Froehlich, J. M., & Thoeny, H. C. (2016). Impact of the calculation algorithm on biexponential fitting of diffusion‐weighted MRI in upper abdominal organs. Magnetic resonance in medicine, 75(5), 2175-2184.
4. Le Bihan, D., Breton, E., Lallemand, D., Aubin, M. L., Vignaud, J., & Laval-Jeantet, M. (1988). Separation of diffusion and perfusion in intravoxel incoherent motion MR imaging. Radiology, 168(2), 497-505.
5. Han, S., Stoyanova, R., Lee, H., Carlin, S. D., Koutcher, J. A., Cho, H., & Ackerstaff, E. (2017). Automation of pattern recognition analysis of dynamic contrast‐enhanced MRI data to characterize intratumoral vascular heterogeneity. Magnetic Resonance in Medicine.
6. Koh, D. M., Collins, D. J., & Orton, M. R. (2011). Intravoxel incoherent motion in body diffusion-weighted MRI: reality and challenges. American Journal of Roentgenology, 196(6), 1351-1361.
Figures