5337
Model-Based Iterative Reconstruction for in vivo Diffusion Quantification1Internal Medicine II, University Ulm Medical Center, Ulm, Germany, 2Radiology, University Ulm Medical Center, Ulm, Germany
Synopsis
A model-based iterative reconstruction of the apparent diffusion coefficient (ADC) is introduced enabling the quantification of diffusion properties from undersampled DWI data of human knee joints. The approach uses an underlying model function to synthesize k-space data containing crucial phase information. A NLCG is implemented for ADC reconstruction comparing synthetic and measured k-space data. In vivo data of nine subjects show up to 3.5-fold acceleration of the DWI sequence without losing substantial accuracy of the ADC estimates.
Purpose
Recently, diffusion-weighted imaging (DWI) has been applied to assess synovial inflammation in the pathogenesis of arthritic joint destruction1. Especially for pediatric patients, DWI represents a non-invasive alternative to contrast agent enhanced T1-weighted sequences, commonly used for imaging of synovitis in knee joints.
A major limitation of DWI in pediatric examinations results from the related rather long scan durations for ensuring sufficient contrast and spatial resolution. In this contribution, a model-based iterative reconstruction of the apparent diffusion coefficient (ADC) is introduced enabling the quantification of diffusion properties from undersampled DWI data of human knee joints.
Methods
DW images show an exponential decay of its signal intensity S(b) depending on the diffusion-weighting factor b
$$ S(b) = S_0 \cdot \exp\left(-b\cdot D_A\right) \qquad \qquad(1)$$
Changes on the tissue-specific apparent diffusion coefficient DA indicate multiple pathological aberrations of the investigated tissue. In clinical routine the diffusion map DA is calculate from multiple DW images by pixel-wise fitting of equation (1) in image space. However, using undersampled data often causes inaccurate estimates of the ADC due to residual artifacts and increasing noise level in the independently reconstructed images.
In contrast to independently reconstructing images prior to ADC estimation, the proposed approach uses a model-based iterative reconstruction considering all acquired data in each step of ADC reconstruction. Based on (1), the approach uses an l2-norm to compare synthetic with measured k-space data k and delivers two parameter maps S0 and DA from the undersampled data. A non-linear conjugate gradient algorithm (NLCG) with n=1000 iteration steps is used to minimize the cost function (2).
$$ \Phi(x) = \frac{1}{2}\cdot \sum_b \sum_c || P \cdot C_c \cdot \textrm{DFT}\cdot S(b) - k ||_2^2\qquad \textrm{with}\qquad x = (S_0,D_A)\qquad\qquad (2) $$
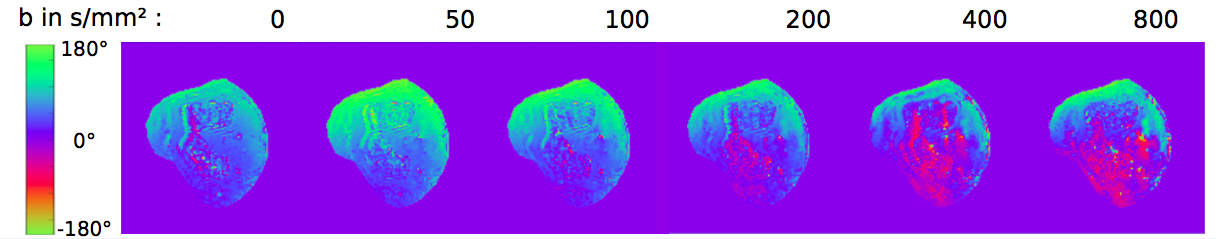
Depending on the b-value, DW images often show phase modulations, most likely due to residual eddy current effects, originating from the strong diffusion gradients required in DWI (Fig.1). For the proposed approach, knowledge of the respective phase is crucial for reconstruction and a phase correcting operator P containing the phase information of each images is included in (2) as well as the coil sensivity profiles Cc.
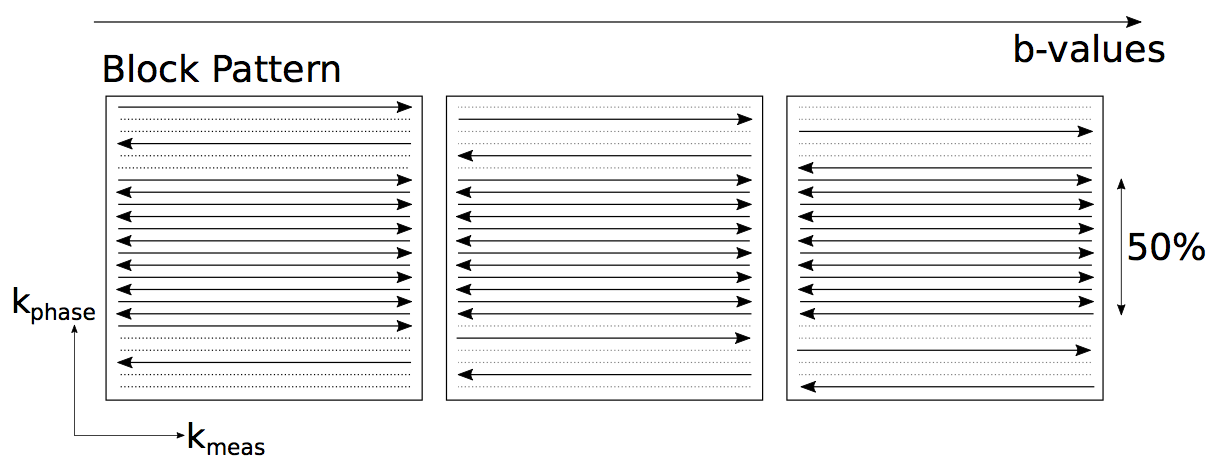
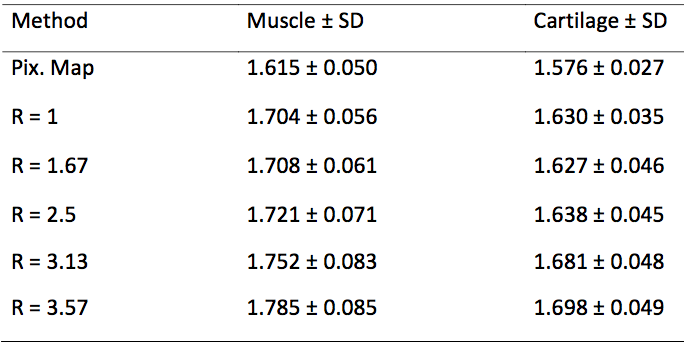
Fully sampled EPI DW images from nine subjects were included in this study. Scan parameters were as FOV: 180 x 180 x 24 mm; Δr: 1.3 x 1.3 x 5 mm; b-values: 0, 50, 100, 200, 400, 800 s/mm2; EPI factor: 11; TE = 70 ms; TR = 4000ms. All data were acquired with an 8-channel knee coil. Undersampling was simulated by multiplying full k-space data with a block pattern (Fig. 2). Four undersampling factors R (1.67, 2.5, 3.13, 3.57) were investigated in this study. The suggested pattern offers the ability to extract the required phase information directly from low-resolution images reconstructed form the k-space center data. The ADC of the retropatellar cartilage and of the gastrocnemius muscle were analyzed for the investigated undersampling factors.
Results
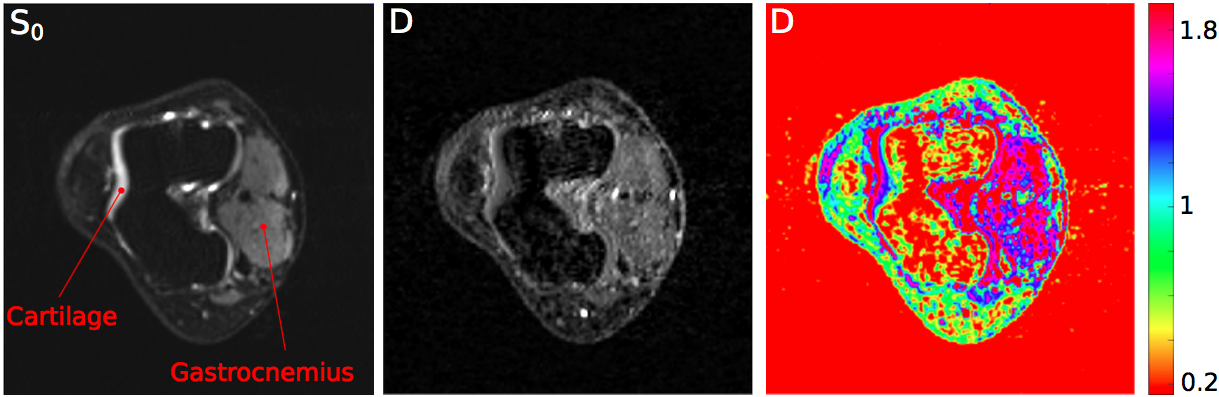
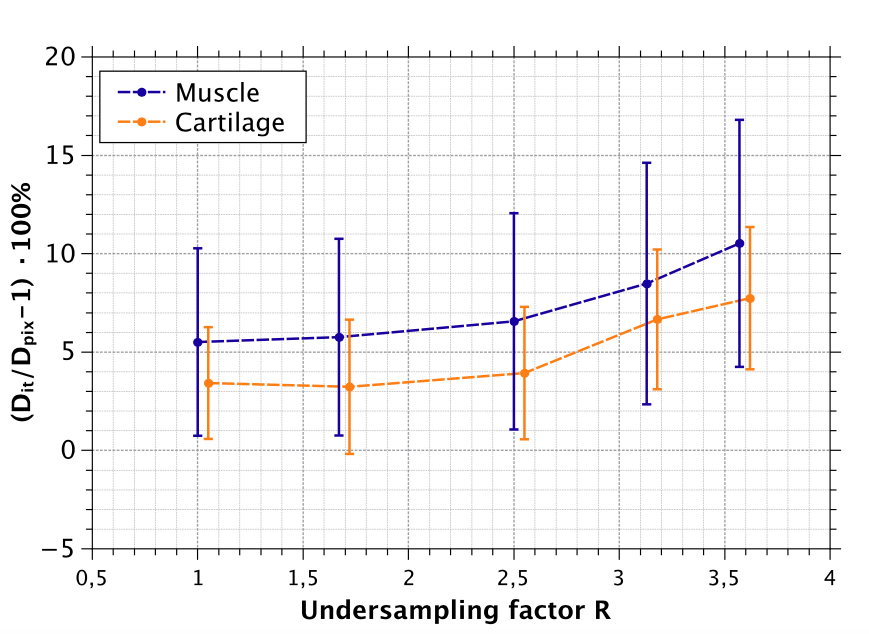
S0 and DA are shown exemplarily for one data set in Fig. 3. Resulting ADC values for the investigated undersampling factors R are shown in Table 1, showing an error less than 11 % (Fig. 4) even for R=3.57 in direct comparison to the pixel-wise fit obtained from the fully-sampled data.Discussion
The suggested model-based iterative reconstruction approach enabled up to 3.5-fold acceleration of the DWI sequence without losing substantial accuracy of the ADC estimates. However, the accuracy of the iterative reconstruction shown in Fig. 4 decreases with increasing undersampling factor. This behavior results from narrowing k-space center with increasing R due to the used block pattern. This results in a lower spatially resolved phase information term likely causing inaccuracies in the phase estimates , thus limiting the maximal possible undersampling factor R.Conclusion
Model-based iterative reconstruction can be used to accurately quantify the ADC from undersampled DW data of the human knee joints, thus showing a huge potential to reduce scan duration of DWI. Further improvements may be achieved adjustment of the underlying model (1) e.g. by consideration of the perfusion component according to IVIM theory1.Acknowledgements
No acknowledgement found.References
1. Hilbert F, Holl-Wieden A, Sauer A, Koestler H, Neubauer H. Intravoxel incoherent motion resonance imaging of the knee joint in childern with juvenile idiopathic arthritis. Pediatric Radiology. 2017;47(6):681-690.
2. Sumpf T, Uecker M, Boretius S, Frahm J. Model-Based Nonlinear Inverse Reconstruction for T2 Mapping Using Highly Undersampled Spin-Echo MRI. Journal of Magnetic Resonance Imaging. 2011;34:420-428.
Figures