5329
Flow-compensated IVIM model: accuracy and precision as function of SNR, b-values and perfusion fraction1Institute of Radiology, University Hospital Erlangen, Erlangen, Germany, 2Joint Department of Physics, The Institute of Cancer Research and The Royal Marsden NHS Foundation Trust, London, United Kingdom
Synopsis
To use intravoxel incoherent motion (IVIM) modelling for clinical applications, the model parameters need to be determined accurately and precisely, which was found challenging. We studied the influence of signal-to-noise ratio (SNR), number of b-values and perfusion fraction on the accuracy of the recently introduced flow-compensated IVIM model parameters (tissue diffusivity, perfusion fraction, characteristic timescale and blood flow velocity). Simulations were performed for typical parameters obtained in healthy volunteers for pancreas and kidney and revealed that for an SNR of 20, 9 b-values and a perfusion fraction of more than 15% are needed for reliable parameter estimation in flow-compensated IVIM.
Introduction
Although the intravoxel incoherent motion (IVIM) model1 in diffusion-weighted (DW) MRI has found many applications and is, among others, interesting for oncologic imaging2, its accuracy and reproducibility are topic of ongoing research3,4. Recently, flow-compensated IVIM has been proposed to unveil characteristic properties of the vascular network5. However, this approach requires additional measurements with multiple diffusion times and b-values, resulting in long acquisitions. In this work we investigate the influence of signal-to-noise ratio (SNR), perfusion fraction and used b-values on accuracy and precision of the flow-compensated IVIM model.Methods
In the IVIM model, the DW signal attenuation S/S0 is a function of tissue diffusivity D, perfusion fraction f, characteristic timescale τ and blood flow velocity v of the vascular network1,5: $$\frac{S}{S_0} = (1-f)exp(-bD) + f \cdot F(b,T,τ,v)\cdot exp(-bD_b).$$
While in classic IVIM modelling the perfusion-based attenuation F(b,T,τ,v) and self-diffusion (modelled here by Db= 1.6 µm2/ms) of blood are approximated by exp(-bD*), in flow-compensated IVIM F(b,T,τ,v) is calculated using normalized phase distributions5, taking diffusion gradient scheme and diffusion time T (defined in Fig. 1) into account.
We acquired abdominal DW MRI from three volunteers (each scanned twice) at 1.5T (Magnetom Avanto, Siemens Healthcare, Germany) using an in-house developed single-shot echo planar imaging sequence5, which was respiratory triggered to exhalation.
The same protocol was used for volunteer experiments and simulations. It consisted of four series with constant T and varying b-values and three series with constant b-value and varying T, illustrated in Fig. 1.
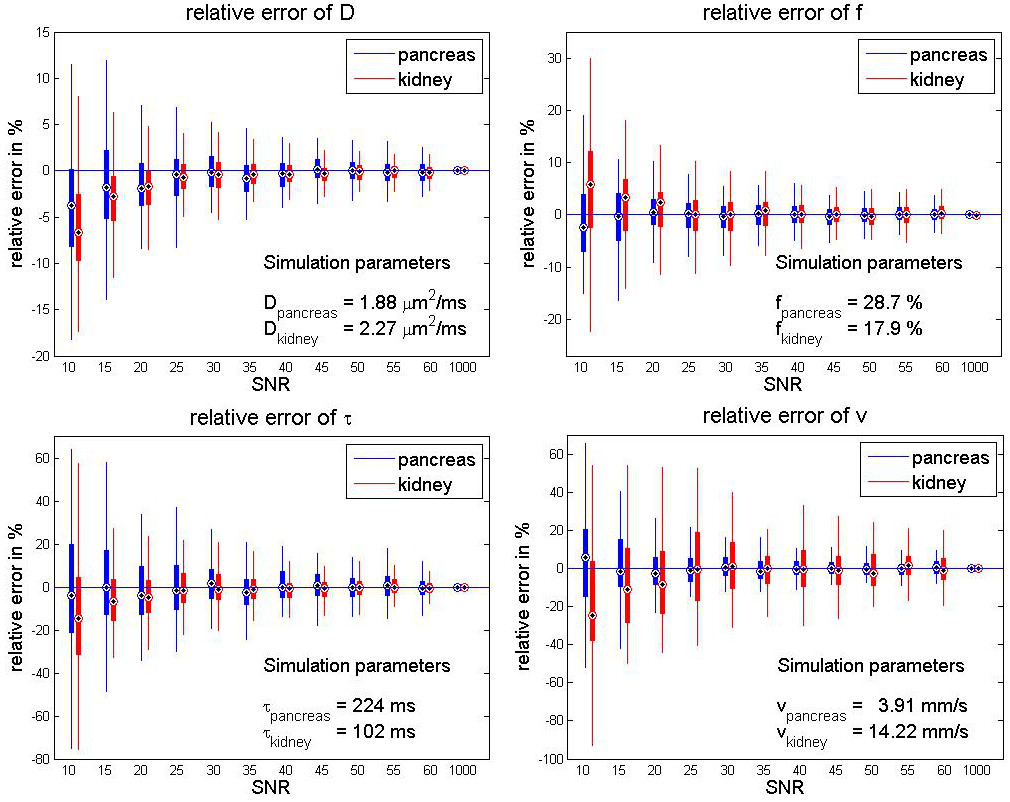
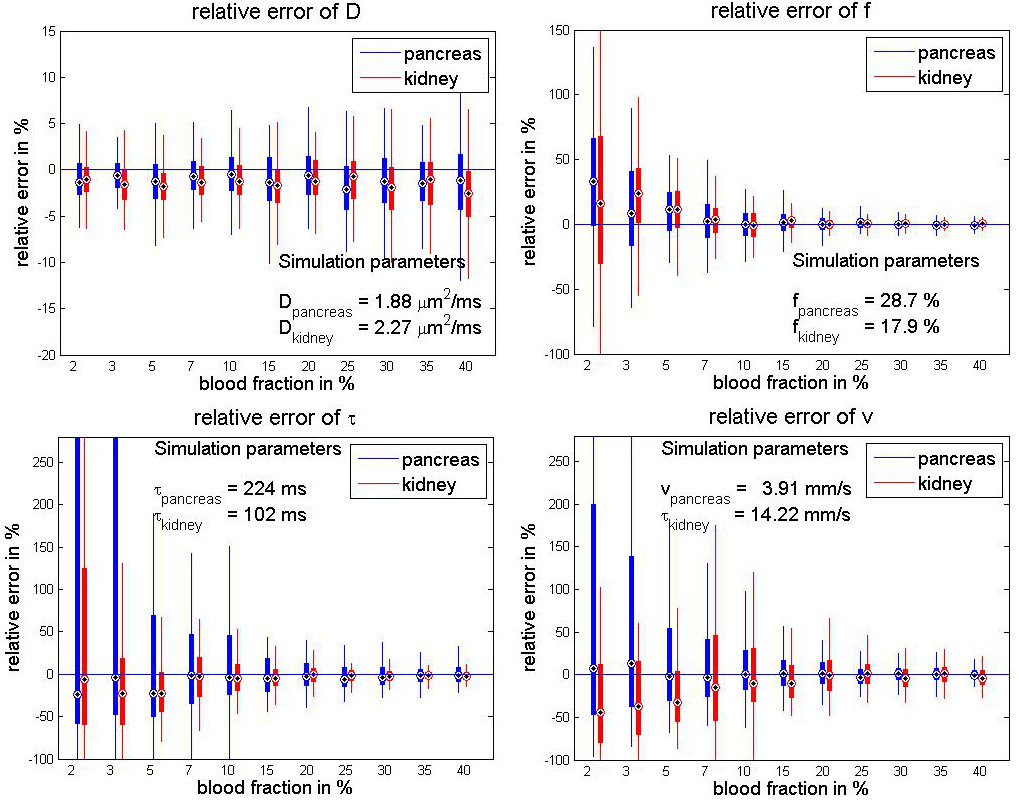
In the simulations we examined the influence of Rician noise (SNR 10-60 at b=0), employed b-values (4-18 b-values in range 0-600 s/mm2) and the perfusion fraction (2-40%). Each simulation was repeated 100 times and boxplots of the distribution of the relative error of the parameter estimates were generated in MATLAB (The MathWorks, Inc., Natick). The median of the box-plots is a measure of accuracy, the range is a measure of precision. Ground-truth values for the pancreas simulations were taken from literature5 and values of the kidney were obtained from the volunteer data.
Results
Results of a typical volunteer measurement are shown in Fig. 2, which displays the measured signal attenuation and a fit of the flow-compensated IVIM model. The signal dependence on T was not well-resolved, which is crucial to determine τ and v accurately.
In the SNR simulations (Fig. 3) an increased random error was found at lower SNR for both pancreas and kidney data. For SNR ≥ 20 the inter-quartile range was below 20% for all parameters.
Figure 4 shows the dependency on the number of used b-values (SNR = 20). Using less than 7 b-values led to systematic errors (underestimation of D, overestimation of f). Starting with 9 b-values, the relative errors for D and f stayed below 10%, adding more b-values did not yield further gain in accuracy or precision for any of the model parameters.
The accuracy of the tissue diffusivity D was unaffected by the blood fraction, which can be seen in Figure 5 (top left). The other three parameters were strongly dependent on f: for very low perfusion fractions (f<5%), τ and v could not be determined precisely. Acceptable accuracy and precision were only found for f ≥ 15%.
Discussion
The work at hand was inspired by the challenges of applying the flow-compensated IVIM model to in-vivo data. The simulations revealed, that for an SNR of 20, 9 b-values and a perfusion fraction of f ≥ 15% are required to enable estimation of the parameters τ and v. For the used protocol, this corresponds to reducing the acquisition time by 50%. D and f could be measured accurately already from 7 b-values, which is in accordance with literature4,6.
To overcome the limitations of long breath holds, which were used in previous work5, a respiratory-triggered acquisition was used. Despite the fact that our experimental data fulfilled the requirements determined by the simulations, signal variations were still obscuring the dependence of the flow-compensated diffusion signal on T, which is needed to determine τ and v.
Registration of the diffusion-weighted images would be one possibility to reduce the observed variance. While adding to the complexity of the acquisition, respiratory and cardiac gating might be necessary for reliable flow-compensated IVIM, since a signal dependency on the cardiac cycle has been previously reported for classic IVIM7.
Conclusion
Our simulations revealed that for precise and accurate results in assessing characteristic timescale and blood flow velocity of the microvasculature with flow-compensated IVIM, 9 b-values and a perfusion fraction of ≥15 % are required for an SNR of 20.Acknowledgements
We acknowledge NHS founding to the NIHR Biomedical Research Centre and the Clinical Research Facility at The Institute of Cancer Research and The Royal Marsden NHS Foundation Trust and the CR UK Cancer Imaging Centre grant C1060/A16464. We acknowledge funding from CR UK programme grants C33589/A19727 and C7224/A23275. Funding by the DFG grant LA 2804/6-1 is gratefully acknowledged.
References
1. Le Bihan, D., Breton, E., Lallemand, D., Aubin, M., Vignaud, J., & Laval-Jeantet, M. (1988). Separation of Diffusion and Perfusion in Intravoxel Incoherent Motion MR Imaging. Radiology, 168(2):497-505.
2. Klauss, M., Mayer, P., Maier-Hein, K., Laun, F., Mehrabi, A., Kauczor, H., et al. (2016). IVIM-diffusion-MRI for the differentiation of solid benign and malign hypervascular liver lesion-Evaluation with two different MR scanners. European journal of radiology, 85(7):1289-94.
3. Pan, J., Zhang, H., Man, F., Shen, Y., Wang, Y., Zhong, Y., et al. (2017). Measurement and scan reproducibility of parameters of intravoxel incoherent motion in renal tumor and normal renal parenchyma: a preliminary research at 3.0 T MR. Abdominal Radiology, https://doi.org/10.1007/s00261-017-1361-7.
4. Gurney-Champion, O., Froeling, M., Klaassen, R., Runge, J., Bel, A., van Laarhoven, H., et al. (2016). Minimizing the Acquisition Time for Intravoxel Incoherent Motion Magnetic Resonance Imaging Acquisitions in the Liver and Pancreas. Investigative radiology, 51(4):211-20.
5. Wetscherek, A., Stieltjes, B., & Laun, F. (2015). Flow-Compensated Intravoxel Incoherent Motion Diffusion Imaging. Magnetic Resonance in Medicine, 74(2):410-9.
6. Lemke, A., Laun, F., Klauss, M., Re, T., Simon, D., Delorme, S., et al. (2009). Differentiation of pancreas carcinoma from healthy pancreatic tissue using multiple b-values: comparison of apparent diffusion coefficient and intravoxel incoherent motion derived parameters. Investigative radiology, 44(12):769-75.
7. Federau, C., Hagmann, P.,
Maeder, P., Mueller, M., Meuli, R., Stuber, M., et al. (2013). Dependence
of brain intravoxel incoherent motion perfusion parameters on the cardiac cycle.
PloS One, 8(8):e72856.
Figures
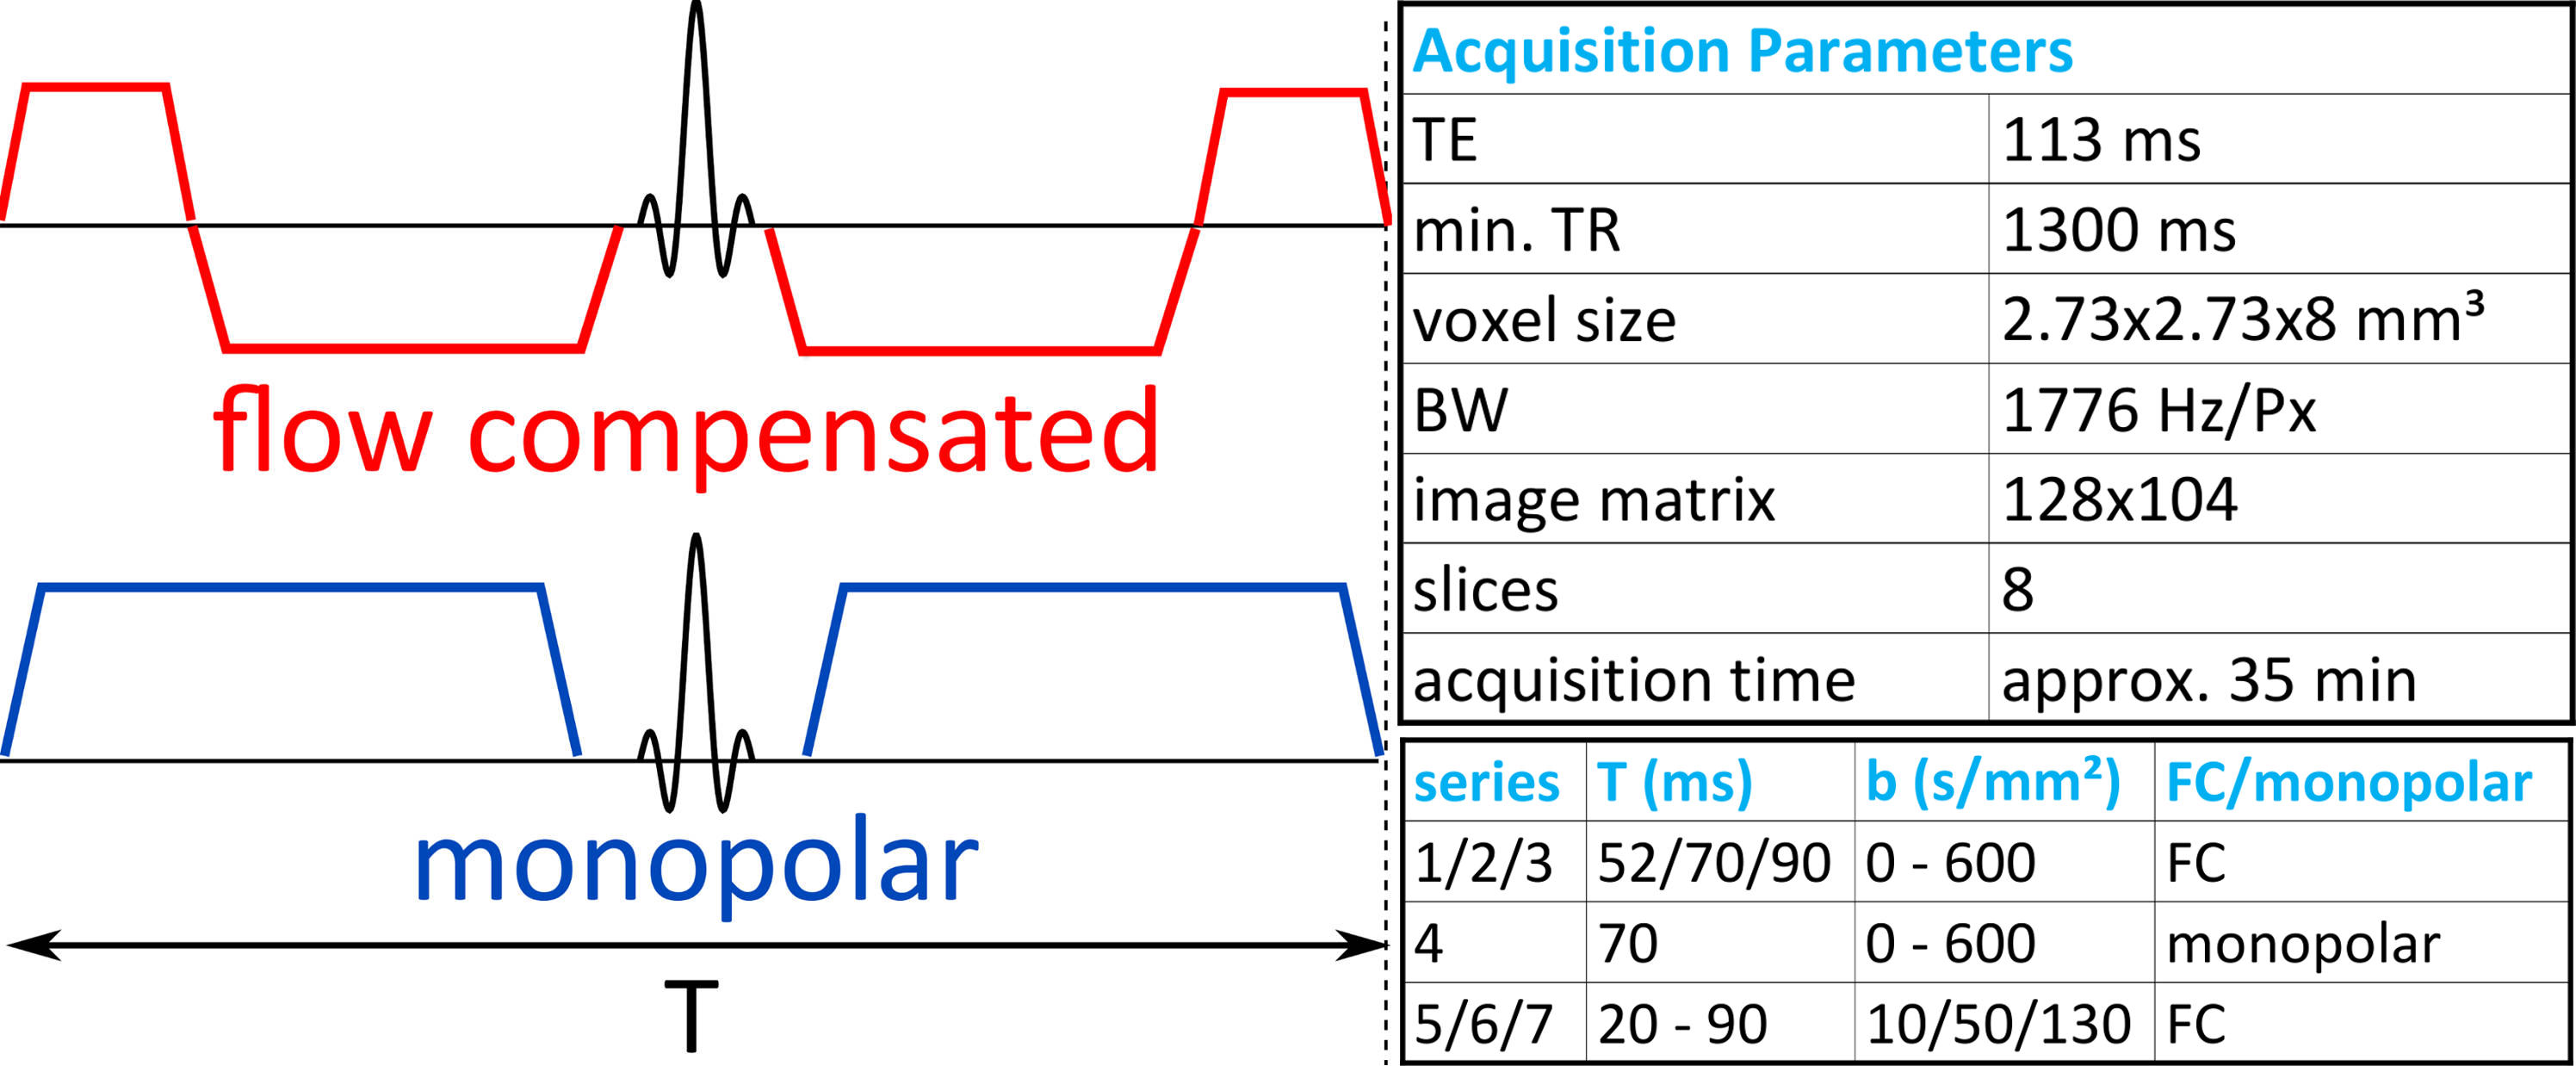
Figure 1: Diffusion schemes used in this study (left) and acquisition parameters (right). Diffusion schemes: flow-compensated (top) and monopolar (bottom). Gradients were placed symmetrically around the refocusing pulse to mitigate concomitant field artifacts. The diffusion time T was defined as the duration of the diffusion block and can be adjusted independently of the echo time. Acquisition parameter and series used in this work: One series was monopolar (constant T, varying b-values), the others flow-compensated (FC). For diffusion times T=52/70 ms the maximum b-value was 250/450 s/mm2. The repetition time varied with respiratory cycle, but was at least 1300 ms.