5325
Comparison of Different Methods for Motion-induced Data Corruption Detection Using k-space Information in Diffusion Imaging1Tiantan Image Research Center, China National Clinical Research Center for Neurological Diseases, Beijing, China, 2Center for Biomedical Imaging Research, Department of Biomedical Engineering, School of Medicine, Tsinghua University, Beijing, China, 3Department of Radiology, Beijing Tiantan Hospital, Capital Medical University, Beijing, China, 4Department of Neurology, Beijing Tiantan Hospital, Capital Medical University, Beijing, China, 5China National Clinical Research Center for Neurological Diseases, Beijing, China, 6Department of Radiology, University of Washington, Seattle, WA, United States
Synopsis
In diffusion imaging, subject motion together with diffusion encoding gradient may introduce data corruption. Several methods for corrupted data detection using k-space information such as DC peak amplitude, entropy and signal distribution metric have been proposed, and the detection directly from acquired k-space enables instant data rejection and re-acquisition. This work compared and evaluated these methods using the same single-shot data set. The results show that all methods can successfully detect corrupted shots, and demonstrate good detection consistency with each other and also with ADC measurement.
Introduction
In diffusion imaging, bulk and physiological motion together with diffusion encoding gradients can introduce extra image phase and data corruption in the diffusion-weighted images. The data corruption causes signal voids and can be difficult to recover using post-processing reconstruction methods1. Besides using cardiac gated acquisition, several methods for corrupted data detection using k-space information have been reported. These methods explore the k-space signal properties like DC peak amplitude2,3, entropy4 and signal distribution5,6 to evaluate corruption level, and detection directly from acquired k-space enables instant data rejection and re-acquisition5. In this work, we briefly reviewed these methods and evaluated them using the same single-shot data set.
Theory
Under diffusion encoding gradients, motion will introduce complicated phase errors, and the fast-changing phase errors in the slice direction can result in signal voids from intra-voxel dephasing. The lowered signal level can be detected from k-space DC peak amplitude. The fast-changing phase can be reflected from dispersed k-space signal distribution using k-space entropy and distribution metric. This section will briefly review these methods.
k-space DC Peak Amplitude The maximum modulus value of the k-space data is used as DC peak amplitude metric2,3. The shot data with DC peak amplitude below certain threshold will be regarded as corrupted. The metric is calculated as $$$DC=\sum_{ch}max_{x,y}(|k_{x,y,ch}|)$$$, where x,y and ch are the k-space coordinate and channel index respectively.
k-space Entropy The entropy of the normalized k-space signal level is calculated as k-space entropy metric4. The shot data with k-space entropy above certain threshold will be regarded as corrupted. The metric is calculated as $$$Entropy=-\sum_{ch}\sum_{x,y}\frac{\overline{k_{x,y,ch}}}{log(\overline{k_{x,y,ch}})},\overline{k_{x,y,ch}}=|k_{x,y,ch}/(max_{x,y}(|k_{x,y,ch}|))|$$$, where $$$\overline{k_{x,y,ch}}$$$ is the k-space signal normalized by the maximum k-space intensity in each channel.
k-space Signal Distribution The nth moment of the 2D k-space signal can reflect the broadening of the signal dispersion5,6. The shot with k-space signal distribution above certain threshold will be regarded as corrupted. The signal distribution is calculated as $$$SD=\sum_{ch}\sum_{x,y}|k_{x,y,ch} | |\vec{r_{x,y}}|^n$$$ , where $$$|\vec{r_{x,y}}|$$$ is the distance from the k-space signal peak to coordinate x,y. In this work, we used n=4 and a k-space range of 33×33 for the moment calculation6.
Methods
To compare different data corruption detection methods, a single-shot diffusion EPI data set was acquired on a healthy volunteer on a 3T scanner with a 32-channel head coil. The scan was repeated 80 times using diffusion directions along superior/inferior direction with b=0, 1000, 2000s/mm2. FOV=230×230mm2, matrix=64×63, TE/TR=97/2000ms, and acquisition time was 7min36s for 16 slices. The k-space DC peak amplitude, entropy and signal distribution were calculated as mentioned in the previous section for each repetition, b-value and slice. The mean value of ADC was also measured in whole brain area using two b values, to reflect the erroneous ADC increase. The threshold for data corruption detection was set4 as E-1.5σ for DC amplitude peak, and E+1.5σ for entropy, signal distribution and mean ADC, where E and σ are mean and standard deviation for all 80 repetitions of the same slice and b-value. Similarity index (SI) with ADC metric was calculated as SI = 2×(number of corrupted shots in the intersection of k-space metric and ADC metric) / (number of corrupted shots using k-space metric +number of corrupted shots using ADC metric). Coefficient of variance of different metrics were also calculated by CV=σ/E.Results
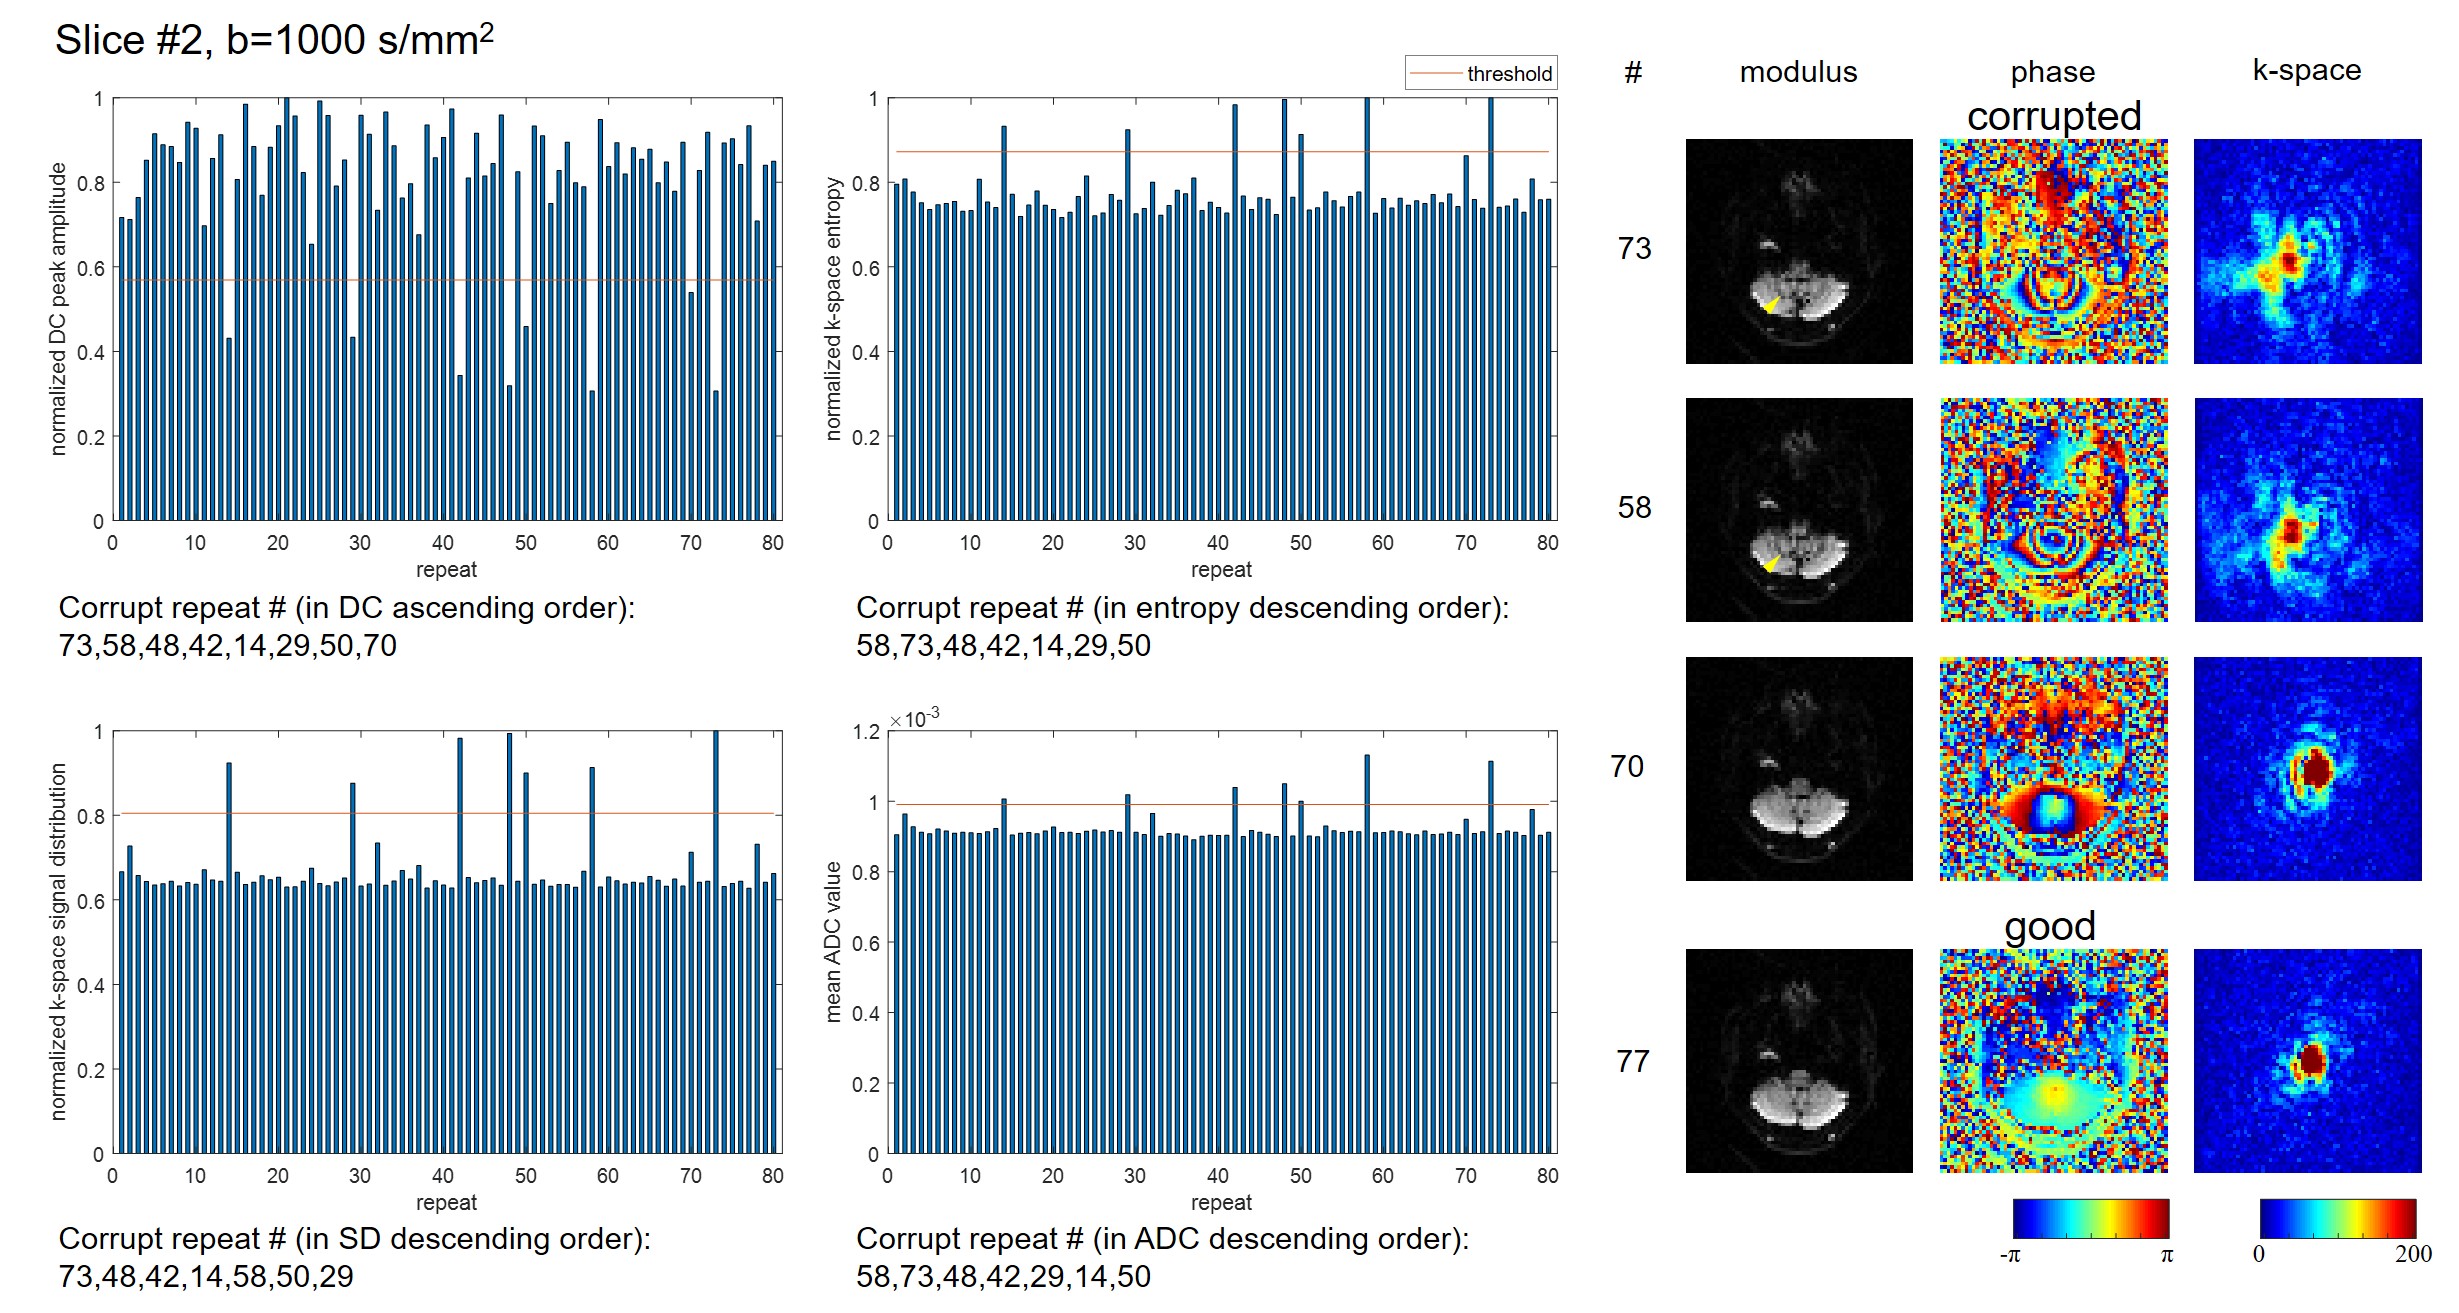
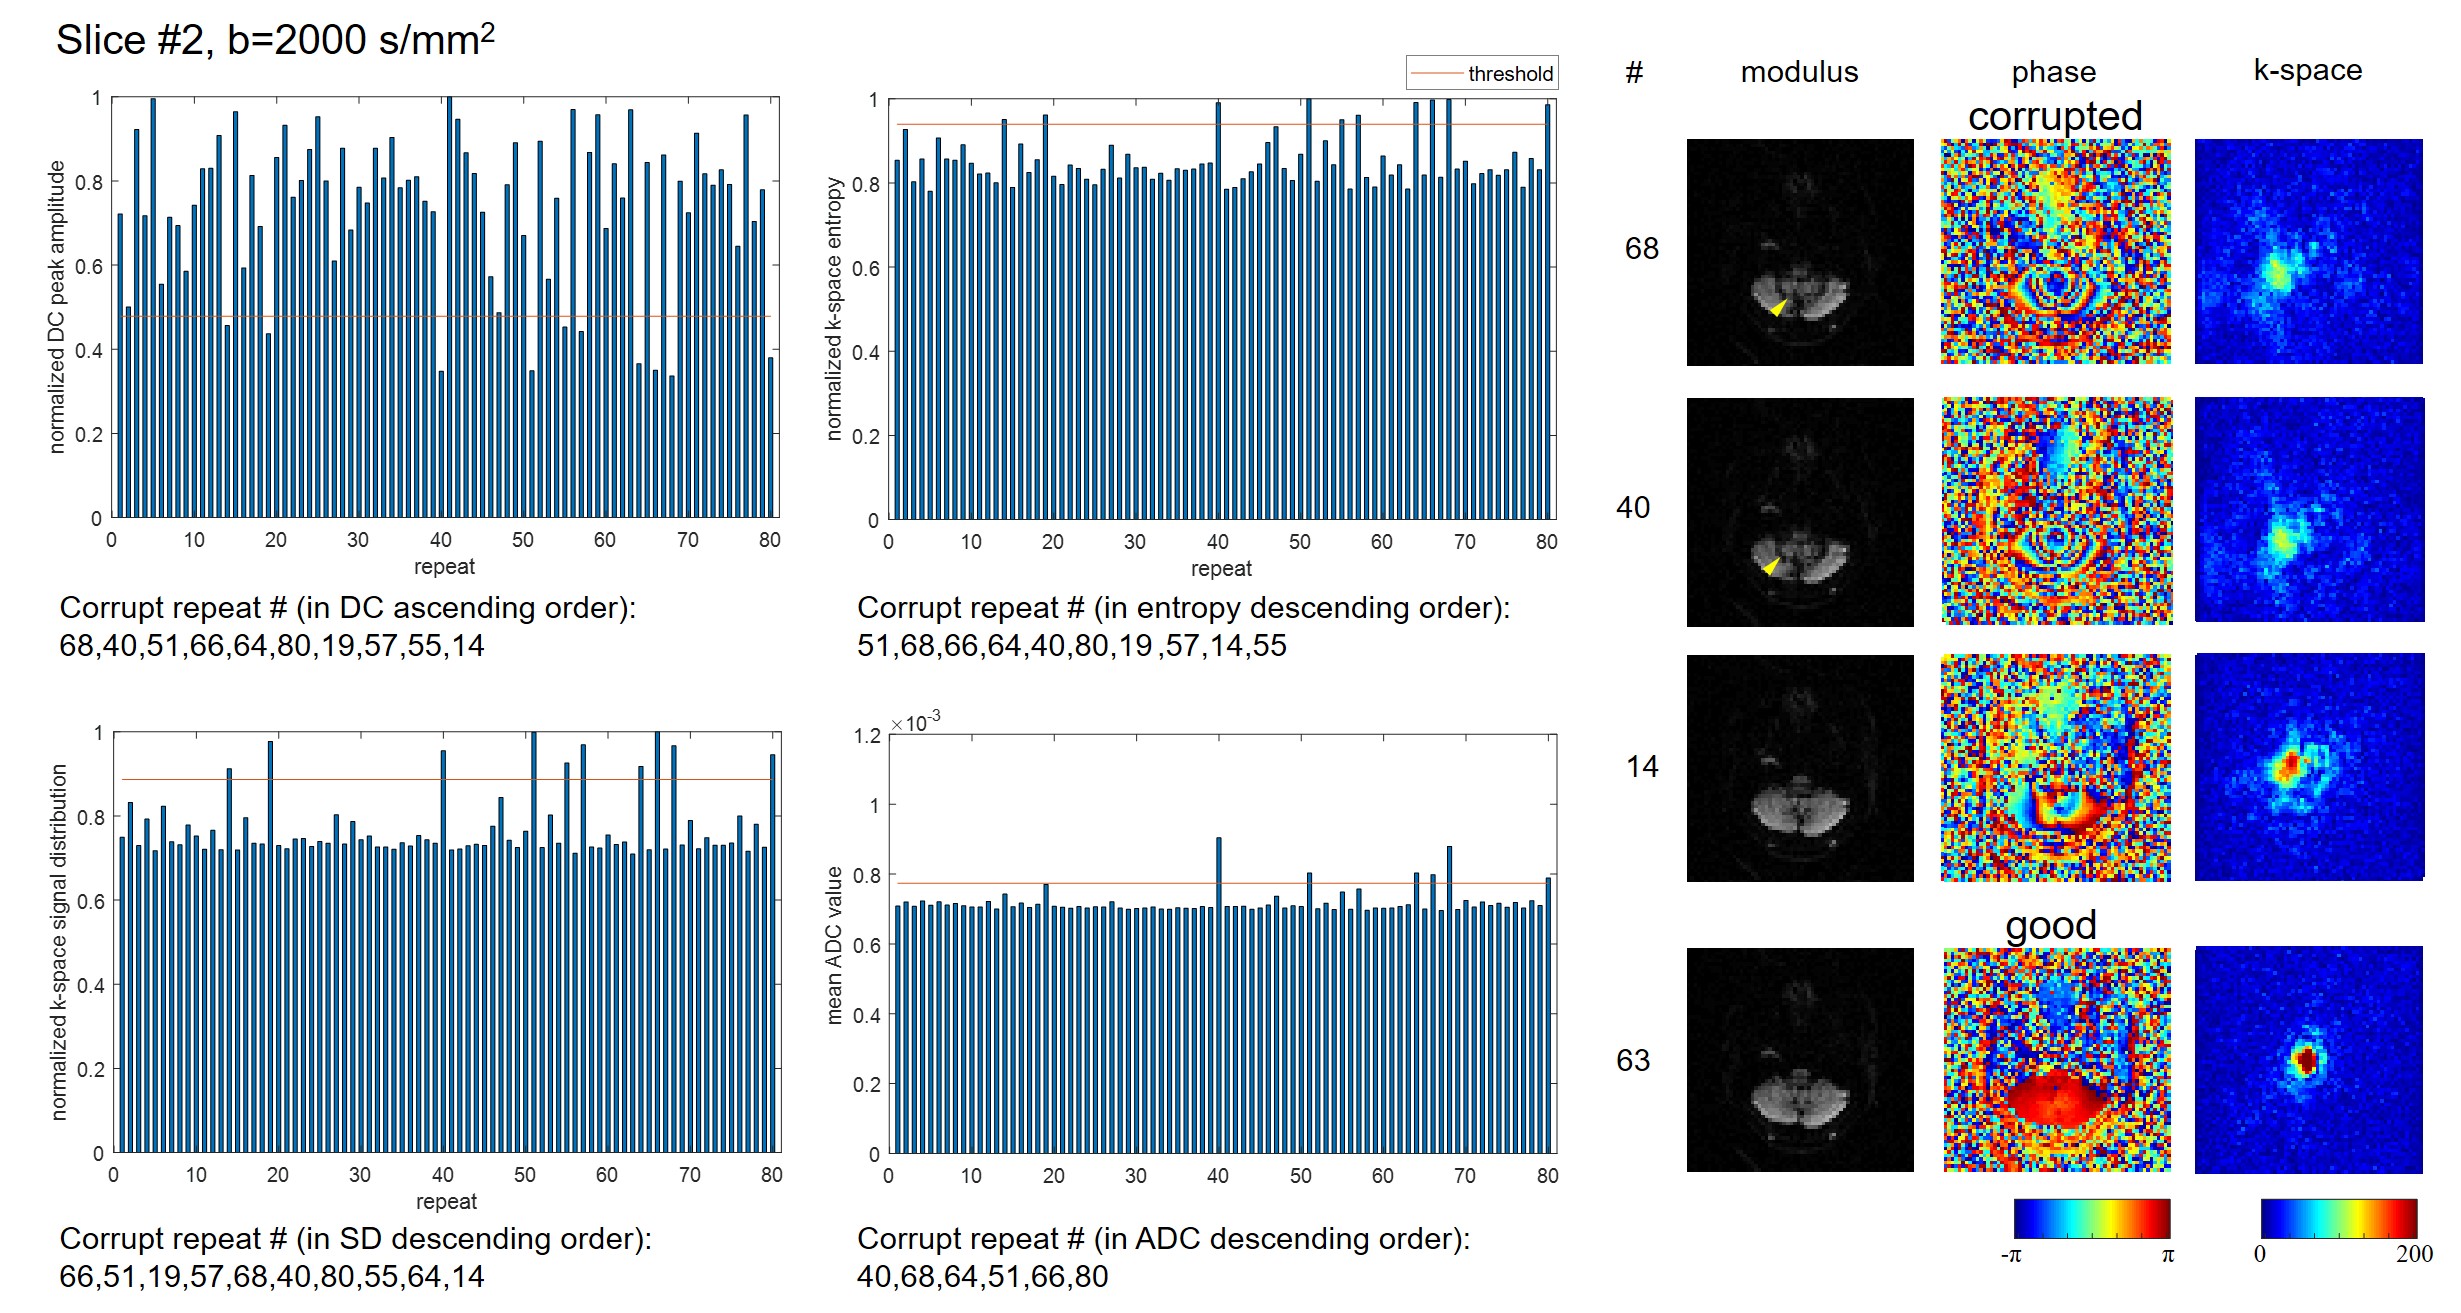
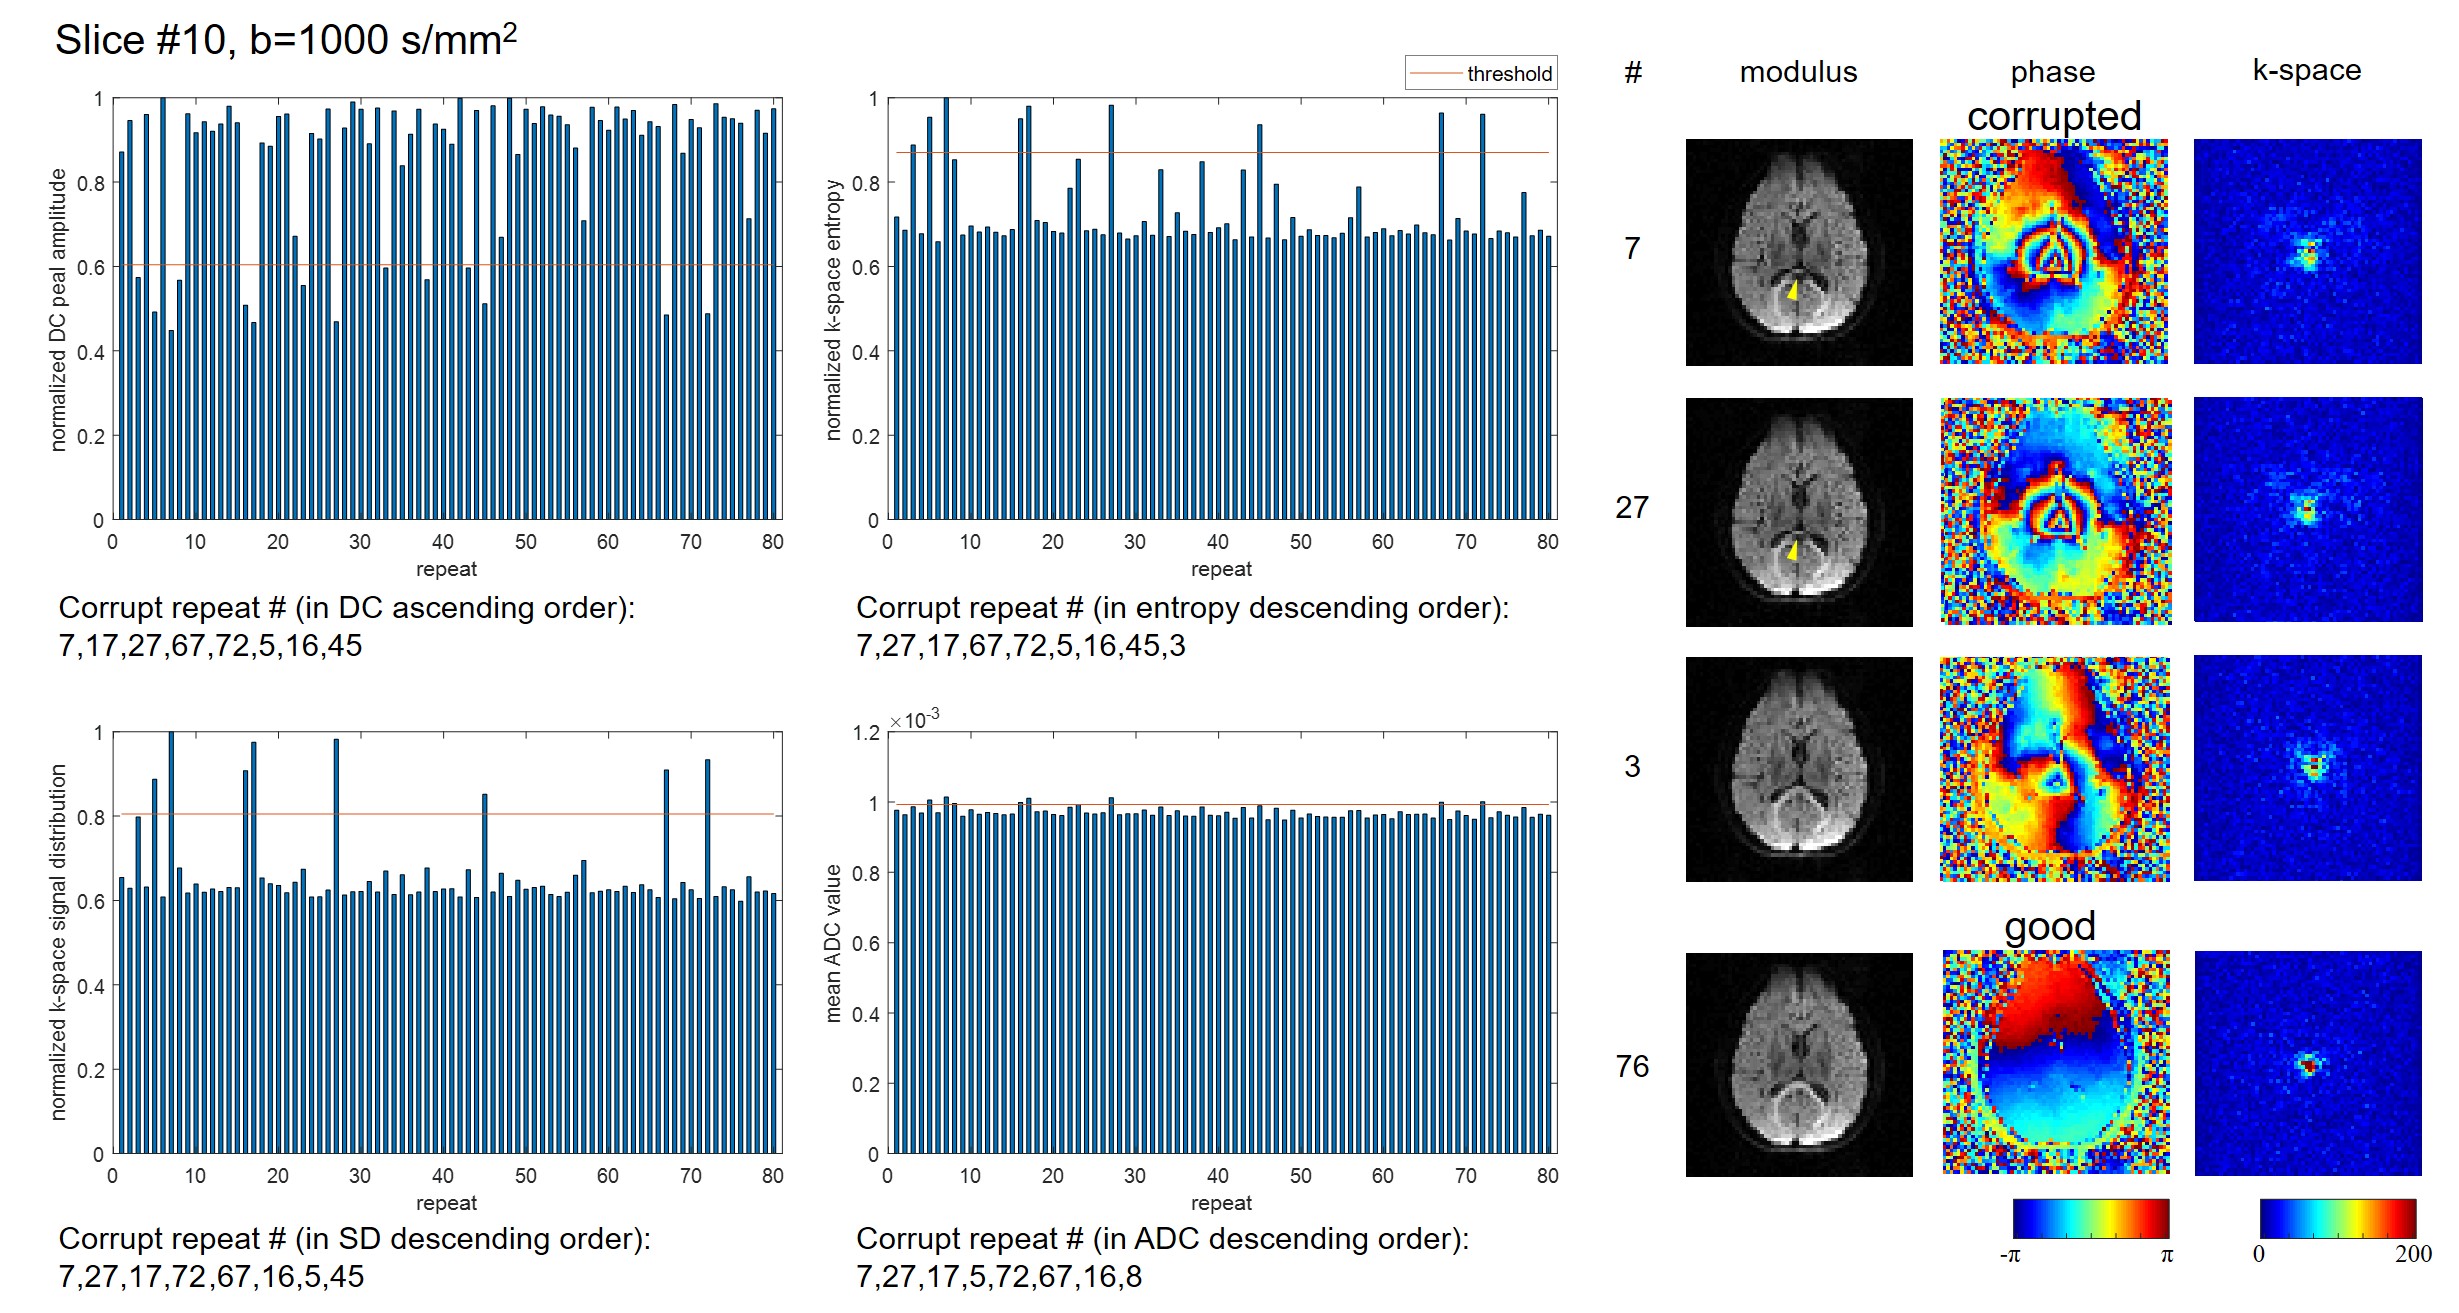
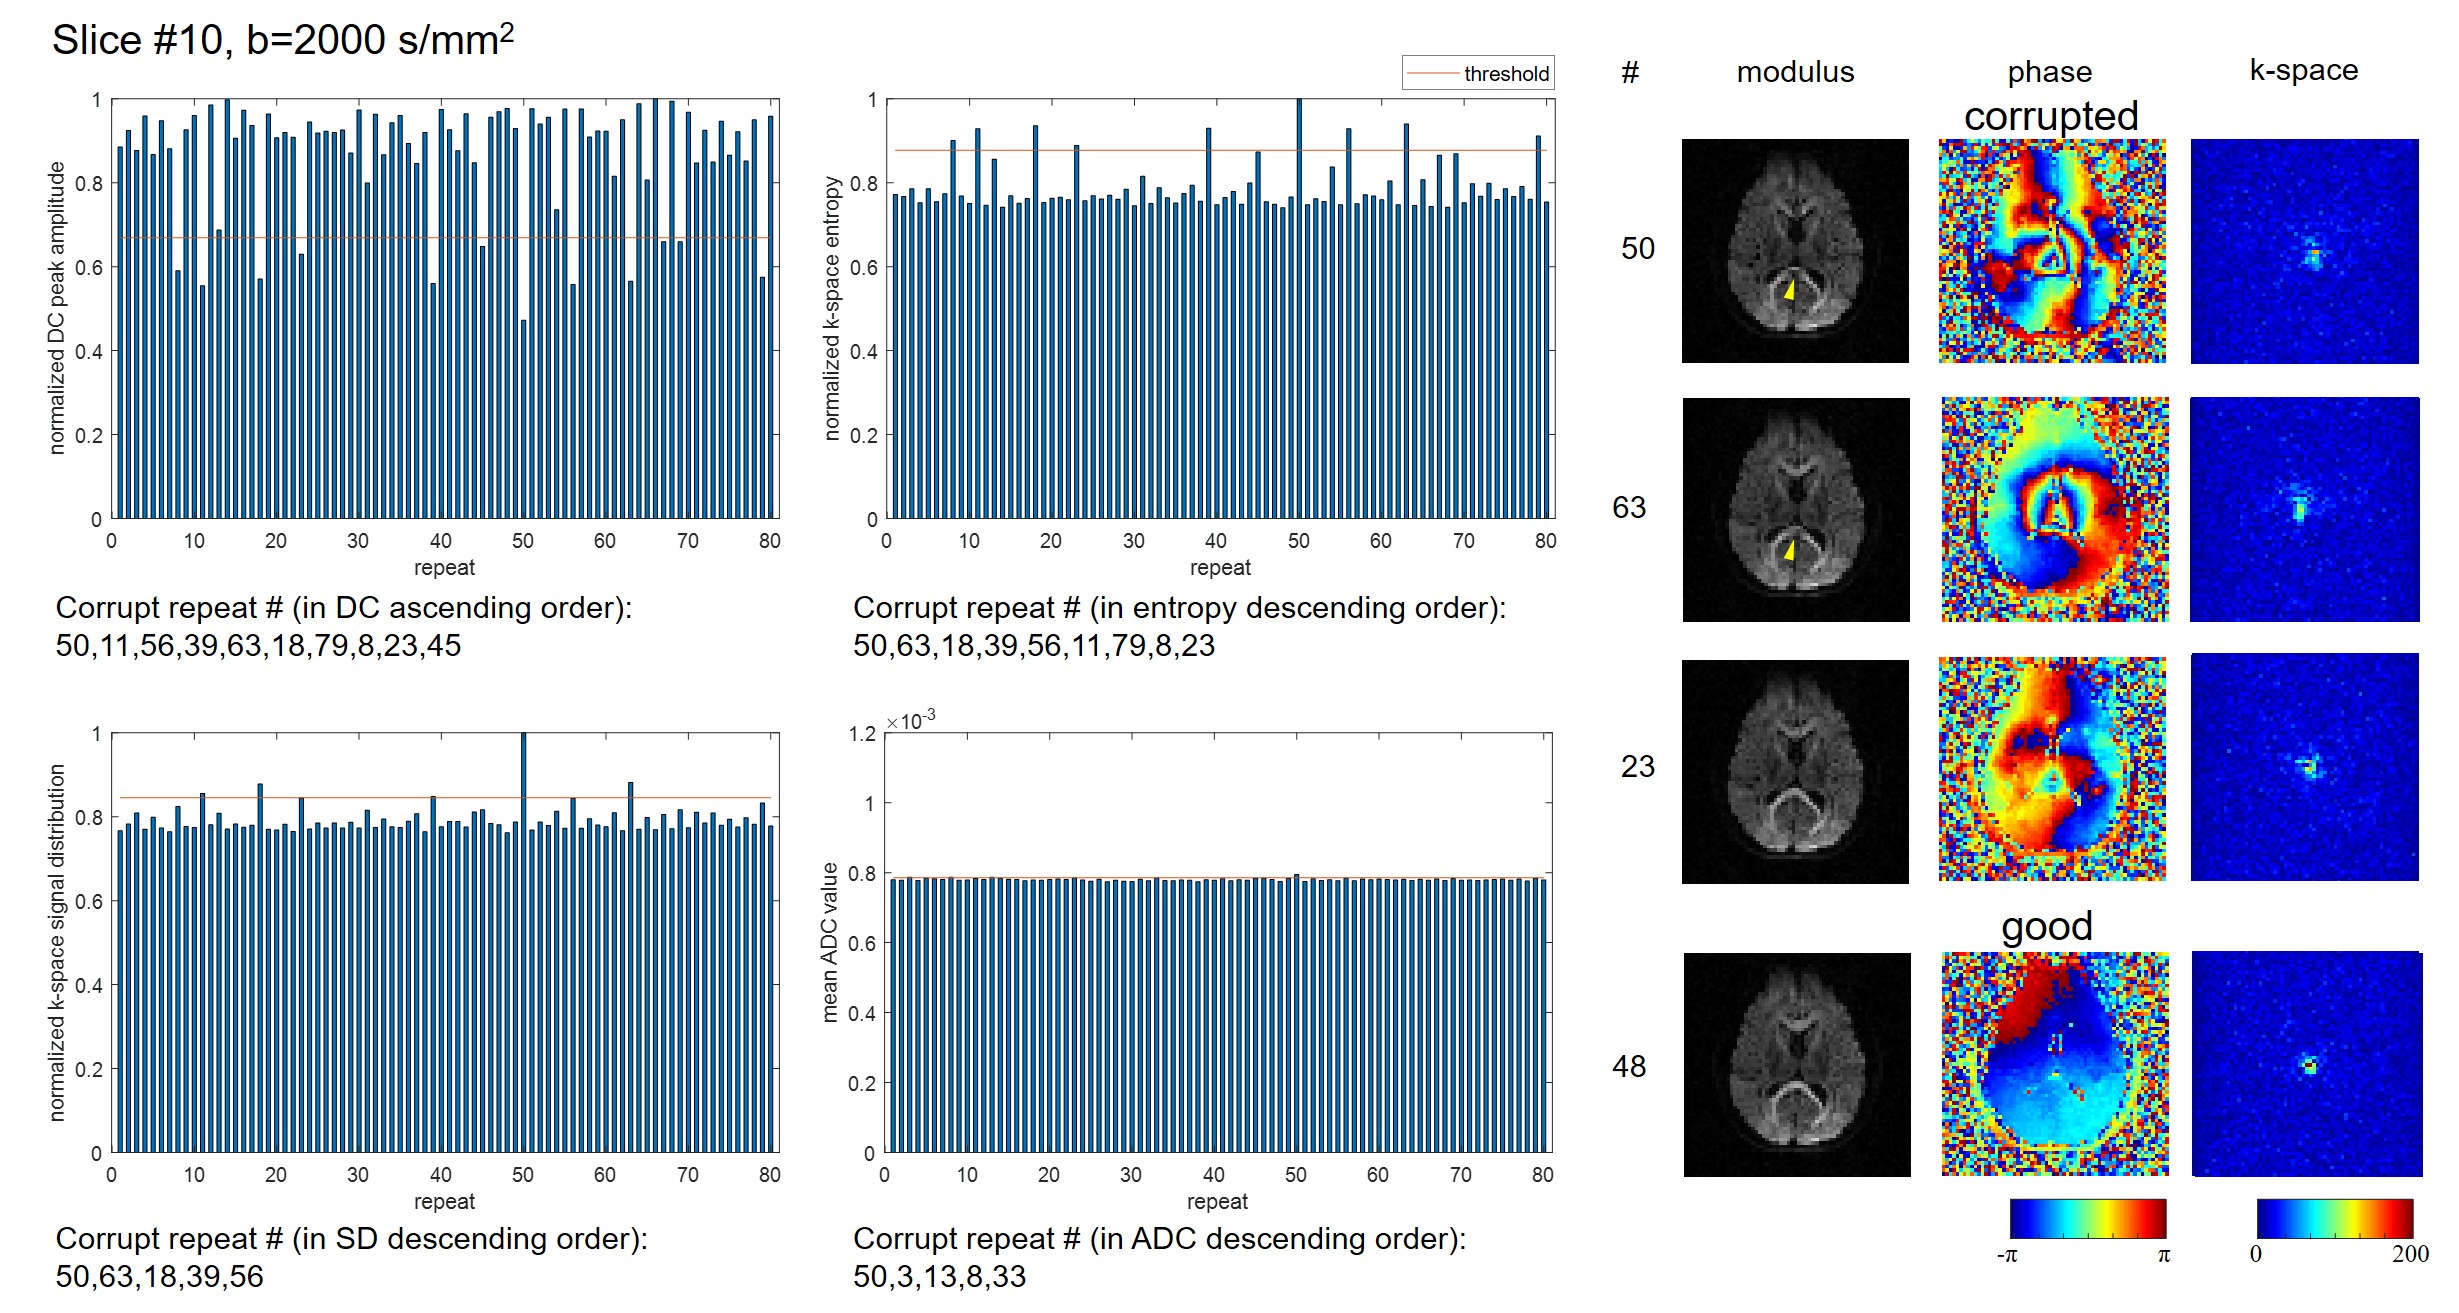
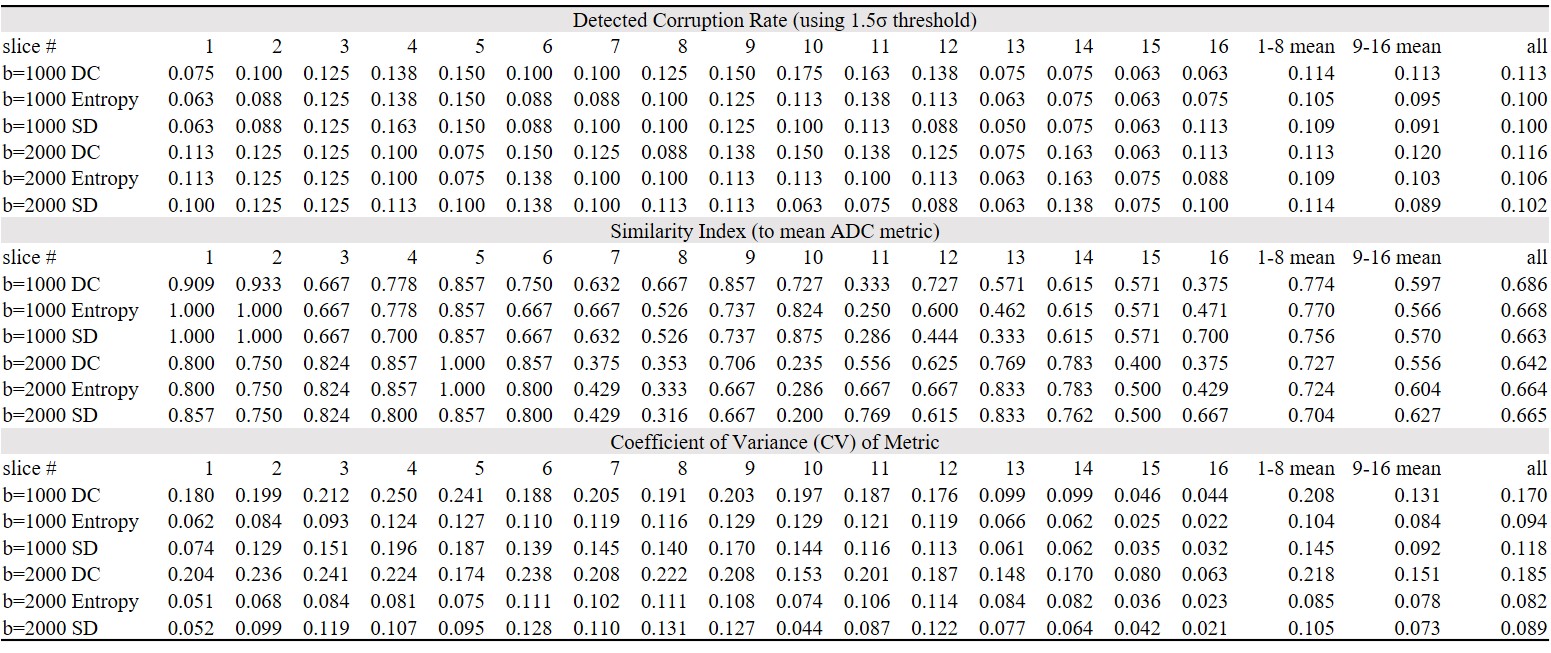
Fig.1-4 show results (normalized metrics) of two typical slices with two b-values. The detected data corruption rate, similarity to ADC metric and coefficient of variance of the metrics are provided in Table.1. All three methods can successfully detect data corruption in diffusion imaging. SIs (similarity indexes) to ADC metric show no significant difference (P=0.84,0.97,0.90). The preset threshold using 1.5σ results the corruption rate about 10% for all three methods, and the SIs all reached about 66% to 69%. Compared to superior slices (#9-16), inferior slices (#1-8) show higher SIs (P=0.01,0.05,0.06), and higher corruption rates in signal distribution metrics (P=0.02). The DC peak amplitude metric shows larger fluctuation compared to the other two metrics (CV, P<0.01, P<0.01).
Discussion
Although different methods detect motion-induced data corruption from different k-space properties, they all show consistency in results. The experiment uses the single-shot data set for evaluation, and can be easily extended to multi-shot acquisition with navigator data. In practice, the threshold should be chosen more smartly than the fixed standard +/-1.5σ as in this work, which aims to remain consistent throughout the comparison. Besides brain scans, spinal cord, liver and heart diffusion imaging may also need carefully tuned corrupt data detection.Conclusion
For diffusion imaging data corruption detection, metrics using k-space DC peak amplitude, entropy and signal distribution can all successfully detect corrupted shot. These metrics show good detection consistency with each other and also with ADC measurement.Acknowledgements
No acknowledgement found.References
1. Skare S, Andersson JLR. On the effects of gating in diffusion imaging of the brain using single shot EPI. Magn. Reson. Imaging 2001;19:1125–1128.
2. Butts K, Pauly J, De Crespigny A, Moseley M. Isotropic diffusion-weighted and spiral-navigated interleaved EPI for routine imaging of acute stroke. Magn. Reson. Med. 1997;38:741–749.
3. Atkinson D, Porter DA, Hill DLG, Calamante F, Connelly A. Sampling and reconstruction effects due to motion in diffusion-weighted interleaved echo planar imaging. Magn. Reson. Med. 2000;44:101–109.
4. Holdsworth SJ, Skare S, Newbould RD, Bammer R. Robust GRAPPA-accelerated diffusion-weighted readout-segmented (RS)-EPI. Magn. Reson. Med. 2009;62:1629–1640.
5. Porter DA, Heidemann RM. High resolution diffusion-weighted imaging using readout-segmented echo-planar imaging, parallel imaging and a two-dimensional navigator-based reacquisition. Magn. Reson. Med. 2009;62:468–475.
6. Zhang Z, Huang F, Ma X, Xie S, Guo H. Self-feeding MUSE: A robust method for high resolution diffusion imaging using interleaved EPI. Neuroimage 2015;105:552–560.
Figures