5303
Investigation of Schizophrenia Patients with Clozapine-Induced Obsessive Compulsive Symptoms by Advanced MR Imaging1National Magnetic Resonance Research Center (UMRAM), Bilkent University, Ankara, Turkey, 2Department of Neurological Sciences and Psychiatry, Hacettepe University, Ankara, Turkey, 3Department of Radiology, Hacettepe University, Ankara, Turkey
Synopsis
We aimed to investigate white matter (WM) integrity and structural differences in schizophrenia patients with clozapine-induced obsessive compulsive symptoms (S-OCS) comparing them those without symptoms (S) and healthy controls (HC). Tract-based-spatial-statistic/diffusion-tensor-imaging, voxel-based morphometry, and caudate volume measurements were performed to reveal underlying WM and gray matter (GM) alterations. S-OCS showed less fractional anisotropy (FA) reductions in WM and less areas of reduced GM density than S when compared to HC. FA elevations and increased GM density were observed in S-OCS compared with S. The results may suggest differential effect of clozapine, and/or different baseline pathophysiology in a subgroup of patients.
Purpose
Studies have shown the relationship between development of obsessive compulsive symptoms and clozapine treatment in patients with schizophrenia1,2. We aimed to investigate white matter (WM) integrity and structural differences in schizophrenia patients with clozapine-induced obsessive compulsive symptoms (S-OCS) comparing them those without symptoms (S) and healthy controls (HC).
Methods
IRB was obtained and all the participants gave signed consent form.
Subjects: Eighteen patients with schizophrenia, under clozapine treatment for the past 6 months (age range: 18-65 years) and nine age-, sex- and education-matched HC (p>0.05) participated in the study. Patients were categorized as S-OCS and S. The Yale-Brown Obsessive Compulsive Score was higher than 16 for S-OCS and lower than 8 for each S patient.
Image Acquisition: A 3T MR scanner (Ingenia, Philips) equipped with an 8-channel phase-array head coil was used. Diffusion tensor imaging (DTI) (single-shot EPI; TR/TE: 5283/99 msec, max. b factor: 800 s/mm2, 15 independent directions, 60 axial sections, 2 mm thickness without intersection gap, voxel size: 2x2x2 mm), 3D T1W high resolution (TR/TE: 7.9/3.5 msec; distance factor: %50) imaging were obtained.
Data Processing and Analysis: TBSS, a part of FSL3 was used for multiple comparisons of the groups for DTI analysis. Fractional anisotropy (FA) maps were computed following head motion and eddy current correction, skull stripping and diffusion tensor fitting processes. Then, TBSS procedures applied as described by Smith et al4 for the multiple comparisons of the groups.
Computational Anatomy Toolbox5 implemented in SPM12 (http://www.fil.ion.ucl.ac.uk/spm/software/spm12/) was used for voxel-based morphometry (VBM) analysis which included segmentation of gray matter (GM), WM and cerebral spinal fluid (CSF) tissue classes, Dartel to estimate all the deformations, normalization to MNI atlas and smoothing using a full-width half-maximum of 8 mm procedures. After getting the modulated images, we applied two-sample t-test using basic model. We used total intracranial volume (TIV) as covariates of no interest. TIV was calculated by adding up segmented GM, WM and CSF volume in MATLAB for each subject. Two sample t contrasts were then generated using FWE rate with an uncorrected p < 0.0001 threshold and thresholded cluster size with k of 10.
Upon our observation of SPM results we decided to compute caudate nuclei volumes in the patient groups and HC using Freesurfer (V5.3.0) (http://surfer.nmr.mgh.harvard.edu/)6. Two-sample t-test was applied to determine the differences between the groups.
Results
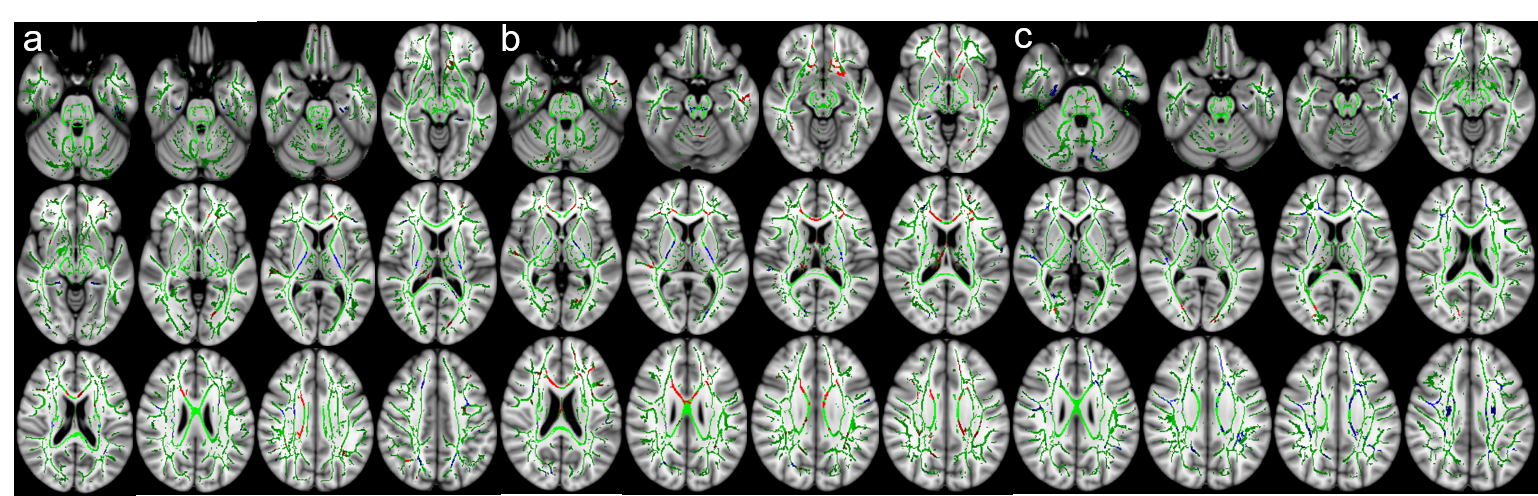
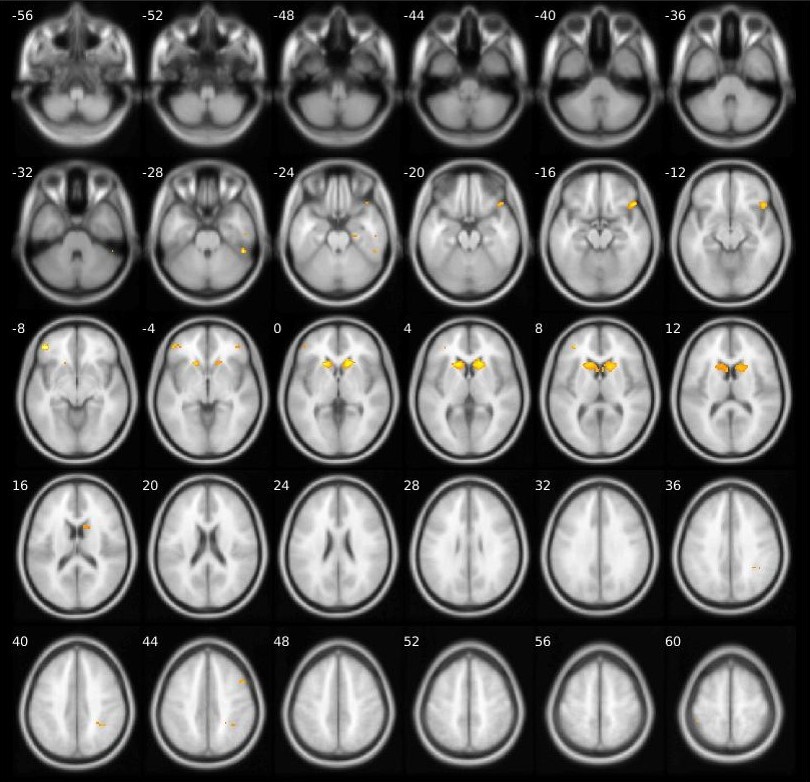
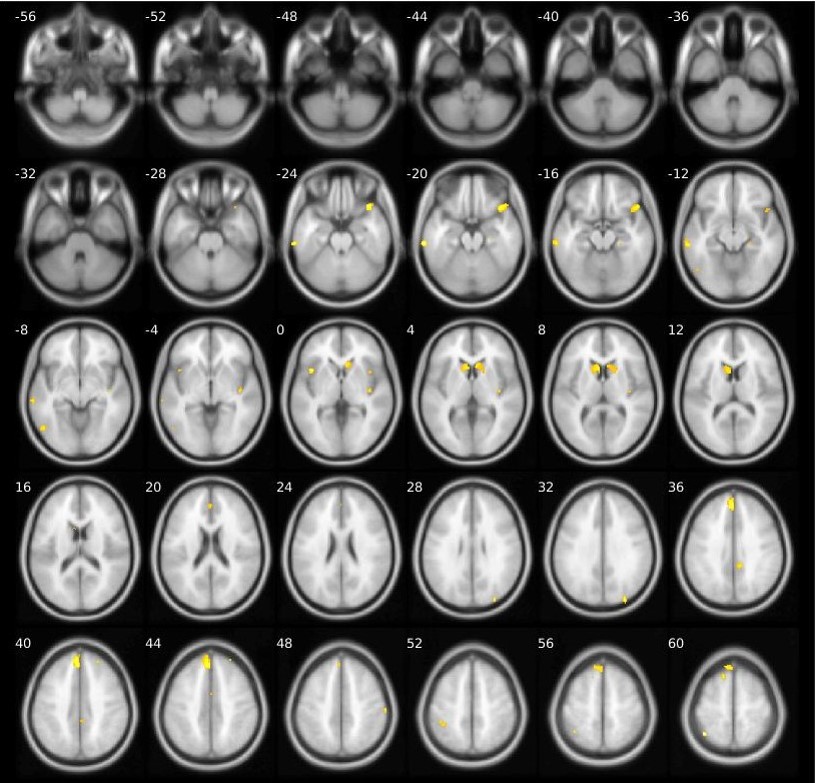
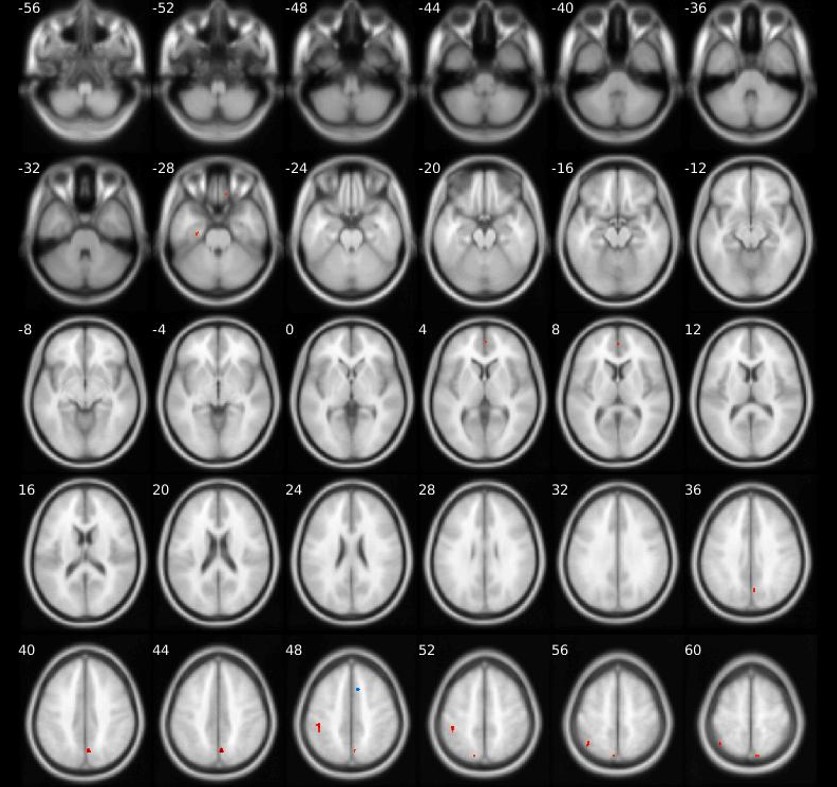
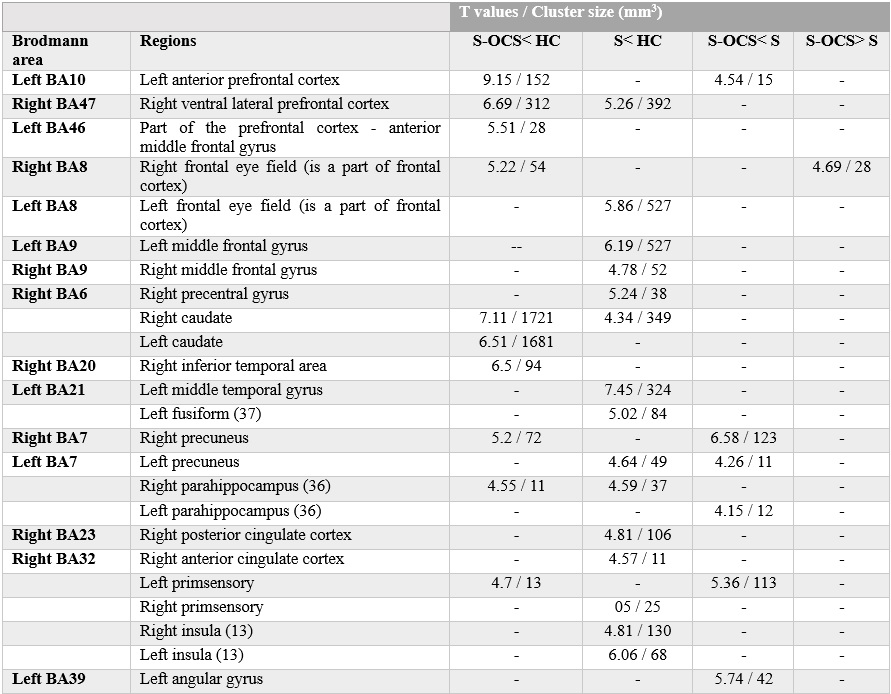
Compared to HC, S-OCS showed increased FA in bilateral posterior limb of internal capsules and hippocampi and reduced FA mainly in the corpus callosum (Fig. 1a). FA reduction was more extensive in S than S-OCS, including the corpus callosum, right fornix, left anterior limb of internal capsule, bilateral inferior frontal WM (Fig. 1b). Comparison of S-OCS and S revealed FA elevations in the frontoparietal and anterior temporal regions in S-OCS (Fig.1c). VBM yielded less voxel density in bilateral caudate nuclei in both patient groups compared to HC, a finding not significant in comparison of patient groups in between. (Fig. 2, 3 and 4). This was also true with bilateral caudate nuclei volumes, which were significantly reduced in comparison of patient groups with HC in left (ps-ocs=0.009, ps=0.043) and right (ps-ocs=0.003, ps=0.037), however disappeared in comparison of the patient groups (p=0.93 and 0.77). The insula and right cingulate gyri showed GM density reduction in S together with some other cortical regions in the frontotemporal lobes, yet showed no difference in S-OCS when compared to HC (Fig. 2 and 3, table 1). Overall, S-OCS showed less GM density in 10 different cortical regions defined by MNI atlas and S did so in 15 different regions in comparison with HC. Furthermore S-OCS showed greater density than S in right frontal eye field regions. A few regions including bilateral precuneus, left anterior prefrontal cortex, left hippocampus showed lesser GM density in S-OCS compared to S (Fig. 4).Discussion and Conclusion
Both S-OCS and S showed alterations in WM and GM of the brain. S-OCS showed less FA reductions in WM and less areas of reduced GM density than S when compared to HC. FA elevations in WM of frontoparietal and anterior temporal lobes and increased GM density in the right eye-field region in S-OCS were observed. Previously, clozapine was shown to increase NAA/Cre in dorsolateral prefrontal cortex, and cause widespread alterations in WM integrity in patients with schizophrenia7,8. Differences in structural brain findings of two patient groups in this study may suggest differential effect of clozapine, and/or different baseline pathophysiology in a subgroup of patients. The current imaging findings may reflect the end result of an adaptive or maladaptive process caused by clozapine in an already malfunctioning brain.Acknowledgements
No acknowledgement found.References
- Baker RW, Chengappa KNR, Baird JW, et al. Emergence of obsessive-compulsive symptoms during treatment with clozapine.J. Clin. Psychiatry.1992;53:439–442.
- Ertugrul A, Anil Yagcioglu AE, Eni N, et al. Obsessive-compulsive symptoms in clozapine-treated schizophrenic patients.Psychiatry Clin Neurosci.2005;59(2):219-22.
- Jenkinson M, Beckmann CF, Behrens TE, et al. Fsl. Neuroimage. 2012;62(2):782-90.
- Smith SM, Jenkinson M, Johansen-Berg H, et al. Tract-based spatial statistics: voxelwise analysis of multi-subject diffusion data. Neuroimage.2006;31(4):1487-505.
- Gaser, C. CAT: A Computational Anatomy Toolbox for SPM. http://dbm.neuro.uni-jena.de/cat/
- Fischl B, Salat DH, Busa E, et al. Whole brain segmentation: automated labeling of neuroanatomical structures in the human brain.Neuron.2002;33(3):341-55.
- Ozcelik-Eroglu E, Ertugrul A, Oguz KK, et al. Effect of clozapine on white matter integrity in patients with schizophrenia: a diffusion tensor imaging study. Psychiatry Res.2014 ;223(3):226-35.
- Ertugrul A, Volkan-Salanci B, Basar K, et al. The effect of clozapine on regional cerebral blood flow and brain metabolite ratios in schizophrenia: relationship with treatment response. Psychiatry Res. 2009;174(2):121-9.
Figures