5302
Disrupted functional connectivity of occipital lobe with frontal and parietal regions in subjects with Cocaine addiction.1Computer Science and Engineering, Indian Institute of Technology Delhi, Delhi, India
Synopsis
The study aims at exploring a data driven method to analyse connectivity differences between two populations - subjects with cocaine addiction and healthy controls. Sufficient indications of previously undiscovered hypo- and hyper-connectivity was observed in cocaine addicts spanning different lobes of brain suggesting that hypothesis driven approaches are insufficient.
Introduction
ROI based resting state data analysis is widely used to assess intrinsic differences between diseased population and healthy controls.1-3 However, owing to the large size of data, most ROI based connectivity studies are limited to default mode network4,5 analysis or using a small number of seeds obtained through a hypothesis driven approach.6,7 Recent studies using voxel based connectivity analysis suggest that the entire brain is connected to each other.8 By limiting the analysis to a few ROIs, information present in the data may not be fully utilised. For a fine grained analysis, an extensive data driven approach is adopted wherein gray matter of the whole brain is parcellated into seed regions and connectivity differences between population with cocaine addiction and healthy controls is measured.Methods
Resting state data of 29 cocaine addicts (abstinent for more than 2 weeks) and 25 healthy controls was taken from the NYU Cocaine dataset.9 Data processing done using FSL10 included slice timing correction, motion correction, spatial smoothing (full width half maximum = 6mm), mean based intensity normalization, high pass filtering (0.009 Hz), global signal removal, linear registration of functional to structural images and nonlinear registration of structural to MN152 template.
Two hundred and seventy four seed regions completely covering the gray matter were created using Brainnetome atlas11 for cerebrum (n=246) and probabilistic atlas for cerebellum12,13 (n=28). Whole-brain (gray matter only) voxelwise correlations with mean time series, derived separately for all ROIs, were computed. Two-sampled two-tailed t-test was applied on Fisher Z-transformed correlation maps and whole brain FDR correction (p < 0.05) was performed for each ROI individually. Data from two runs of a subject was treated as independent samples to compensate for small number of sample size, resulting into 56 samples for addicts and 48 samples for normal healthy controls.
Results
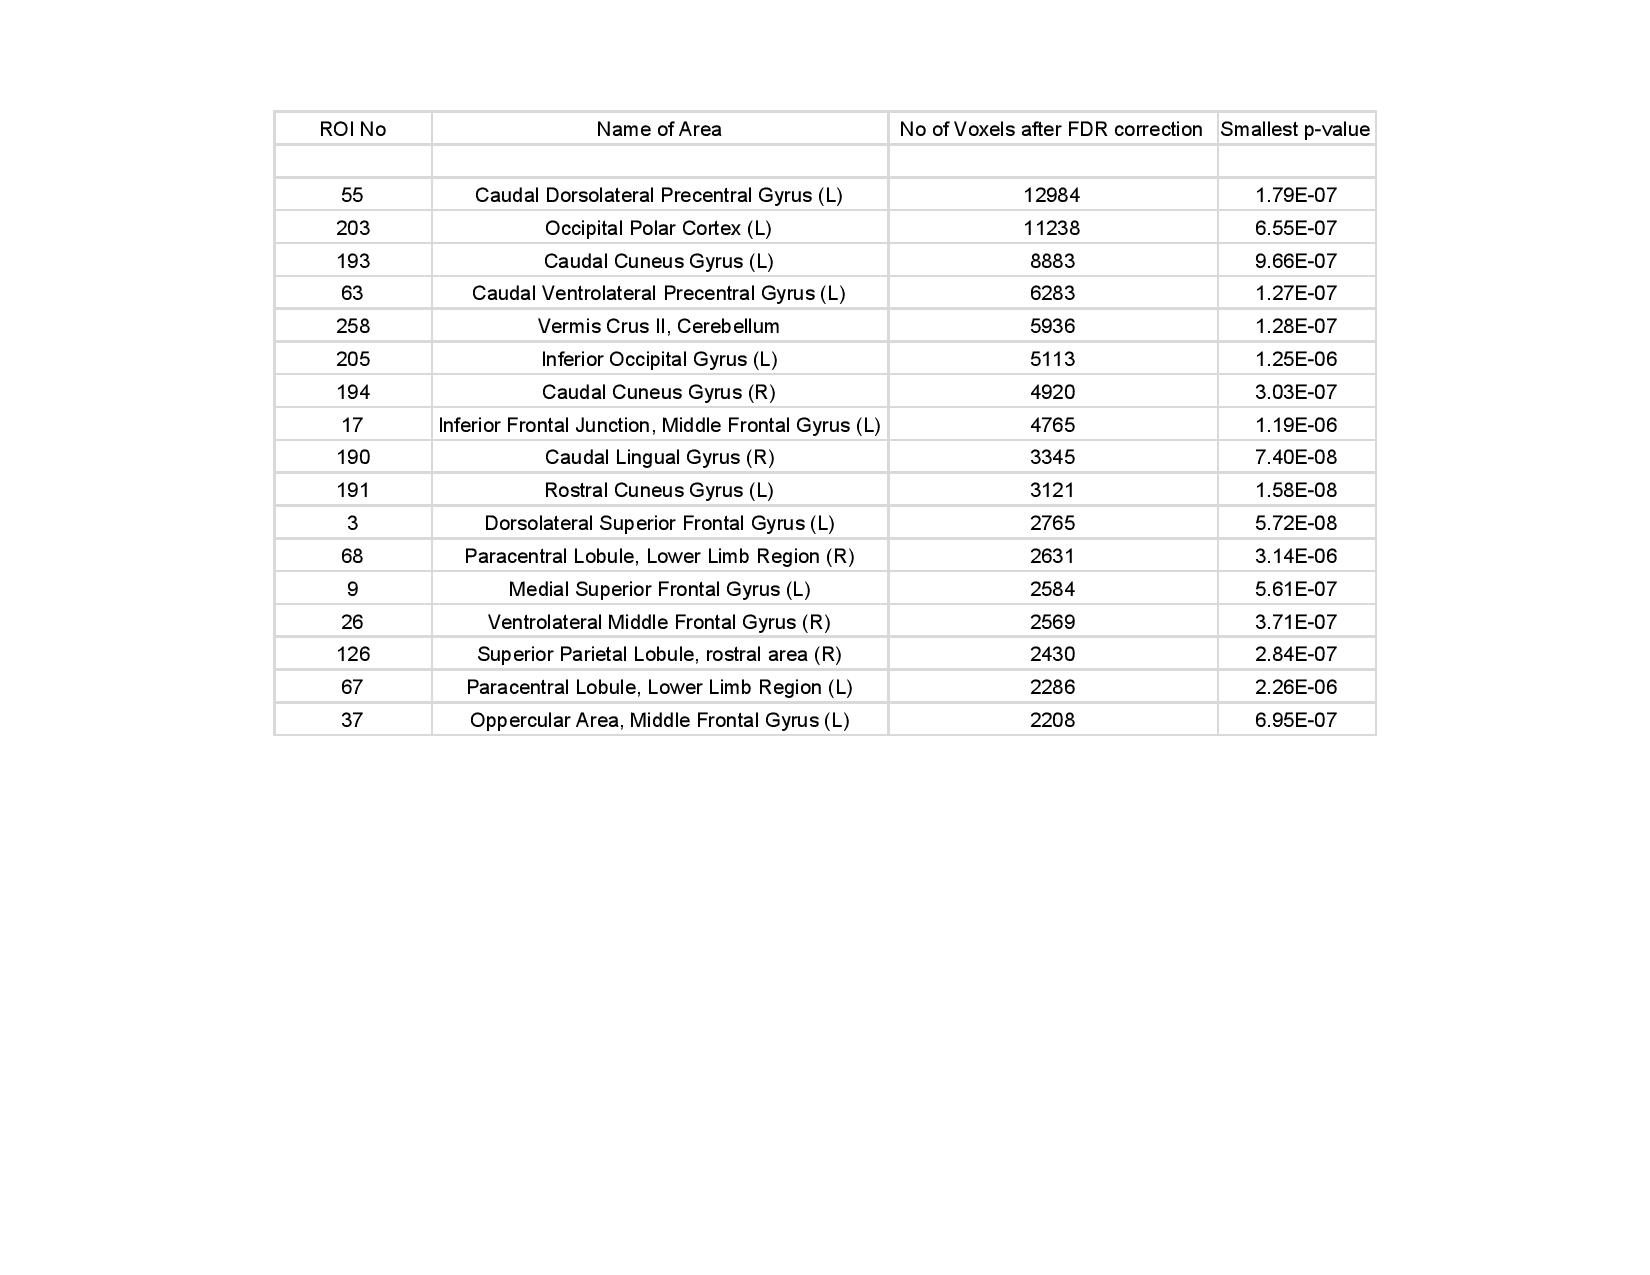
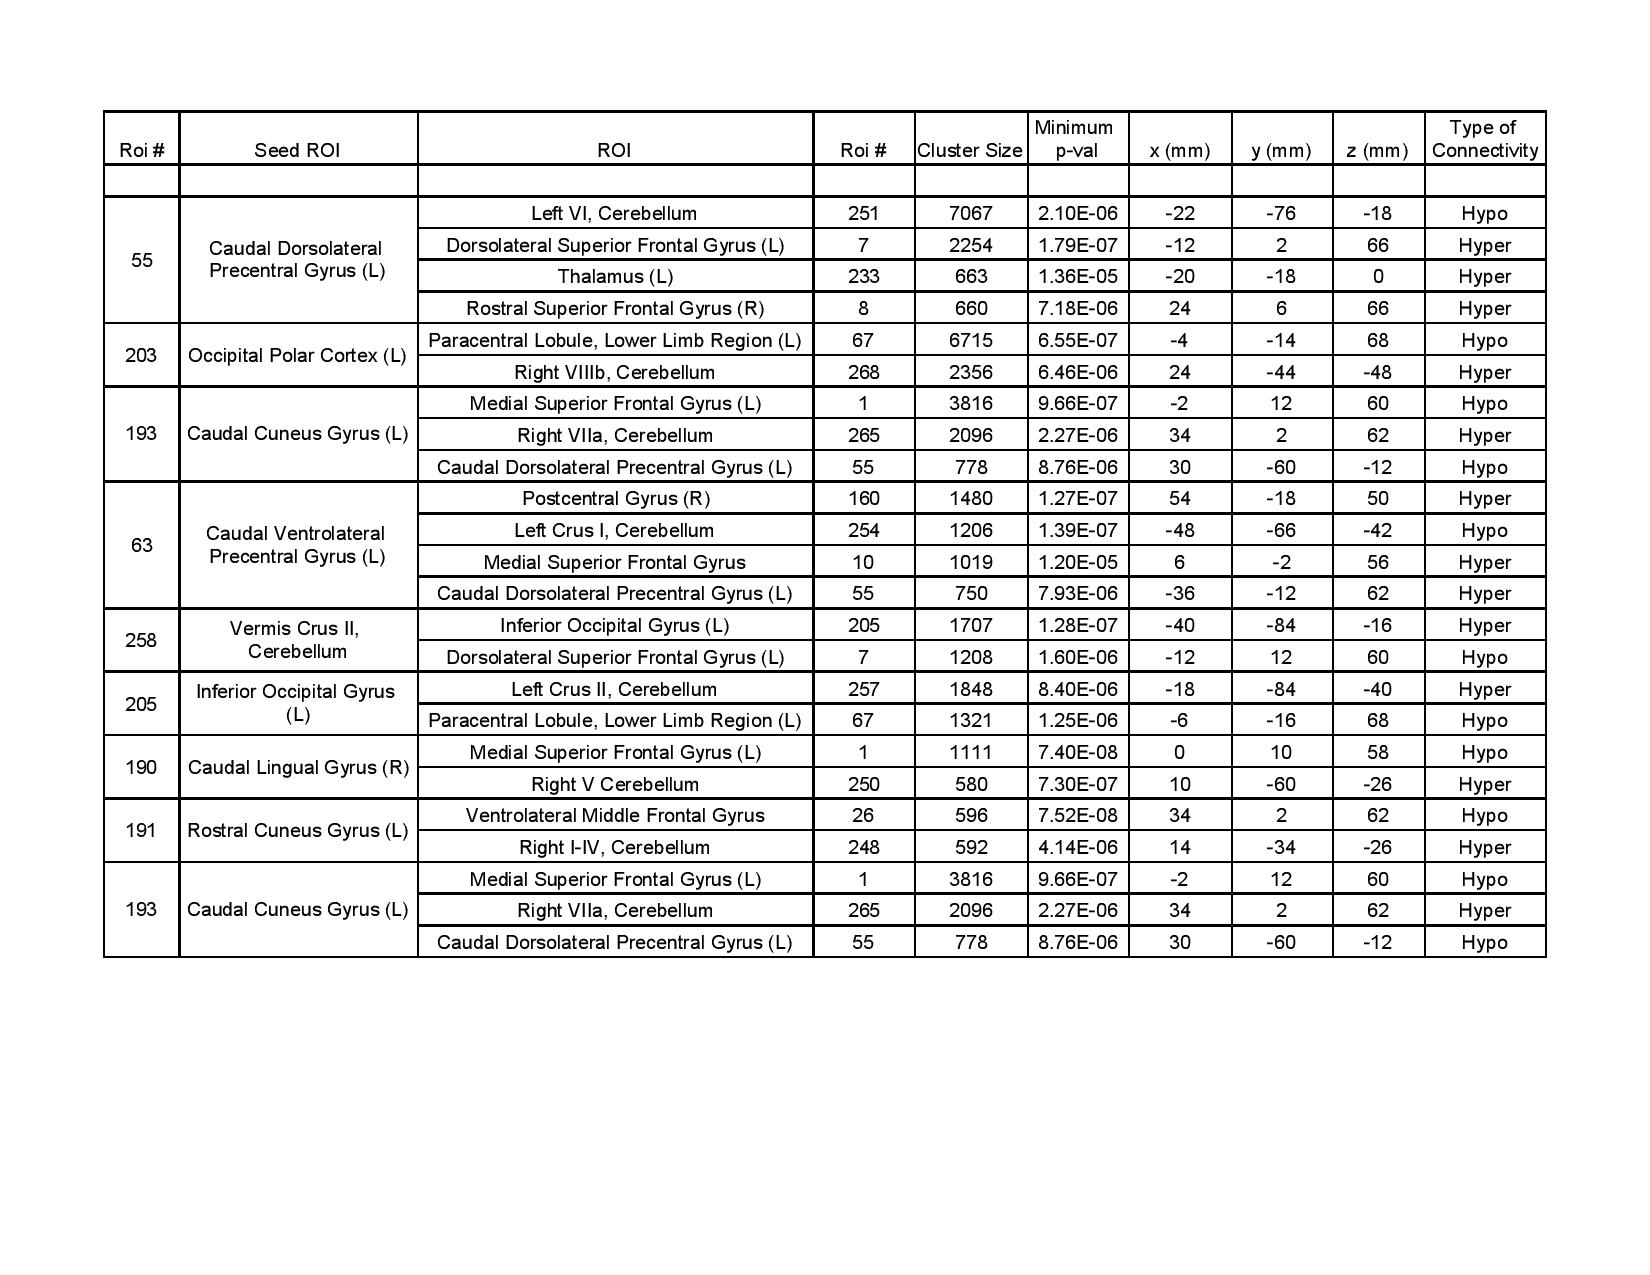
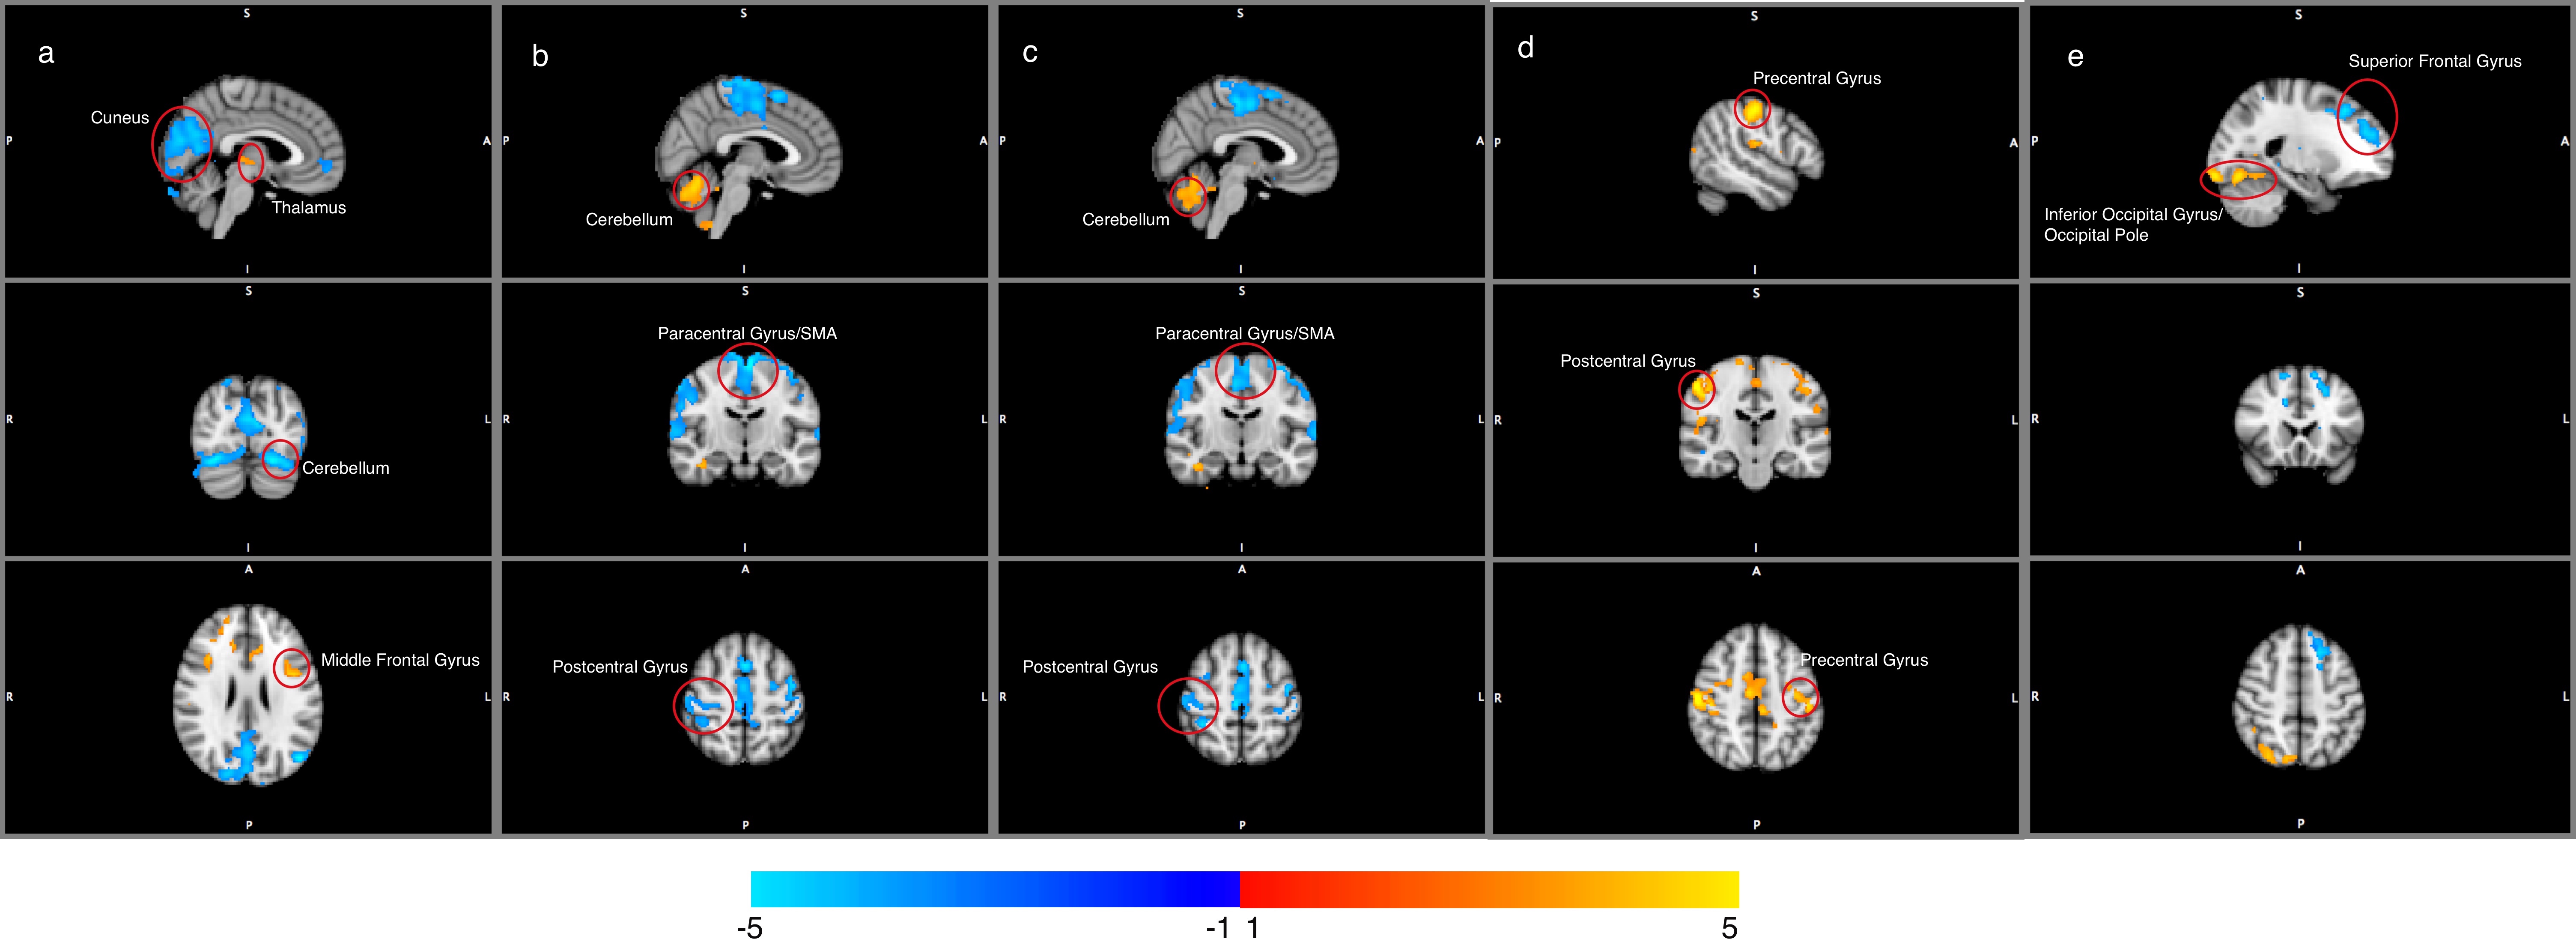
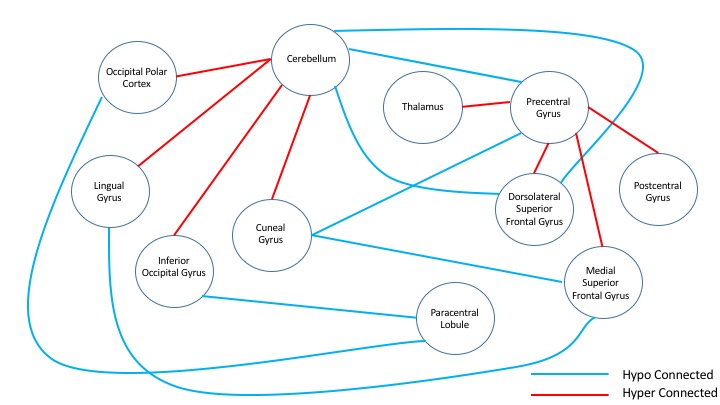
Out of two hundred seventy four seed regions used, sixty four ROIs showed significant between group connectivity differences with minimum number of significant voxels capped at 100. Figure 1 lists information about seventeen seed regions in decreasing order of number of significant voxels in their FDR-corrected t-statistic maps. Statistics for between group connectivity difference are reported in Figure 2 limiting to nine seed regions due to space constraints. The brain maps for five of them are shown in Figure 3. Cocaine addicted group showed disruption in connectivity between frontal and occipital region, parietal and occipital regions, frontal and cerebellar regions. The graph in Figure 4 represents the between group connectivity differences with blue edges representing hypo-connectivity and red edges representing hyper-connectivity. Cerebellum is observed to be hyper connective with occipital region but shows hypo connectivity with frontal regions. An increase in connectivity between frontal (precentral gyrus) and parietal (postcentral gyrus) regions is observed. No connectivity difference was observed for temporal regions. Connectivity difference in regions of basal ganglia (putamen) was observed could not be reported here due to space constraints.Discussion
This study reinforces some already known connectivity differences in addiction involving fronto-cerebellar network,14,4 lingual and cuneus regions with the executive network,15 differences in fronto-parietal network including supplementary motor area, paracentral lobule, thalamus, post-central gyrus.16 Figure 4 suggests the presence of two groups such that connectivity within the groups has strengthened but decreased between the groups. Increased connectivity with cerebellum can also be viewed as a mechanism to compensate17 for decreased connectivity between the two lobes.
This data driven approach was able to provide a range of significant results in a single experiment without any underlying model assumptions making it easily reproducible. However, the current study has a few limitations. A small number of subjects makes statistical deduction very hard. With a larger dataset, the bias of including the same subject twice can be eliminated. Also, FDR correction can be performed two-fold, spanning across correlation maps.
Conclusions
Preliminary report on this data driven report suggest that connectivity changes in psychiatric diseases like cocaine addiction are not localized or limited to one or two regions. However, experiments on a larger group of subjects are required with stronger statistical analysis to ascertain this.Acknowledgements
Financial support for the data used in this project was provided by a grant from the National Institute on Drug Abuse (R03DA024775) to Clare Kelly.References
- Sutherland, Matthew T., et al. "Resting state functional connectivity in addiction: lessons learned and a road ahead." Neuroimage 62.4 (2012): 2281-2295.
- Pariyadath, Vani, Joshua L. Gowin, and Elliot A. Stein. "Resting state functional connectivity analysis for addiction medicine: from individual loci to complex networks." Progress in brain research 224 (2016): 155-173.
- Ma, Liangsuo, et al. "Effect of cocaine dependence on brain connections: clinical implications." Expert review of neurotherapeutics 15.11 (2015): 1307-1319.
- Chanraud, Sandra, et al. "Disruption of functional connectivity of the default-mode network in alcoholism." Cerebral cortex 21.10 (2011): 2272-2281
- Ding, Xiaoyu, and Seong-Whan Lee. "Cocaine addiction related reproducible brain regions of abnormal default-mode network functional connectivity: a group ICA study with different model orders." Neuroscience letters 548 (2013): 110-114.
- Rogers, Baxter P., et al. "Reduced fronto‐cerebellar functional connectivity in chronic alcoholic patients." Alcoholism: Clinical and Experimental Research 36.2 (2012): 294-301.
- Tomasi, Dardo, et al. "Disrupted functional connectivity with dopaminergic midbrain in cocaine abusers." PloS one 5.5 (2010): e10815.
- Batta Ishaan, and Garg Rahul “Full-Brain autoregressive modelling and functional connectivity analysis of resting state fMRI data.” Department of Computer Science and Engineering, Indian Institute of Technology Delhi (2017)
- Kelly, Clare, et al. "Reduced interhemispheric resting state functional connectivity in cocaine addiction." Biological psychiatry 69.7 (2011): 684-692.
- Smith, Stephen M., et al. "Advances in functional and structural MR image analysis and implementation as FSL." Neuroimage 23 (2004): S208-S219.
- Fan, Lingzhong, et al. "The human brainnetome atlas: a new brain atlas based on connectional architecture." Cerebral Cortex 26.8 (2016): 3508-3526.
- Diedrichsen J., Balster J.H., Flavell J., Cussans E., Ramnani N. (2009). A probabilistic MR atlas of the human cerebellum. Neuroimage.
- Diedrichsen J., Maderwald S., Küper M., Thürling M., Rabe K., Gizewski ER, Ladd M, Timmann D (2011). Imaging the deep cerebellar nuclei: A probabilistic atlas and normalization procedure. Neuroimage.
- Rogers, Baxter P., et al. "Reduced fronto‐cerebellar functional connectivity in chronic alcoholic patients." Alcoholism: Clinical and Experimental Research 36.2 (2012): 294-301
- Parietal Wetherill, Reagan R., et al. "Frontoparietal connectivity in substance-naive youth with and without a family history of alcoholism." Brain research 1432 (2012): 66-73
- Donald, Kirsten A., et al. "Interhemispheric functional brain connectivity in neonates with prenatal alcohol exposure: preliminary findings." Alcoholism: Clinical and Experimental Research 40.1 (2016): 113-121
- Sullivan, E., and A. Pfefferbaum. "Compensatory recruitment of neural resources in chronic alcoholism." Handb. Clin. Neurol 125 (2014): 369-380.
Figures