5300
Subcortical and medial temporal lobe shape changes following electroconvulsive therapyFilip Bouckaert1,2,3, Jurgen Germann4, Mallar Chakravarty4, Annemieke Dols5,6, François-Laurent De Winter1,3, Lies Van Assche1,3, Jan Van den Stock1,3, Stefan Sunaert7,8, Max Stek5,6, Pascal Sienaert2, Mathieu Vandenbulcke1,3, and Louise Emsell1,3,7,8
1Old Age Psychiatry, UPC KU Leuven, Leuven, Belgium, 2Academisch Centrum voor ECT en Neuromodulatie (AcCENT, UPC KU Leuven, Kortenberg, Belgium, 3Laboratory for Translational Neuropsychiatry, Dept Neurosciences, KU Leuven, Leuven, Belgium, 4Douglas Mental Health University Institute, McGill University, Montreal, QC, Canada, 5Old Age Psychiatry, GGZ in Geest, Amsterdam, Netherlands, 6Old Age Psychiatry, VU Medical Center, Amsterdam, Netherlands, 7Translational MRI, Department of Imaging & Pathology, KU Leuven, Leuven, Belgium, 8Radiology, UZ Leuven, Leuven, Belgium
Synopsis
Electroconvulsive therapy is a safe, rapid-acting antidepressant treatment that has consistently been associated with grey matter (GM) volume increase, primarily in the medial temporal lobe (MTL). Here we replicate and extend previous studies by demonstrating substantial surface area and local displacement changes in subcortical and MTL GM one week following the last ECT treatment in 70 patients with late-life depression. We report new data on ECT induced thalamus shape changes, and demonstrate that whilst the number of ECT treatments correlates positively with the degree of medial temporal GM surface area increase, this is not associated with clinical improvement in mood.
Purpose
Electroconvulsive therapy is a safe, rapid acting antidepressant treatment which has been associated with grey matter (GM) volume increase, primarily in the temporal lobe1, and also the basal ganglia2,3. How these structural changes relate to ECT’s antidepressant mechanism is currently unclear, with studies finding inconsistent associations between GM increase and clinical improvement1,2. Here we aim to further localise ECT-induced GM surface area and displacement changes and clarify the role of electrical stimulus placement and dose effects on subcortical grey matter, including the thalamus. Additionally we replicate previous analyses investigating the association between mood improvement and GM increase.Methods
T1-weighted, MPRAGE data (3T, voxel size = 0.98 x 0.98 x 1.2 mm) from 70 patients with severe late-life depression and high quality longitudinal data pre and one week following the last ECT were included from two sites: the University Psychiatric Center KU Leuven, Belgium (n=35, mean age 72.3 years, 23 female), and GGZinGeest, Amsterdam, the Netherlands (n=35, mean 71.3 years, 20 female)4. Longitudinal data at a third time point 6 months post last ECT were included for 23 patients. Patients were treated twice weekly with right unilateral (RUL) constant-current brief-pulse (0.5– 1.0 ms) ECT (Thymatron System IV, Somatics, IL, USA) until remission (MADRS score <10 at two consecutive weekly assessments). Twenty-two non-responders were switched to bitemporal ECT. Measures of shape and surface area for thalamus, striatum, pallidum, hippocampus and amygdala were obtained from the T1-weighted images using an automated segmentation algorithm: Multiple Automatically Generated Templates Brain Segmentation (MAGeT Brain)5,6. Vertex-wise shape and surface area measures were analyzed using linear mixed models (LMM) testing local shape/displacement by time-point controlling for age, gender and study site. Time-point was modelled as a factor and site was included as a random (grouping) variable in all models. Separate LMMs were used to investigate the effect of electrode placement (RUL v BL), number of ECTs and change in MADRS score (mood improvement) on subcortical and MTL GM. All analyses were corrected for multiple comparisons using false discovery rate (FDR) thresholded at 5%. q-values are reported.Results
We detected widespread changes in both surface area and displacement one week following the final ECT treatment, characterised primarily by increases in surface area and displacement towards the lateral ventricles. The most pronounced effects were observed in the right hemisphere, ipsilateral to the stimulation side. The hippocampus showed both surface area increases, in the medial head and body, and surface area decreases laterally and inferiorly, but no displacements. The greatest surface area changes were detected in the amygdala, bilaterally, whereas the most pronounced displacement was observed in the basal ganglia and thalamus in the right hemisphere. There was a significant effect of electrode placement on subcortical GM, with bilateral electrode placement associated with greater volume increases in the left hippocampus, the amygdala bilaterally, and the left thalamus. There was also a significant effect of the number of ECTs on subcortical GM, with an increase in the number of treatments being associated with greater surface area increases in the right hippocampus and bilateral amygdalae. There was no significant association between any structural change and change in MADRS score. There were no significant structural changes present in the subsample of 23 patients 6 months post-ECT.Discussion / Conclusion
This study replicates previous findings suggesting relatively transient GM increases associated with ECT7 and that the degree of increase appears related to the ECT stimulus. In contrast to another shape analysis of the basal ganglia2, although we found surface area increases in the caudate, this was not associated with mood improvement in our study. Notably, in our previous work including data from the present study3, we found the increase in caudate GM was associated with improvement in psychomotor function, suggesting basal ganglia structural change could underlie a non-antidepressant therapeutic mechanism of ECT. One of the most striking findings was the increase in right thalamus surface area and its pronounced displacement in the stimulated hemisphere. Whilst its proximity to the lateral and third ventricles allows such physical displacement, the origin of the GM increase and its role in ECT neurobiology is unclear. Previous research has reported acute thalamic blood flow changes following ECT8, and altered resting-state functional connectivity in thalamic networks has been reported 2-4 weeks after ECT9, suggesting the role of the thalamus in ECT neurobiology may be a fruitful avenue of further investigation.Acknowledgements
No acknowledgement found.References
1. Wilkinson, S. et al., (2017) Hippocampal Volume Changes Following Electroconvulsive Therapy: A Systematic Review and Meta-analysis, Biological Psychiatry: Cognitive Neuroscience and Neuroimaging, 2, (4), 327-335 2. Wade, B.S et al., (2016) Effect of Electroconvulsive Therapy on Striatal Morphometry in Major Depressive Disorder, Neuropsychopharmacology, 41(10), 2481-91 3. Bouckaert , F. et al., (2016) Grey matter volume increase following electroconvulsive therapy in patients with late life depression: a longitudinal MRI study. Journal of Psychiatry and Neuroscience 41(2):105-14. 4. Bouckaert, F. et al., (2016) Relationship Between Hippocampal Volume, Serum BDNF, and Depression Severity Following Electroconvulsive Therapy in Late-Life Depression. Neuropsychopharmacology 41, 2741-2748 5. Chakravarty MM et al., (2013). Performing label-fusion-based segmentation using multiple automatically generated templates. Human Brain Mapping 34, 2635–2654. 6. Pipitone J, et al., (2014) Multi-atlas segmentation of the whole hippocampus and subfields using multiple automatically generated templates. Neuroimage.101,494-512 7. Nordanskog et al., (2014) Hippocampal volume in relation to clinical and cognitive outcome after electroconvulsive therapy in depression. Acta Psychiatrica Scandanavica. 129, 303–311 8. Takano, H et al., (2006) Changes in regional cerebral blood flow during acute electroconvulsive therapy in patients with depression. The British Journal of Psychiatry, 190 (1) 63-68 9. Leaver, A.M et al., (2017) Modulation of intrinsic brain activity by electroconvulsive therapy in major depression. Biological psychiatry : cognitive neuroscience and neuroimaging, 1(1), 77-86.Figures
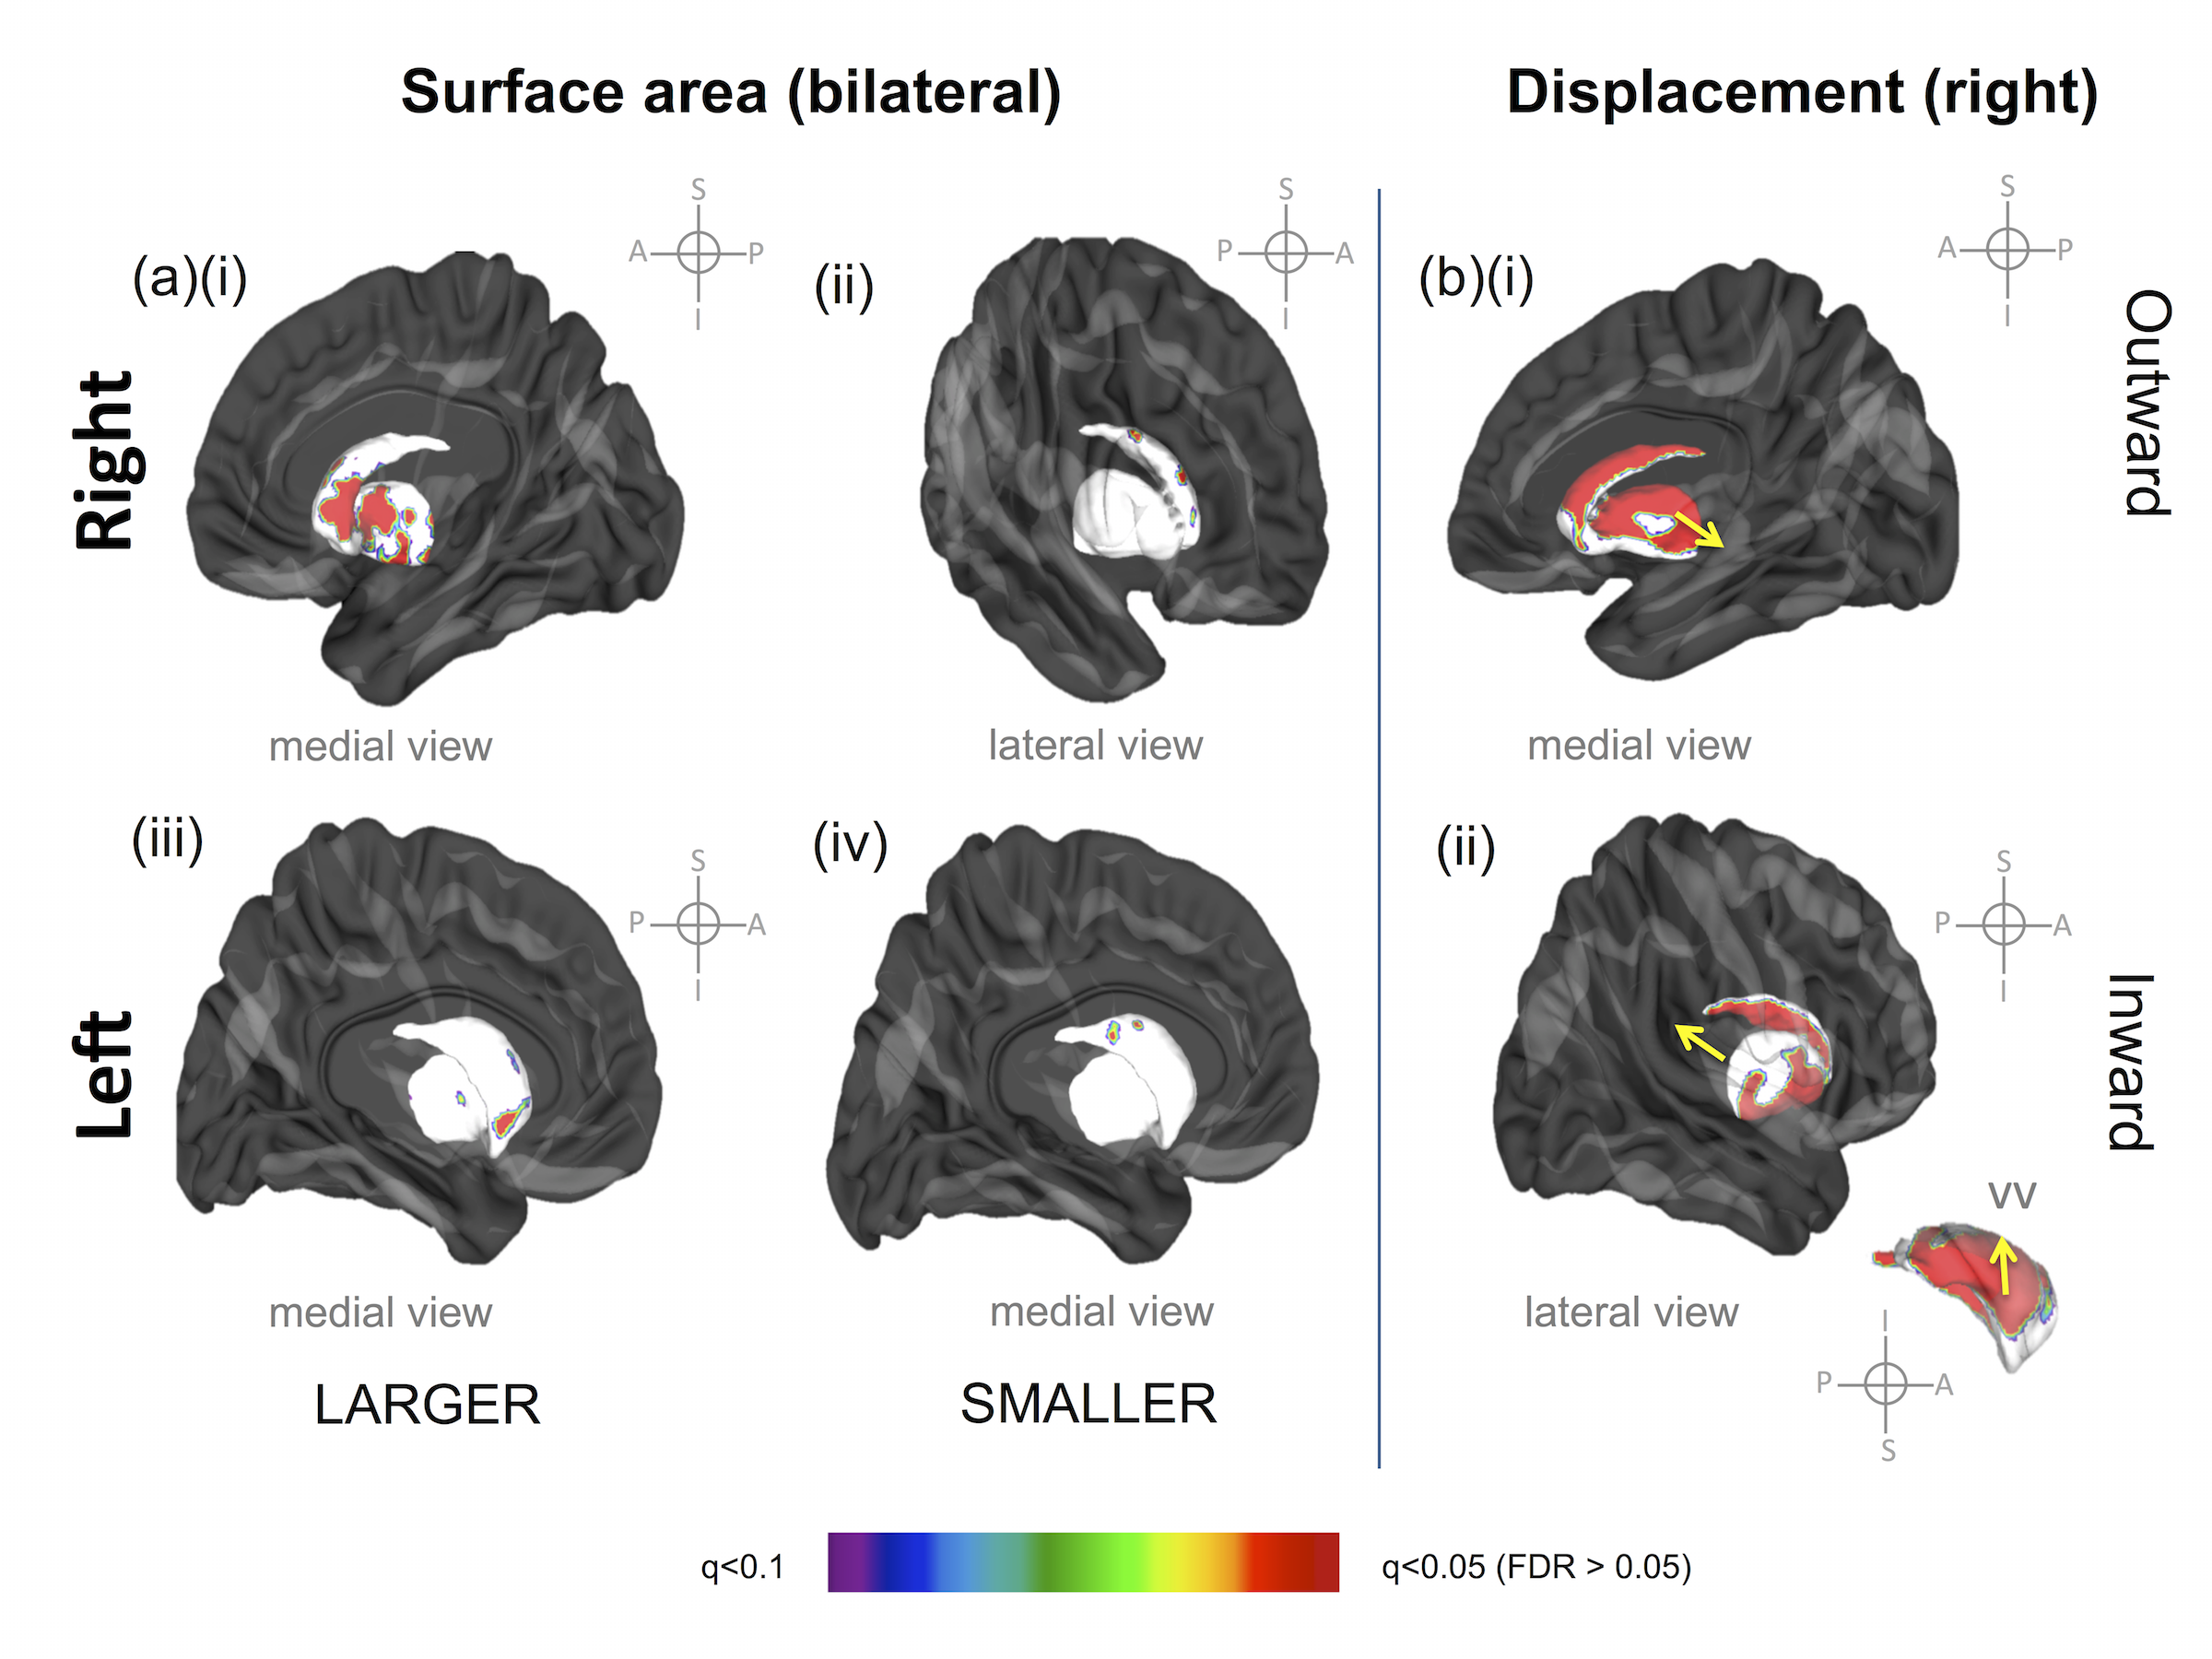
Regions of statistically significant change in striatum
surface area and displacement one week after the final ECT treatment (pFDR
>0.05). (a) right striatal surface area
(i) increase, medial view and (ii) decrease, lateral view (iii) left
striatal surface area increase, medial view and (iv) decrease, medial view (b)(i)
regional positive, outward displacement of the striatum, medial view, and (ii)
regional, negative, inward displacement, lateral and ventral views.
Abbreviations: vv = ventral view
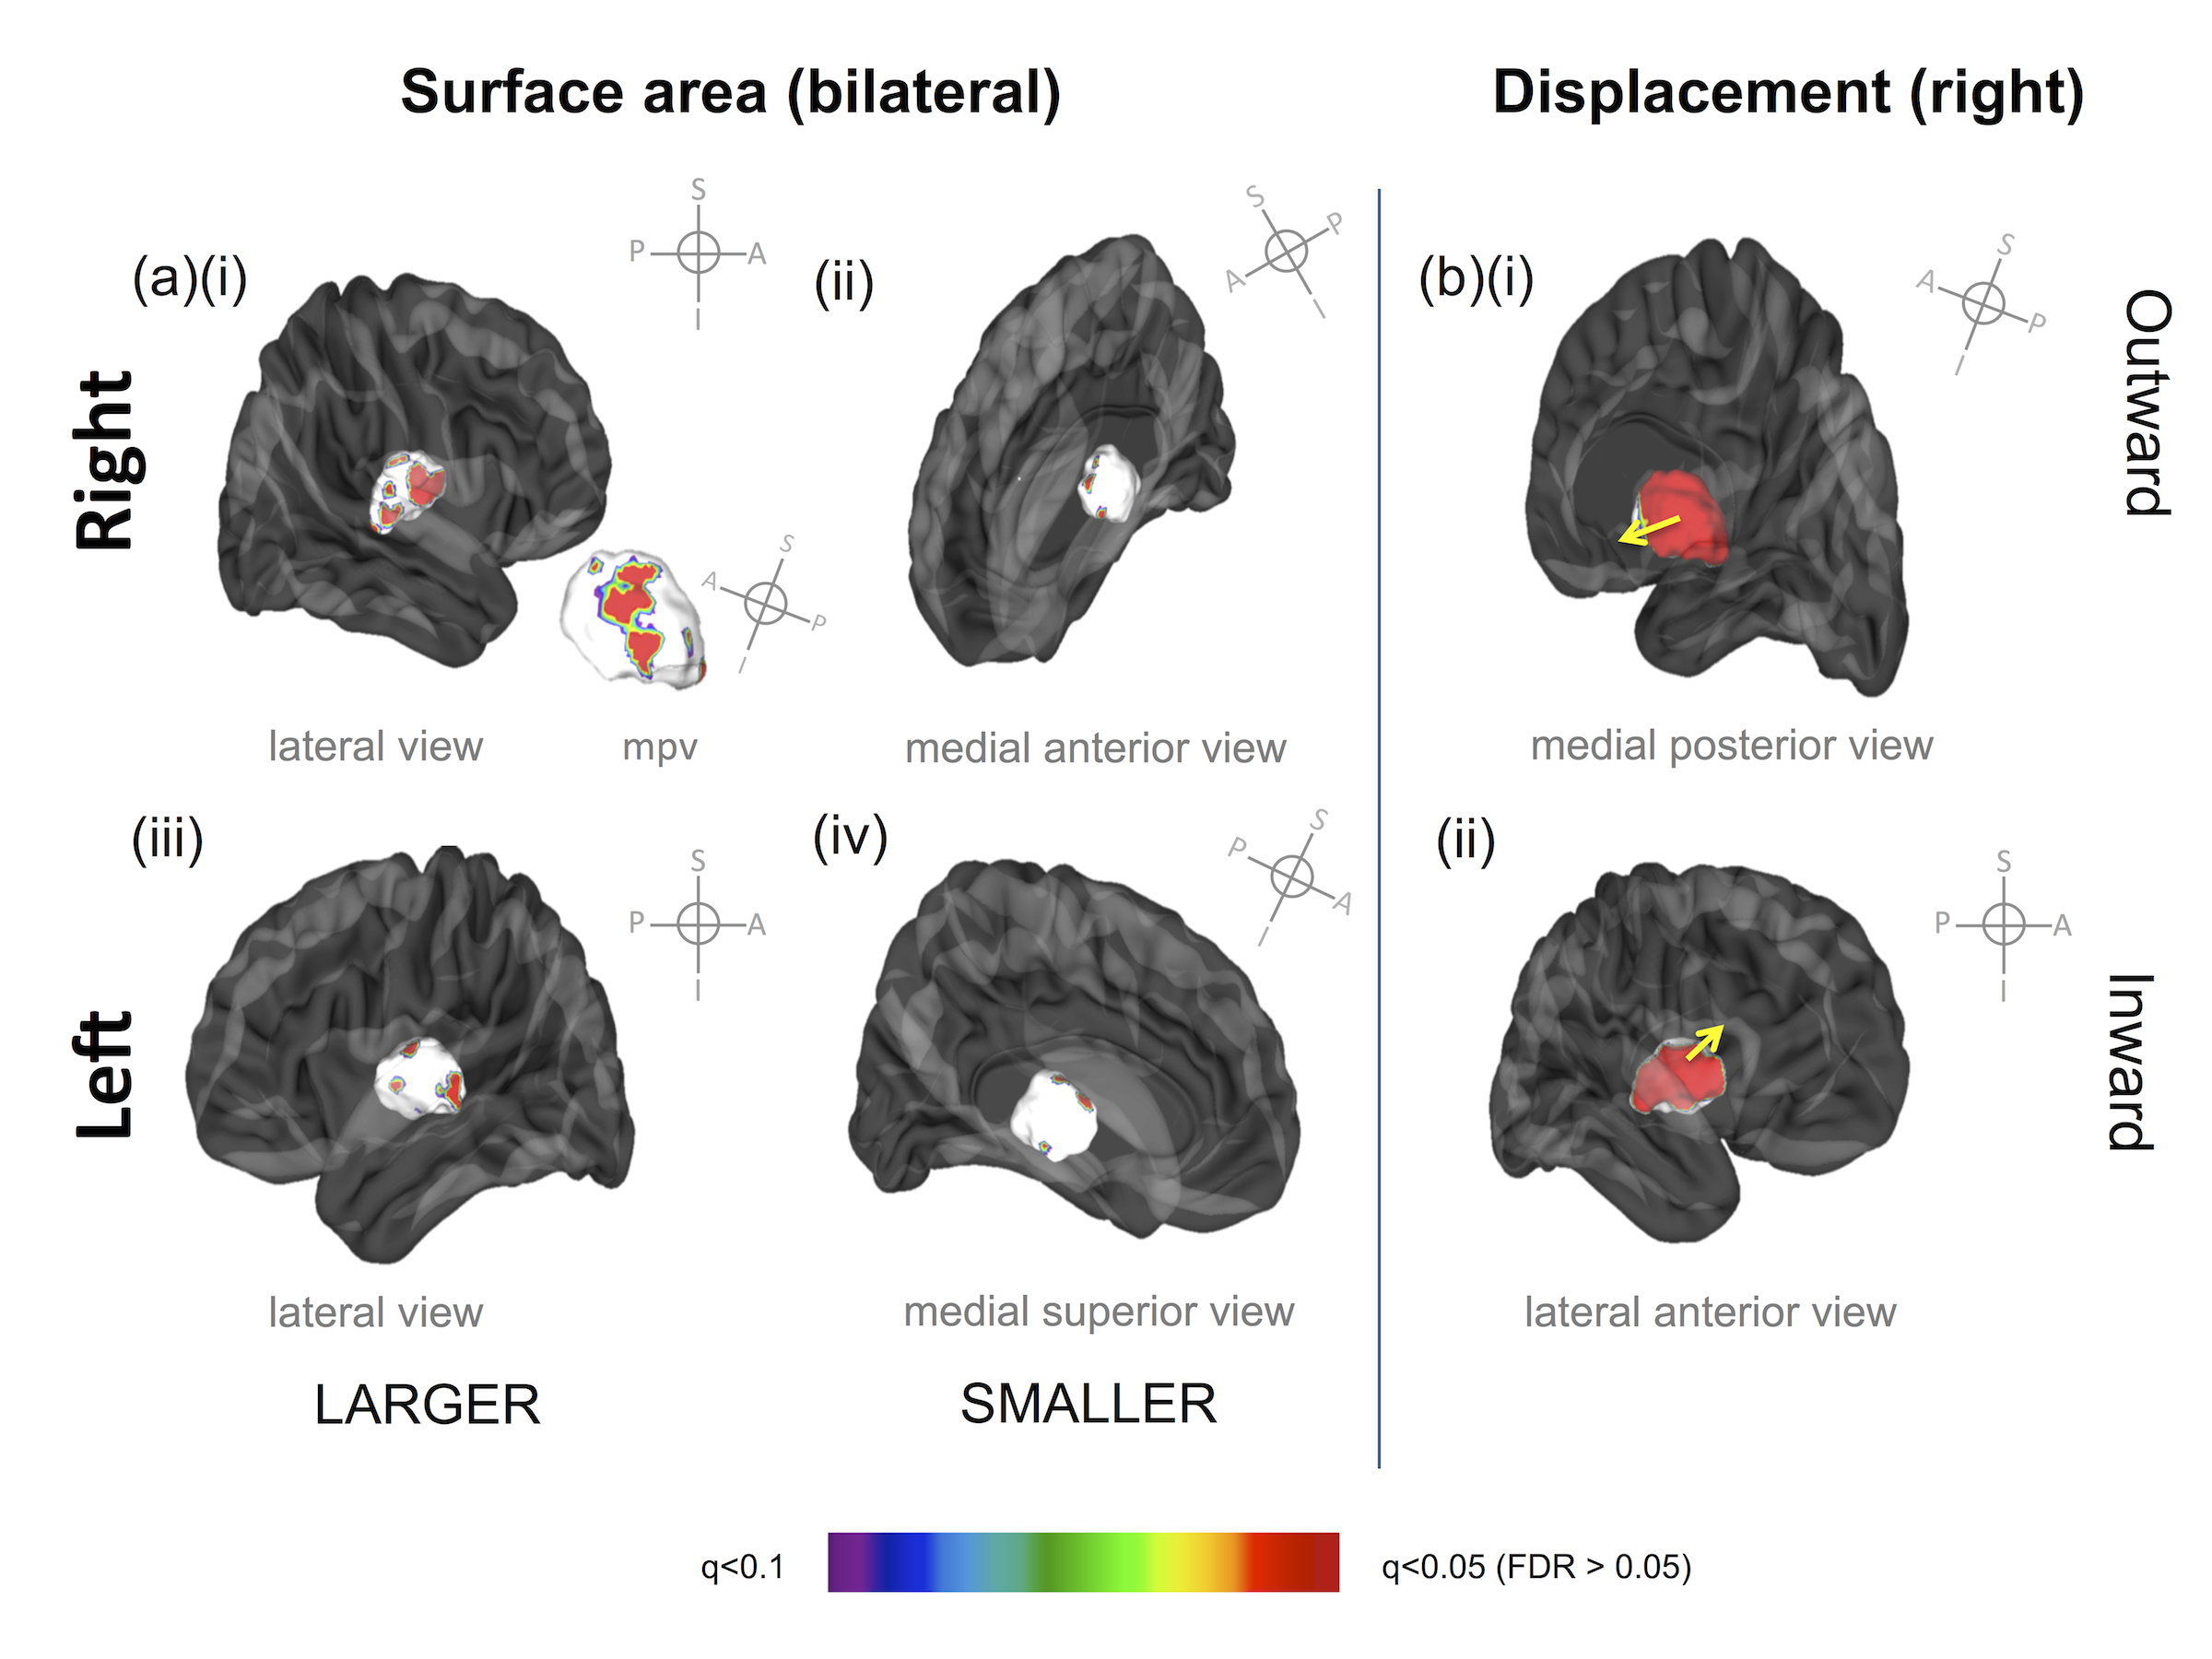
Regions of statistically
significant change in thalamus surface area and displacement one week after the
final ECT treatment (pFDR >0.05). (a) right thalamus surface area (i) increase, lateral and medial posterior
views and (ii) decrease, medial anterior view (iii) left thalamus surface area
increase, lateral view and (iv) decrease, medial superior view (b)(i) regional
positive, outward displacement of the thalamus, medial view, and (ii) regional,
negative, inward displacement, lateral and ventral views. Abbreviations: mpv =
medial posterior view
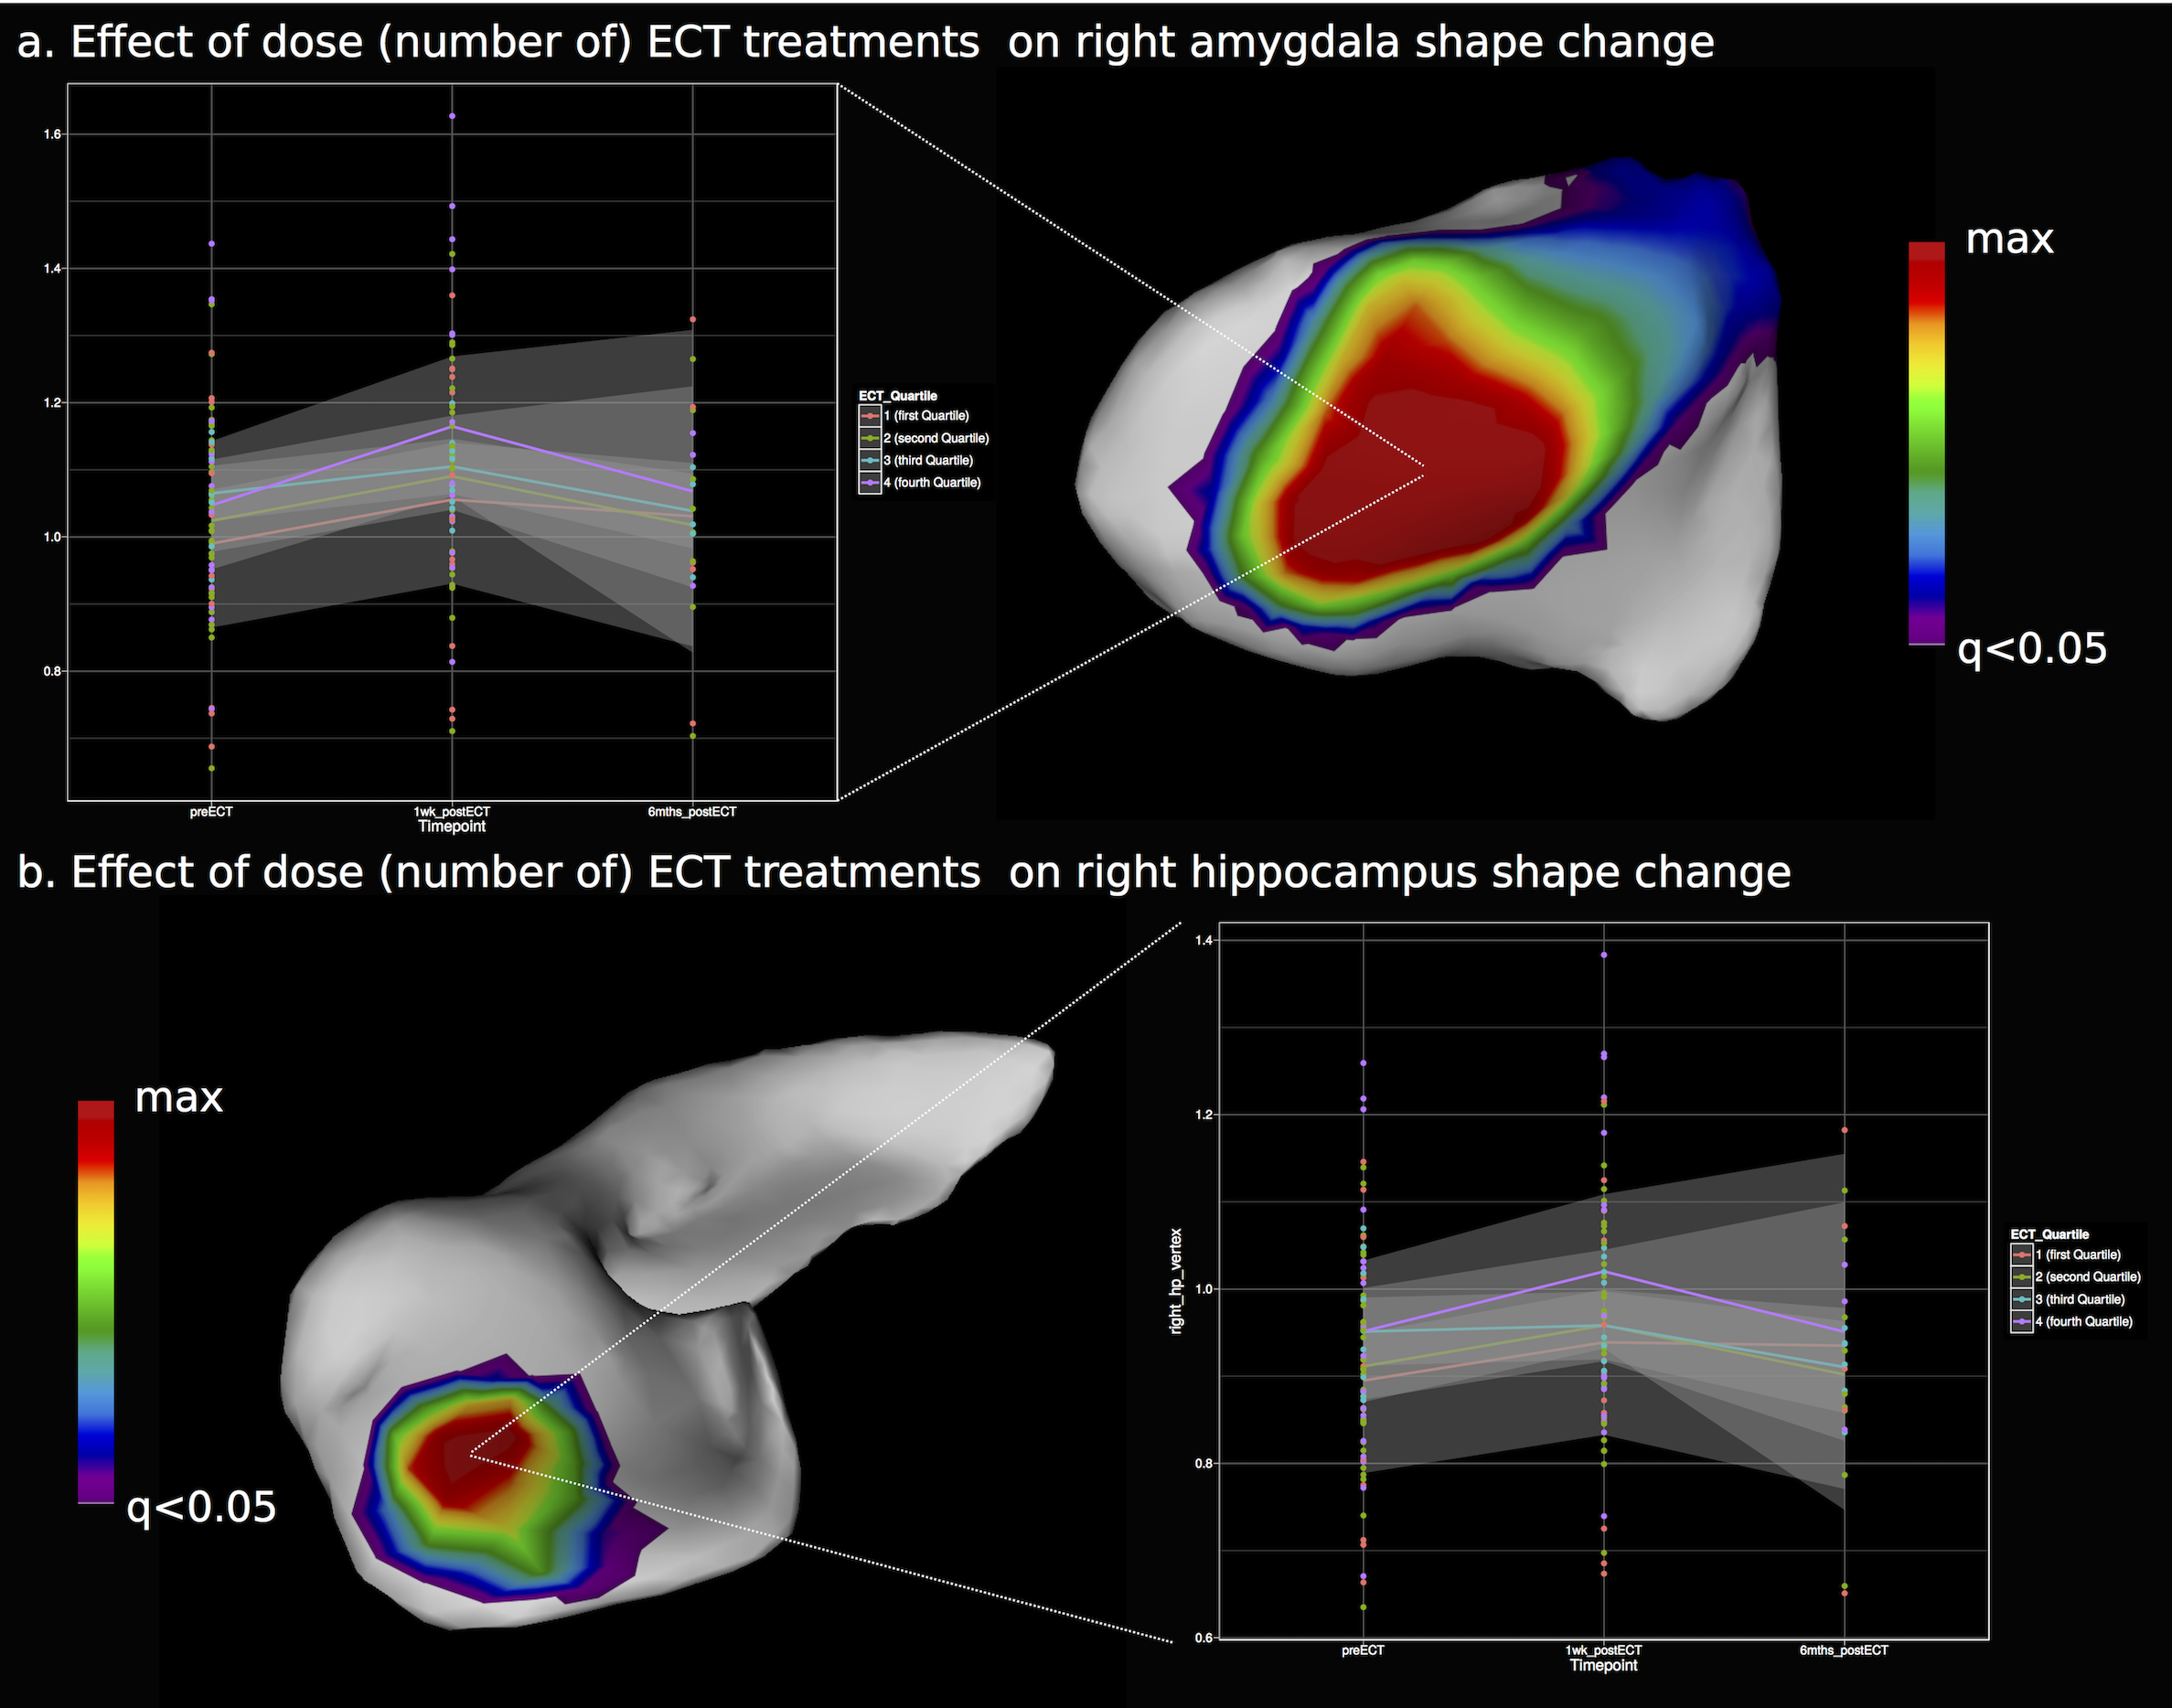
The effect of ECT dose on (a) amygdala
and (b) hippocampal surface area. Lines depict the location of the plotted
vertex.