5296
Brain Metabolism in Schizophrenia and First-Degree Relatives: a 7T MRS study1Department of Radiology and Radiological Science, Johns Hopkins University School of Medicine, Baltimore, MD, United States, 2Kennedy Krieger Institute, Baltimore, MD, United States, 3Maryland Psychiatric Research Center, Department of Psychiatry, University of Maryland School of Medicine, Baltimore, MD, United States
Synopsis
Brain metabolism was investigated in 38 patients with schizophrenia (SZ), 38 healthy control (HC) subjects, and 11 first degree relatives of SZ patients using 7T MRS in 5 brain regions. Multiple metabolic abnormalities were found in SZ patients, including increases in the ratio of glutamine to glutamate, increased levels of brain lactate, and decreased levels of γ-aminobuytric acid (GABA) and N-acetylaspartate-glutamate (NAAG). Many of these changes also correlated with measures of cognitive performance and negative symptom severity. 7T MRS is an excellent tool for the non-invasive investigation of brain pathophysiology in SZ.
Purpose
Methods
Results
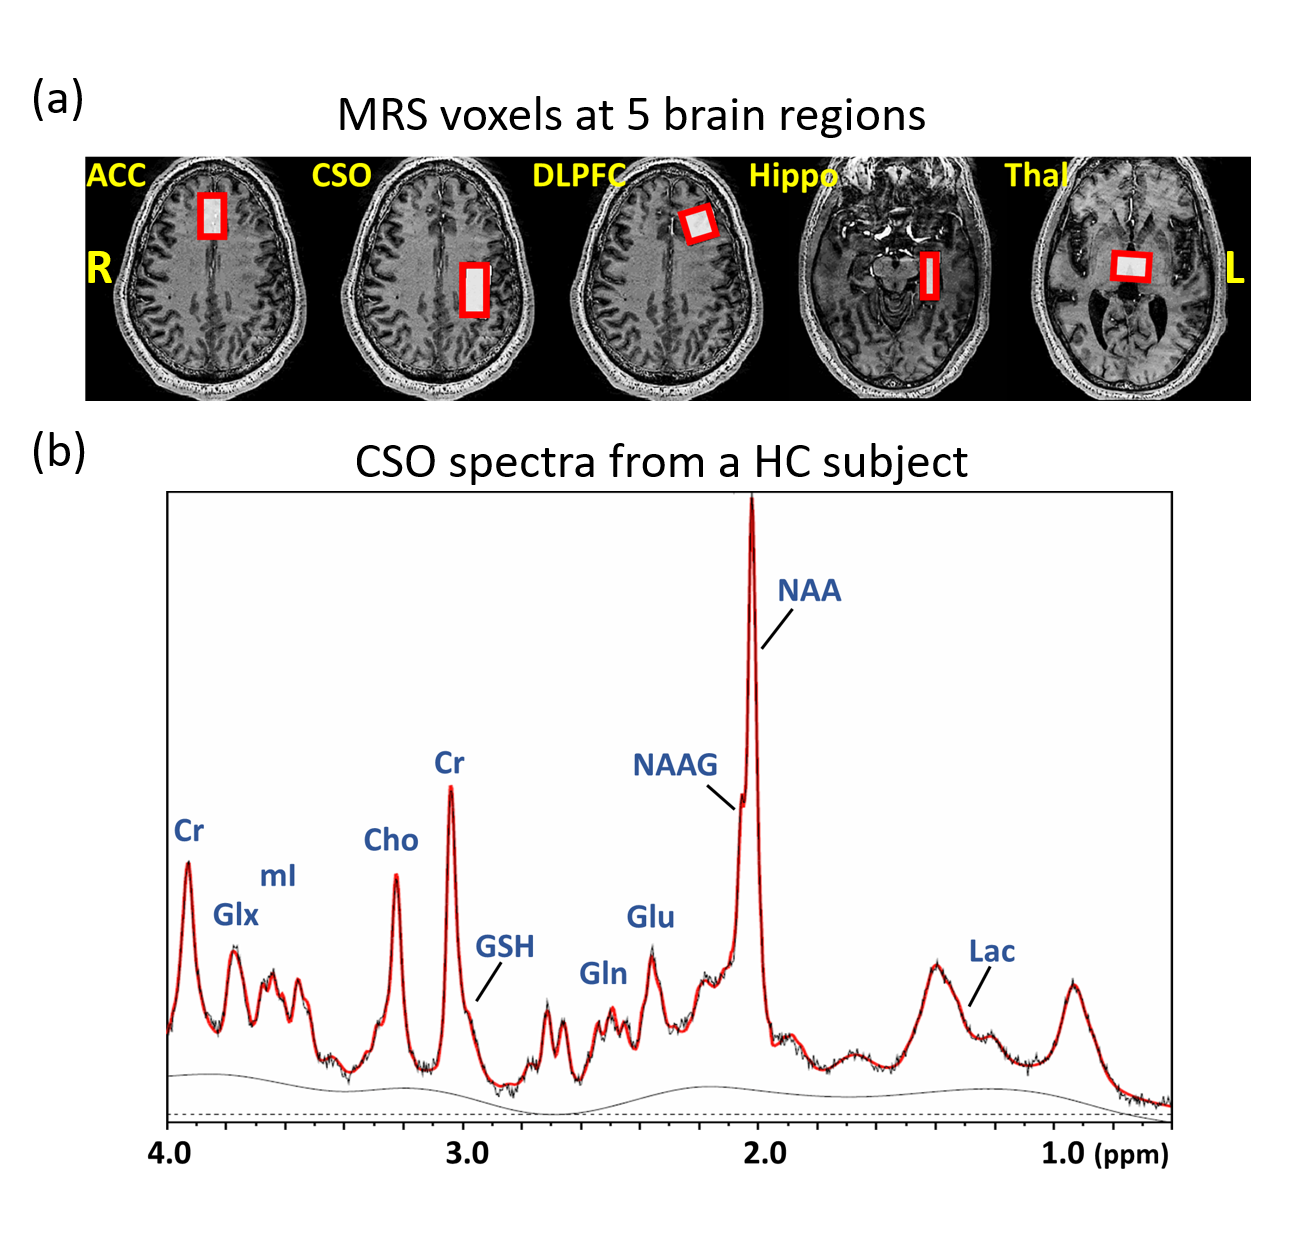
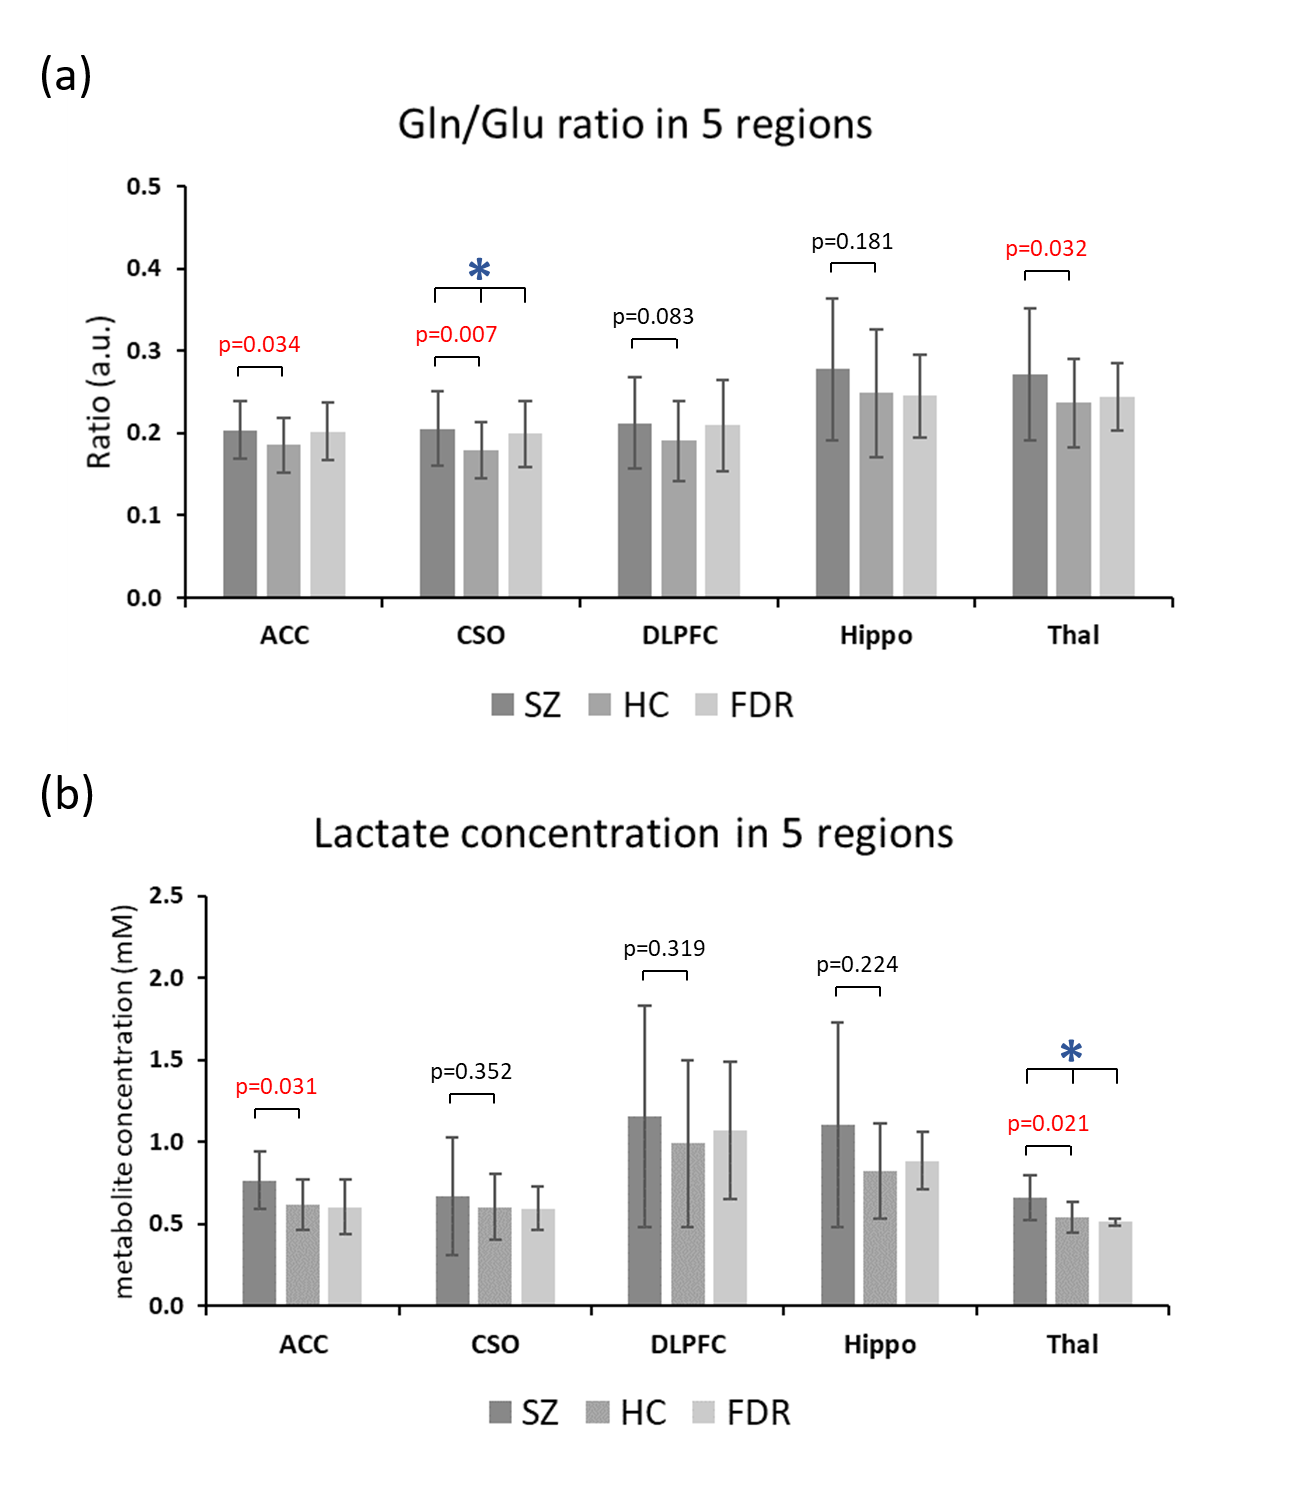
Figure 1 presents the T1W images from a HC subject with the voxel localization in five brain regions and a representative spectrum from the CSO with LCModel fit. Significant inter-group differences were found for the concentrations of GABA in Hippo (p=0.032), Lac in Thal (p=0.019) and the Gln/Glu ratio in CSO (p=0.021). Comparing the SZ to HC group, the Gln/Glu ratio was significantly increased in ACC, CSO and Thal, and Lac concentration was increased in ACC and Thal (Figure 2). The concentrations of NAAG in CSO (p=0.038) and GABA in Hippo (p=0.009) were significantly decreased.
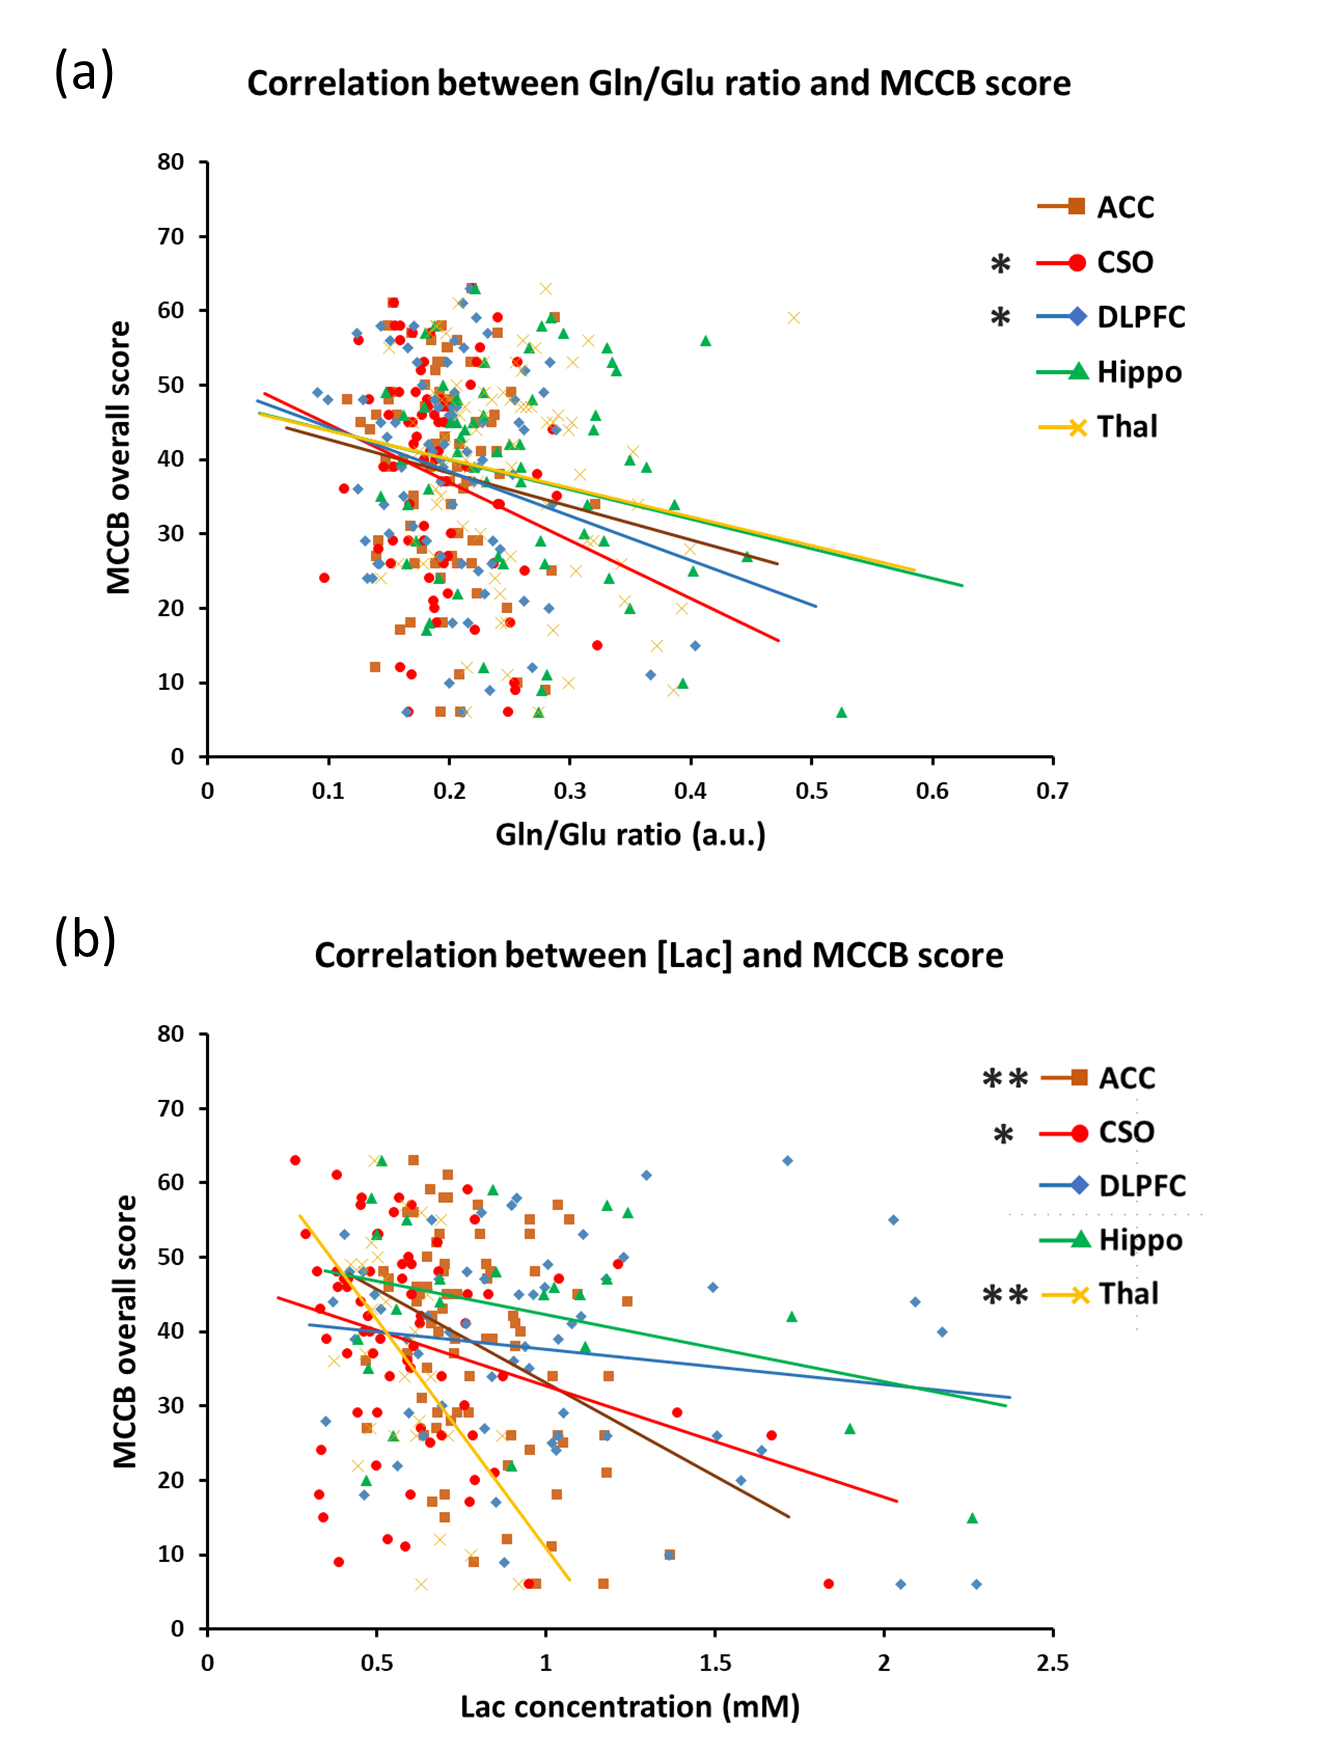
In all subjects, the Gln/Glu ratio was significantly negatively correlated with MCCB scores in the CSO and DLPFC. Lac concentrations were significantly negatively correlated with MCCB scores in ACC, CSO and Thal (Figure 3). The concentrations of NAA in ACC, DLPFC and Thal, and GABA in Hippo, were all significantly positively correlated with MCCB scores. In SZ patients, GABA and NAA concentrations in ACC were significantly negatively correlated with SANS scores.
Discussion
The widespread increase in the Gln/Glu ratio in SZ suggests increased Gln synthesis in patients with SZ, but could also reflect abnormal Gln/Glu cycling. Moreover, the negative correlation between Gln/Glu ratios and MCCB scores suggests that Gln/Glu cycling is linked with the cognitive function. Along with the finding of GABA and NAAG concentration decrease in SZ, the study echoes the previous theories of SZ, which predicts the dysfunction of both glutamatergic and GABAergic systems (5, 6). Lactate levels were also increased in two of five of the brain regions studied, and correlated negatively with MCCB scores, suggesting that anaerobic glycolysis (perhaps secondary to mitochondrial dysfunction (7)) is associated with SZ and related to cognitive performance.
Conclusion
This study revealed multiple metabolic alterations in SZ patients, most notably increased Gln/Glu ratios and increased levels of lactate. The underlying mechanisms for these changes remain to be determined. Nevertheless, 7T MRS is a valuable tool for the non-invasive investigation of brain metabolism and pathophysiology in patients with SZ.Acknowledgements
The authors acknowledge the funding support from NIH grant: R01 MH096263.References
1. Lisman JE, Coyle JT, Green RW, Javitt DC, Benes FM, Heckers S, et al. Circuit-based framework for understanding neurotransmitter and risk gene interactions in schizophrenia. Trends Neurosci. 2008;31(5):234-42.
2. Merritt K, Egerton A, Kempton MJ, Taylor MJ, McGuire PK. Nature of Glutamate Alterations in Schizophrenia: A Meta-analysis of Proton Magnetic Resonance Spectroscopy Studies. JAMA Psychiatry. 2016;73(7):665-74.
3. Schmiedel J, Jackson S, Schafer J, Reichmann H. Mitochondrial cytopathies. J Neurol. 2003;250(3):267-77.
4. Rowland LM, Pradhan S, Korenic S, Wijtenburg SA, Hong LE, Edden RA, et al. Elevated brain lactate in schizophrenia: a 7T magnetic resonance spectroscopy study. Translational Psychiatry. 2016;6(11): e967
5. Carlsson A, Waters N, Holm-Waters S, Tedroff J, Nilsson M, Carlsson ML. Interactions between monoamines, glutamate, and GABA in schizophrenia: new evidence. Annu Rev Pharmacol Toxicol. 2001;41(1):237-60.
6. Kantrowitz JT, Javitt DC. N-methyl-d-aspartate (NMDA) receptor dysfunction or dysregulation: the final common pathway on the road to schizophrenia? Brain Res Bull. 2010;83(3-4):108-21.
Figures