5294
Relationship of spinal cord volume, total and regional brain volumes to disability in a large cohort of multiple sclerosis patients1Department of Neurology and Center of Clinical Neuroscience, 1st Faculty of Medicine, Charles University and General University Hospital, Prague, Czech Republic, 2Department of Radiology, 1st Faculty of Medicine, Charles University and General University Hospital, Prague, Czech Republic, 3Department of Statistics and Probability, University of Economics, Prague, Czech Republic, 4Advanced Clinical Imaging Technology, Siemens Healthcare AG, Lausanne, Switzerland, 5Department of Radiology, University Hospital Lausanne (CHUV), Lausanne, Switzerland, 6Signal Processing Laboratory (LTS 5), École Polytechnique Fédérale de Lausanne (EPFL), Lausanne, Switzerland
Synopsis
Identification of MRI biomarkers that predict permanent neurological disability in multiple sclerosis is crucial for assigning patients to correct treatment and for appropriate recruitment of patients for clinical trials. A variety of brain structures and spinal cord have been investigated; however, neither a single structure nor combinations of structures have been routinely used as stable, specific and sensitive biomarkers. Small sample sizes, different MR protocols and segmentation approaches across studies may hamper the identification of such a biomarker. We evaluated global and regional brain volumes and cervical spinal cord volume in a large single-center cohort of multiple sclerosis patients.
Introduction
Despite its low pathological sensitivity, conventional MRI is a main paraclinical method that allows assessment of brain and spinal cord (SC) lesion load and atrophy in MS. Previous work measuring total brain volume (TBV), regional brain volumes and spinal cord volume (SCV) demonstrated association between atrophy in these regions and clinical disability. However, the strength of correlations varies across different patient cohorts and segmentation methods and there is no single volumetric biomarker that fully explains variability in MS disability1. Robust combinations of brain and possibly SC volume measurements have to be identified to better understand the clinically relevant pathology. Therefore, we investigated the relationship between TBV, regional brain volumes and SCV in a large cohort of MS patients.Methods
The
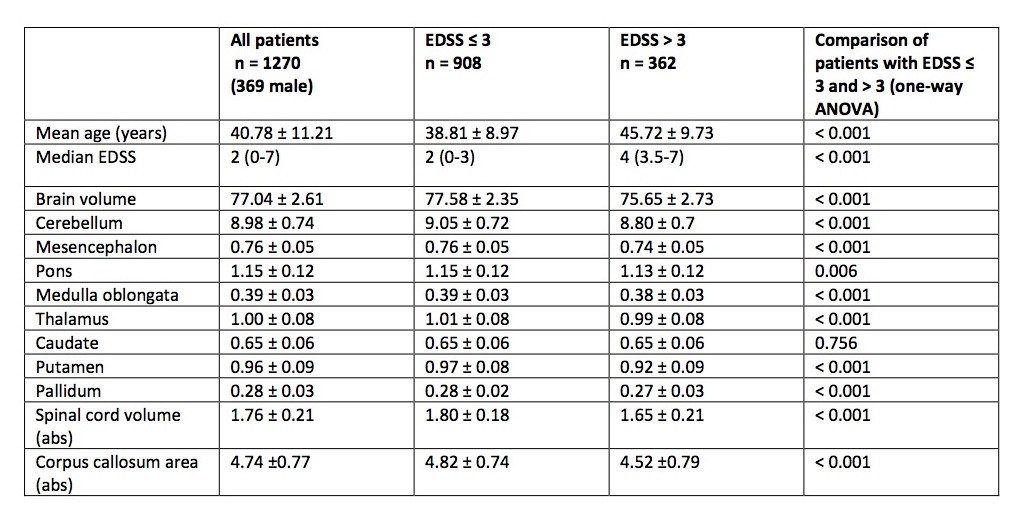
demographics and MR parameters of 1270 MS patients are shown in Table
1 (901 women, mean age 40.78±11.21
years, mean disease duration 9.62±7.71
years, median EDSS 2.0 (range 0-7)). All
patients were scanned at 3T scanner (MAGNETOM Skyra, Siemens
Healthcare, Erlangen, Germany). The MR protocol included
3D-T2WI-Fat-Sat sequence in transversal plane for SCV and MPRAGE
sequence for TBV and regional brain volumes. TBV and regional brain
volumes were estimated using the MorphoBox prototype2. SCV is
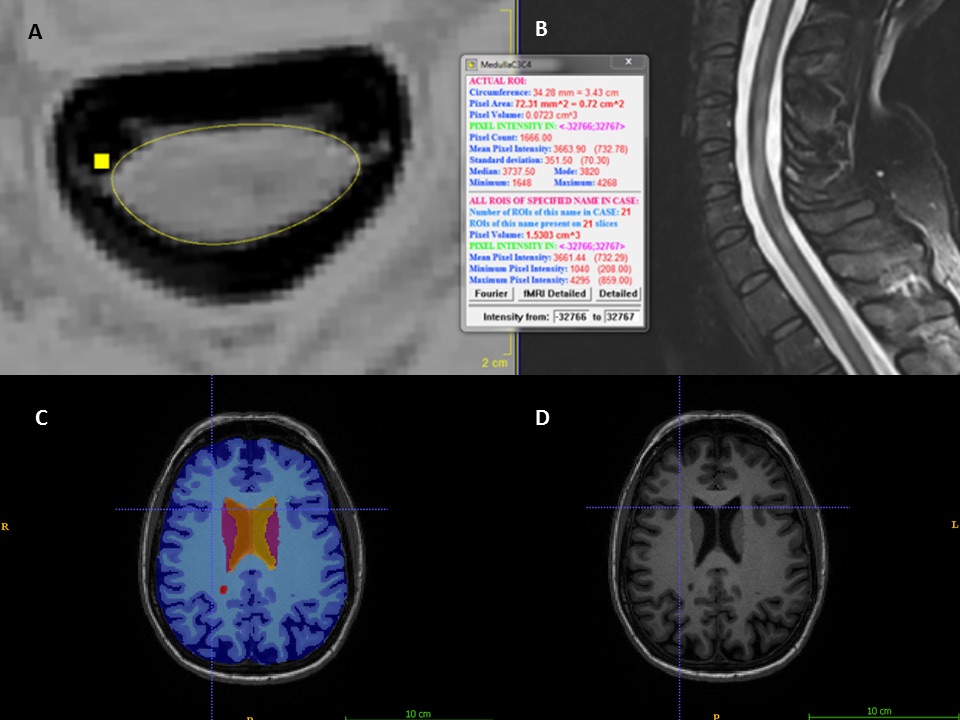
measured semi-automatically with in-house developed software3 in
21 1-mm slices centered at intervertebral disc C3/C4. First, a marker
is set manually at the level of C3-4 intervertebral disc. SC is then
manually straightened to achieve perpendicular orientation to dorsal
area of vertebral bodies C3 and C4 and a matrix is saved for further
processing. The manual step requires approximately 2 minutes/SC. The
second step is fully automatized applying a set of filters applied to
achieve best possible contrast and to approximate a cubic spine
function that best represents the border of spinal cord. Finally, SCV
is calculated in 10+10 slices cranially respectively caudally from
“middle slice” that was set at the C3/C4 marker. Figure 1 illustrates an example of spinal cord and brain segmentation in a female MS patient.
We investigated the association among regional brain volumes (cerebellum, brainstem structures, thalamus, pallidum, putamen, caudate nucleus) and corpus callosum area, TBV and SCV, and clinical disability, represented by EDSS. Univariate correlations between brain and spinal cord volumes and EDSS were assessed using Spearman's rank correlation. The generalized (negative binomial) linear model and ordinal regression analysis were employed to investigate the dependency of EDSS on volume parameters with total intracranial volume as covariate both with and without adjustment by age, disease duration (DD) and gender.
Results and discussion:
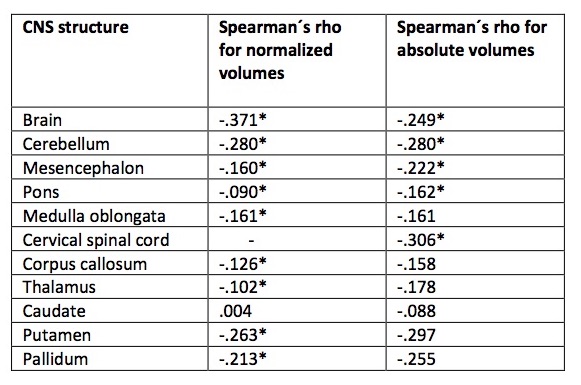
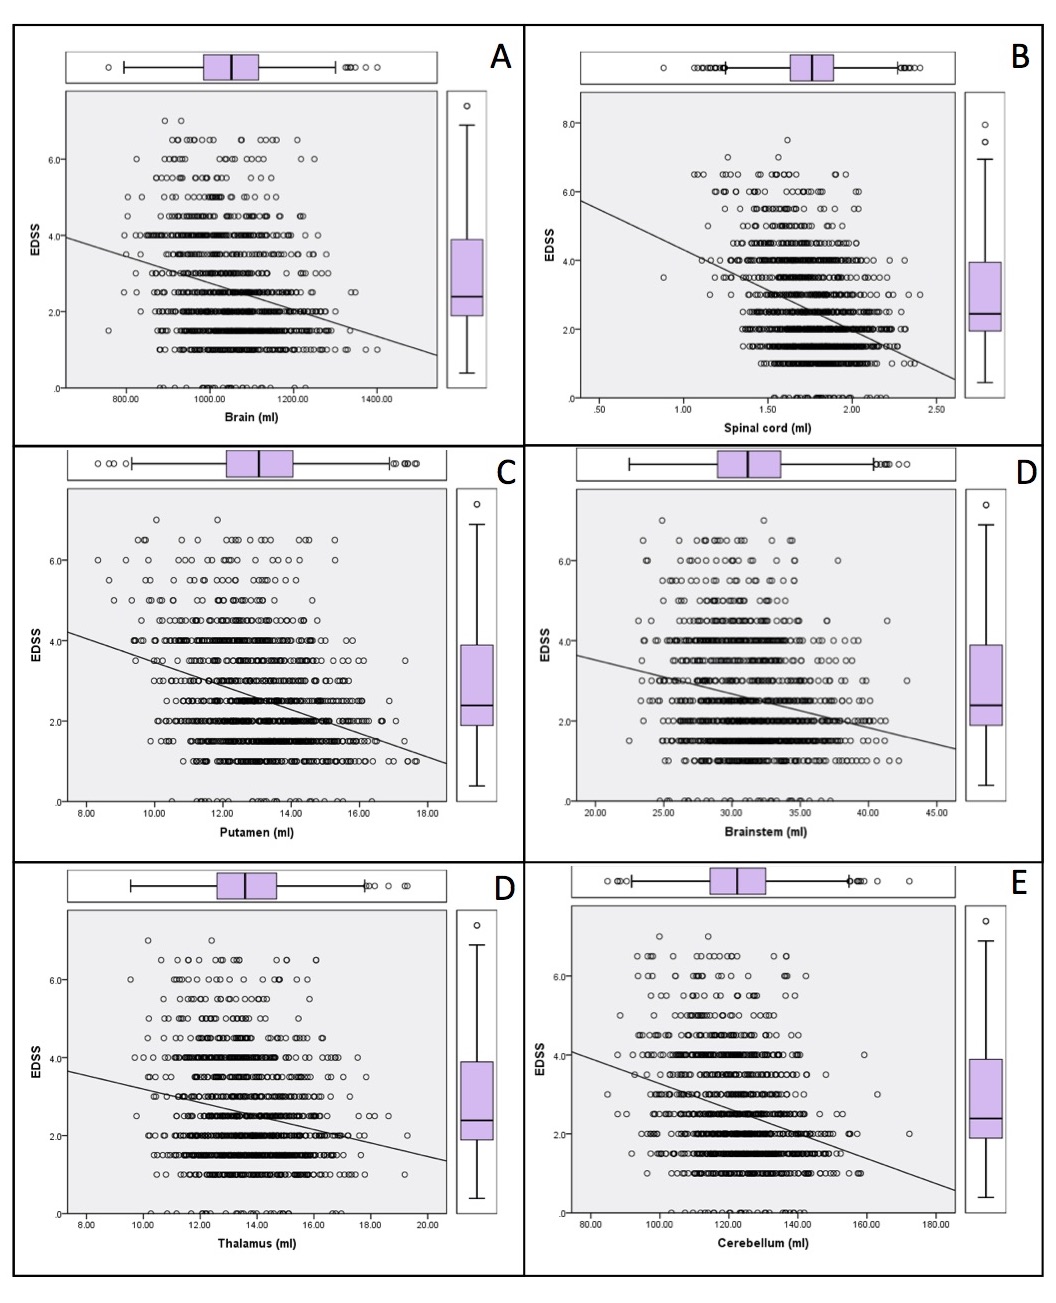
The results of the univariate correlations between particular normalized and absolute brain structures and EDSS are shown in Table 2 and Figure 2. The negative binomial linear model showed that together with gender, age and DD, SCV explained 29% of the observed EDSS variability. The relative contribution of SCV in this model was 48.7%, indicating that SCV alone explained 15% of EDSS variability. Age, gender, DD and TBV explained similar amount of EDSS variability (27%), of which TBV alone explained 17%. Among regional brain volumes, the independent contribution of putamen and cerebellum was 12% and 9% respectively (all p-values<0.001). In an ordinal regression with 3 EDSS categories (0-1.5, 2-3 and >3), SCV, TBV, and to lesser extent cerebellum, putamen and thalamus were found to be significantly associated with EDSS. Interestingly, corpus callosum as measured by MorphoBox that has been shown to be a good predictor of disability earlier4, was not associated with disability cross-sectionally in any of these models and requires further investigation.Conclusions:
SCV and TBV are able to explain clinical disability to a similar degree and are superior to regional brain volumes among which putamen and cerebellum seem to correlate best with disability. Our results indicate a feasibility of using MorphoBox for TBV and regional brain volume estimation in patients with multiple sclerosis as well as the importance of spinal cord measurement in this group of patients. Using our SCV algorithm as well as MorphoBox for longitudinal assessment in these patients is under investigation.Acknowledgements
Supported by grant RVO-VFN64165 and by the Czech Ministry of Education project Progres Q27/LF1.References
1. Kearney H, Rocca MA et al.: Magnetic resonance imaging correlates of physical disability in relapse onset multiple sclerosis of long disease duration. Mult Scler. 2014 Jan;20(1):72-80. doi: 10.1177/1352458513492245. Epub 2013 Jun 27.
2. Schmitter, D, Roche A, et al. An evaluation of volume-based morphometry for prediction of mild cognitive impairment and Alzheimer's disease. NeuroImage: Clinical 2015;7:7-17
3. Vaneckova M et al.: Spinal cord pathology and MS phenotypes – lesions, diffusion changes and spinal cord atrophy in 1036 multiple sclerosis patients. Abstract ECTRIMS Online Library. Vaneckova M. Oct 25, 2017; 199537
4. Vaneckova et al.: Corpus callosum atrophy--a simple predictor of multiple sclerosis progression: a longitudinal 9-year study. Eur Neurol. 2012;68(1):23-7. doi: 10.1159/000337683. Epub 2012 Jun 6.
Figures