5293
A fully unsupervised method for spinal cord lesion segmentation in Multiple Sclerosis1Translational Imaging Group, CMIC, Department of Medical Physics and Biomedical Engineering, University College London, London, United Kingdom, 2UCL Institute of Neurology, Dementia Research Centre, University College London, London, United Kingdom, 3Queen Square MS Centre, UCL Institute of Neurology, Faculty of Brain Sciences, University College London, London, United Kingdom, 4Department of Brain and Behavioural Sciences, University of Pavia, Pavia, Italy, 5Brain MRI 3T Research Centre, C. Mondino National Neurological Institute, Pavia, Italy
Synopsis
The presence of focal lesions in the spinal cord is an important diagnostic criteria for Multiple Sclerosis (MS). Accurate estimation of lesion volume is important for monitoring disease progression over time. However, manual and automated lesion segmentation for volume estimation remain challenging, since they rely respectively on the skills of the rater or on the automated criteria set within the algorithms. In this work, we present an adaptation to the spinal cord, of a fully unsupervised hierarchical model selection framework that automatically detects abnormality tissue patterns without any a priori knowledge on pathology location.
Introduction
Spinal cord (SC) lesions are present in most Multiple Sclerosis (MS) patients; therefore, SC MRI has been included in the diagnostic criteria of MS [1]. Recently, several algorithms have been developed to segment MS lesions in the brain [2]. However, similar approaches are not yet available for SC. Analysis of SC MRI is challenging due to the small SC dimension, the strong resolution anisotropy, the grey matter shape, subject motion and artifacts [3,4]. In this work, we present an extension of a fully unsupervised hierarchical model selection framework [5] applied to the spinal cord, that automatically detects abnormality tissue patterns in the SC without any a priori knowledge of pathology location.Methods
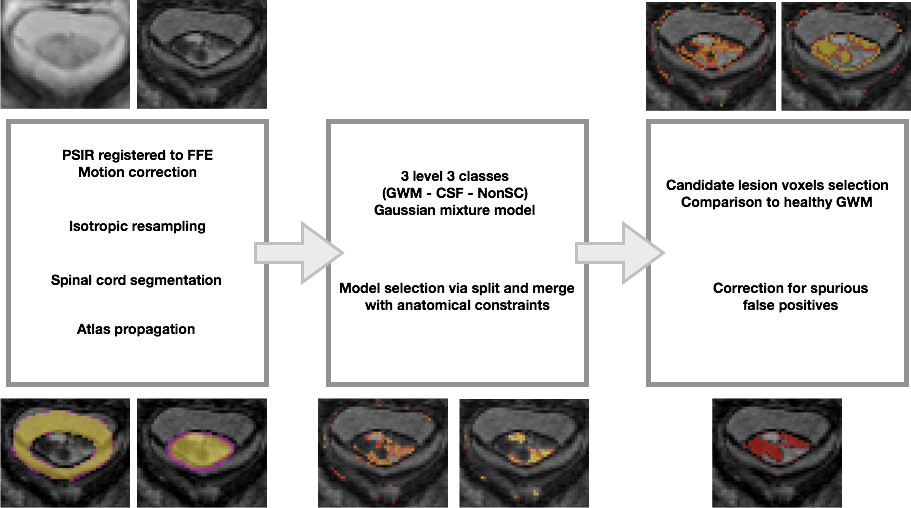
We analysed 22 patients with MS (13 females) with visible lesions in the SC, [2 clinically-isolated syndrome (CIS), 5 relapsing-remitting (RRMS), 8 secondary-progressive (SPMS) and 7 primary progressive (PPMS)] – with mean disease duration 16.5±13.1 years and median EDSS of 6.5 (range 1-7.5). All patients underwent a 3T MR scan (Philips Achieva) which included 3D-FFE and PSIR sequences [6], both acquired at a 0.5x0.5mm2 in plane resolution and 5mm slice thickness. All sequences had the center of the volume positioned at the C2-3 intervertebral disc. Lesions were manually segmented over PSIR images by a rater using JIM v6 (Xinapse Systems, UK) and binarised to provide a ground truth (GT). The proposed lesion detection preprocessing pipeline is described hereafter. First, we corrected for motion between PSIR and 3DFFE; second, we used [7] to compute a white and grey matter (WM/GM) spinal cord segmentation. Third, WM, GM and cerebrospinal fluid (CSF) priors from the PAM50 atlas [8] were propagated into the subject native space using Spinal Cord Toolbox [9]. Fourth, all volumes were isotropically resampled using the NiftyReg software package. Then, using the subject specific mask and priors, a Gaussian mixture model (GMM) with an adaptive number of components separating inliers and outliers, was obtained following a similar model as the one described in [5], with GM and WM combined in one single class to account for the limited contrast between tissues. In this probabilistic framework, models were sampled according to [5] in order to find a GMM that balanced model fit and complexity. Finally, after the model selection process had converged, a post-processing step was applied to select candidate lesion voxels according to the distribution of the healthy appearing tissue, followed by a slice-by-slice morphological correction step used to remove spurious segmentations. Figure 1 illustrates the steps of the method. To assess the performance of the proposed method, we computed median and interquartile range (IQR) for different metrics including mean surface distance in mm (MSD), Dice score coefficient (DSC), sensitivity, specificity, accuracy and volume difference (VD) expressed in percentages between the obtained segmentation and the GT in the original acquisition space.Results
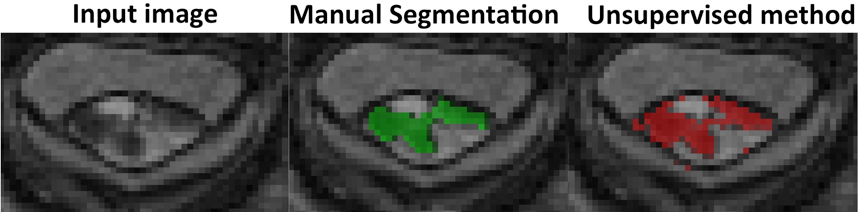
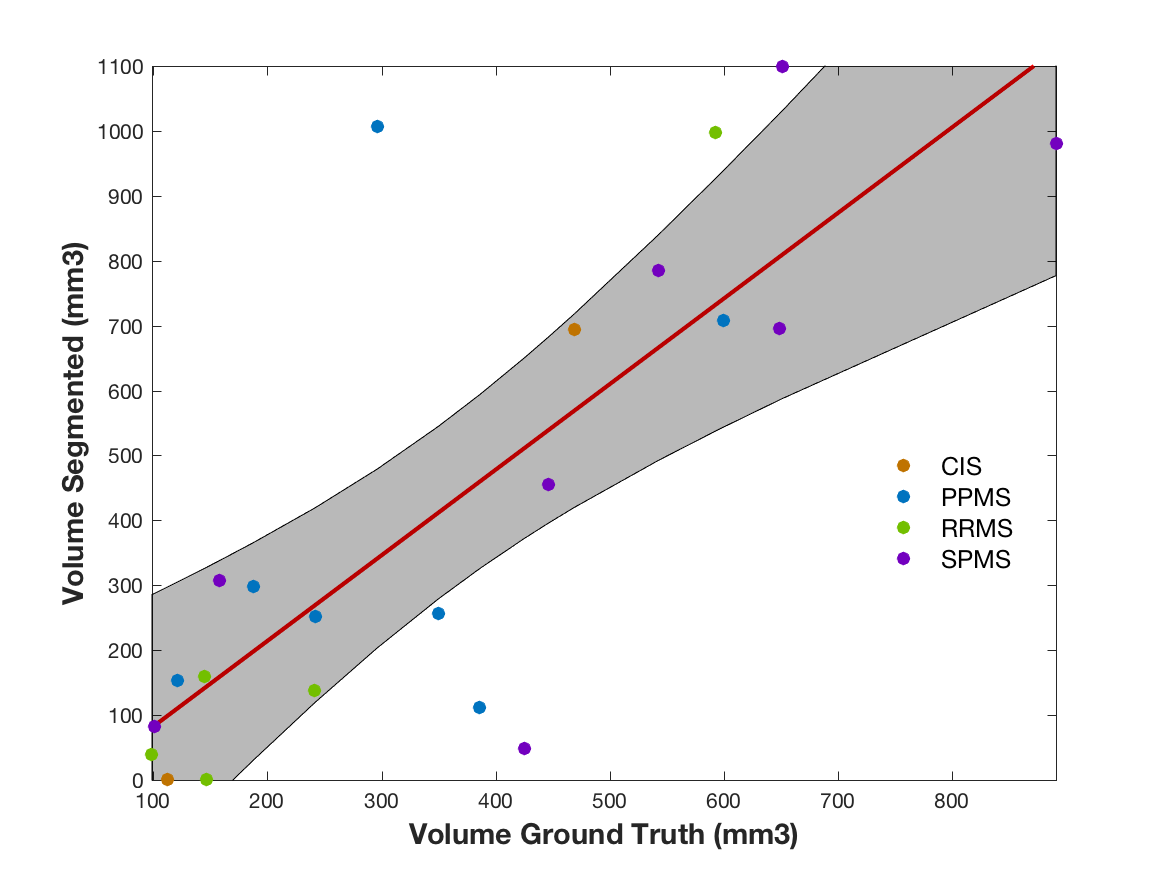
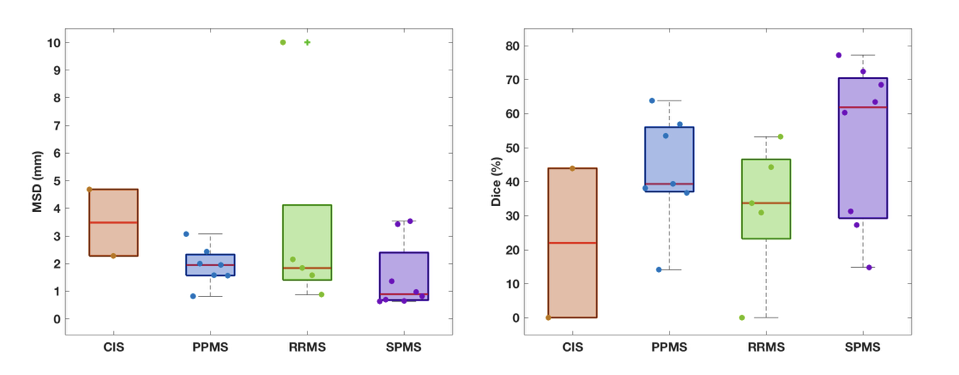
Figure 2 shows a qualitative assessment of the results. A quantitative assessment showed a 80% (p<0.05) correlation between the automated lesion volumes and the GT (see Figure 3) with a median [IQR] VD of 46.2 [17.9;71.2]. Our unsupervised method obtained a median [IQR] DSC=41.6 [30.9;60.2] and MSD of 1.70 [0.87 2.43], when we compared to GT, see Figure 4. Finally, we also observed a median [IQR] sensitivity of 0.50 [0.25;0.71], specificity of 99.99 [99.99;100.0] and accuracy of 99.99 [99.98;100.0], all in percentages.Discussion
The qualitative assessment of the results highlighted the good performance of the proposed method (Figure 2). Nonetheless, we observed a few spurious voxels in the spinal cord rim, and quantitative results suggested that disagreement between ground truth and automated methods occurred at the lesion borders. The volumes were found to correlate with the GT (p<0.05). Phenotypes with higher volume loads, especially SPMS (see Figure 3), resulted in better overall performance. Given the volume of lesions compared to the overall image volume, sensitivity ratios were found to be high.Conclusions
In this work, we have demonstrated the feasibility of automatically segmenting MS spinal cord lesions using a fully unsupervised approach based on a Bayesian model selection. The proposed method tends to extend lesions in the cord rim when compared to the ground truth, with volumes being highly correlated. The main advantage of this technique is that it works without any pathological a priori knowledge or training dataset, potentially making its extension to other pathologies straightforward. Future work will focus on improving the biologically plausibility of the model, computing a subject-specific CSF, WM, GM and rim mask, and test the performance of the proposed method in other neurological conditions such as SC injury and myelopathy.Acknowledgements
This project received support from NIHR BRC UCLH/UCL High Impact Initiative, EPSRC (EP/H046410/1, EP/J020990/1, EP/K005278), MRC (MR/J01107X/1), ISRT, WfL & CHNF (INSPIRED), UK MS Society and Brain Research Trust. FP is a Guarantors of Brain non-clinical Fellow.References
1. Polman, C. H., Reingold, S. C., Banwell, B., Clanet, M., Cohen, J. A., Filippi, M., Fujihara, K., Havrdova, E., Hutchinson, M., Kappos, L., Lublin, F. D., Montalban, X., O’Connor, P., Sandberg-Wollheim, M., Thompson, A. J., Waubant, E., Weinshenker, B. & Wolinsky, J. S. Diagnostic criteria for multiple sclerosis: 2010 Revisions to the McDonald criteria. Ann. Neurol. 69, 292–302 (2011).
2. Carass, A., Roy, S., Jog, A., Cuzzocreo, J. L., Magrath, E., Gherman, A., Button, J., Nguyen, J., Prados, F., Sudre, C. H., Jorge Cardoso, M., Cawley, N., Ciccarelli, O., Wheeler-Kingshott, C. A. M., Ourselin, S., Catanese, L., Deshpande, H., Maurel, P., Commowick, O., Barillot, C., Tomas-Fernandez, X., Warfield, S. K., Vaidya, S., Chunduru, A., Muthuganapathy, R., Krishnamurthi, G., Jesson, A., Arbel, T., Maier, O., Handels, H., Iheme, L. O., Unay, D., Jain, S., Sima, D. M., Smeets, D., Ghafoorian, M., Platel, B., Birenbaum, A., Greenspan, H., Bazin, P.-L., Calabresi, P. A., Crainiceanu, C. M., Ellingsen, L. M., Reich, D. S., Prince, J. L. & Pham, D. L. Longitudinal multiple sclerosis lesion segmentation: Resource and challenge. Neuroimage 148, (2017).
3. Wheeler-Kingshott, C. A., Stroman, P. W., Schwab, J. M., Bacon, M., Bosma, R., Brooks, J., Cadotte, D. W., Carlstedt, T., Ciccarelli, O., Cohen-Adad, J., Curt, A., Evangelou, N., Fehlings, M. G., Filippi, M., Kelley, B. J., Kollias, S., Mackay, A., Porro, C. A., Smith, S., Strittmatter, S. M., Summers, P., Thompson, A. J. & Tracey, I. The current state-of-the-art of spinal cord imaging: applications. Neuroimage 84, 1082–93 (2014).
4. Stroman, P. W., Wheeler-Kingshott, C., Bacon, M., Schwab, J. M., Bosma, R., Brooks, J., Cadotte, D., Carlstedt, T., Ciccarelli, O., Cohen-Adad, J., Curt, A., Evangelou, N., Fehlings, M. G., Filippi, M., Kelley, B. J., Kollias, S., Mackay, A., Porro, C. A., Smith, S., Strittmatter, S. M., Summers, P. & Tracey, I. The current state-of-the-art of spinal cord imaging: Methods. Neuroimage 84, 1070–1081 (2014).
5. Sudre, C. H., Cardoso, M. J., Bouvy, W. H., Biessels, G. J., Barnes, J. & Ourselin, S. Bayesian Model Selection for Pathological Neuroimaging Data Applied to White Matter Lesion Segmentation. IEEE Trans. Med. Imaging 34, (2015).
6. Kearney, H., Miszkiel, K. A., Yiannakas, M. C., Altmann, D. R., Ciccarelli, O. & Miller, D. H. Grey matter involvement by focal cervical spinal cord lesions is associated with progressive multiple sclerosis. Mult. Scler. J. 22, 910–920 (2016).
7. Prados, F., Cardoso, M. J., Yiannakas, M. C., Hoy, L. R., Tebaldi, E., Kearney, H., Liechti, M. D., Miller, D. H., Ciccarelli, O., Wheeler-Kingshott, C. A. M. G. & Ourselin, S. Fully automated grey and white matter spinal cord segmentation. Sci. Rep. 6, 36151 (2016).
8. De Leener, B., Fonov, V., Collins, L., Callot, V., Stikov, N. & Cohen-Adad, J. PAM50: Multimodal template of the brainstem and spinal cord compatible with the ICBM152 space. in Proc. 25th Annu. Meet. ISMRM 165, 170–179 (Academic Press, 2017).
9. De Leener, B., Lévy, S., Dupont, S. M., Fonov, V. S., Stikov, N., Louis Collins, D., Callot, V. & Cohen-Adad, J. SCT: Spinal Cord Toolbox, an open-source software for processing spinal cord MRI data. Neuroimage 145, 24–43 (2017).
Figures