5292
Assessing the Role of Cord Atrophy Toward Disease Progression in Multiple Sclerosis1NIH, Bethesda, MD, United States
Synopsis
Plot of spinal cord cross-sectional area (SCCSA) from C1 to T10 reveals distinct patterns in various multiple sclerosis subtypes. While the relapsing remitting subtype revealed thinner cord in the cervical region, progressive subtypes had thinner c- and t-spines compared to healthy subjects. SCCSA measures were related to clinical outcomes, and revealed that up to 10-15% of disability can be explained by differences in SCCSA alone. Furthermore, segregating patients based on the SCCSA seems to give a better stratification of their clinical disability. This study suggests SCCSA can be used as an outcome measure in clinical trials.
Introduction
Spinal cord atrophy contributes to disability in patients with chronic progressive myelopathies such as multiple sclerosis (MS) and its quantification may be important to fully characterize these diseases.1-6 While atrophy and thinning of the cervical cord has been extensively studied in MS,3,4 we aimed to quantify spinal cord cross-sectional area (SCCSA) along the entire length of the cord in various MS subtypes (primary progressive or PP; relapsing remitting or RR; secondary progressive or SP). Furthermore, SCCSA measurements were correlated with clinical markers of disability. Finally, the association of SCCSA measurement with disability was assessed independent of clinical classification.Methods
NIH IRB approved the study, and written, informed consent was obtained from all participants. Healthy volunteers and subjects clinically diagnosed with MS (2010 McDonald criteria) underwent MRI of the spine (3T Siemens Skyra with spine matrix coil). The MRI examination included a 3D GRE sequence at 1mm isotropic resolution of the c- and t-spine (TR=8ms, TE=3ms, FA=18º), and the images were stitched together using DICOM information during post-processing. Cross sectional area of the spinal cord from C1 to T10 was measured using a semi-automated method previously reported,5 and the plots compared across MS subtypes. Average SCCSA from levels C2-3, C4-5, and T4-10 were compared between MS subtypes, and correlated with standard clinical scores such Expanded Disability Status Scale (EDSS), Scripps neurologic rating scale (SNRS), and time to walk 25-feet (25-ft walk), as well as age and disease duration.
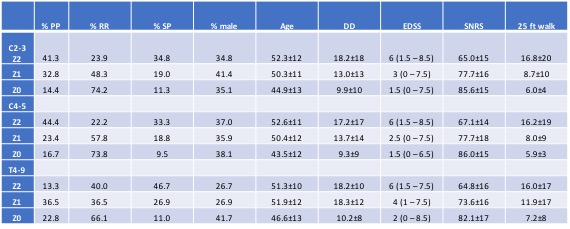
In order to assess the contribution of SCCSA to disability independent of MS subtype, Z-score of the SCCSA were obtained at the C2-C3, C4-C5, and T4-T9 levels relative to healthy controls. SCCSA from all MS subtypes were pooled in and grouped based on z-scores (Z0: with z-scores from 1 to -1; Z1: with z-scores from -1 to -2; and Z2 with z-scores less than -2).
Statistical tests used included ANOVA, post-hoc Tukey, as well as Pearson’s and Spearman’s correlation; a p<0.05 was considered to be statistically significant.
Results
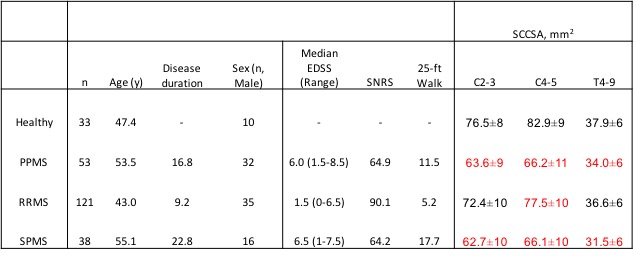
SCCSA and clinical variables were successfully measured from 213 patients with MS and 33 individuals with no known neurological disease (Table 1). Plot of SCCSA along the length of the spinal cord revealed distinct patterns, with average RRMS subgroup having thinner cord at C4-5 level, and progressive MS subtype having thinner cord along the entire cord length (Figure 1).
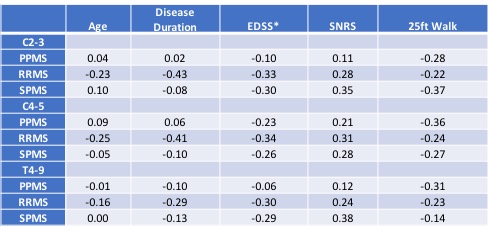
When correlated with clinical parameters (Table 2), SCCSA from RRMS subtype showed significant correlation with all clinical parameters tested (except SCCSA at T4-9 and age). In the SPMS group, SCCSA at C2-3 and T4-9 showed significant correlation with SNRS at the C2-3 and T4-9 levels. In the PPMS group, 25-ft walk was correlated with SCCSA at the C4-5 and T4-9 levels.
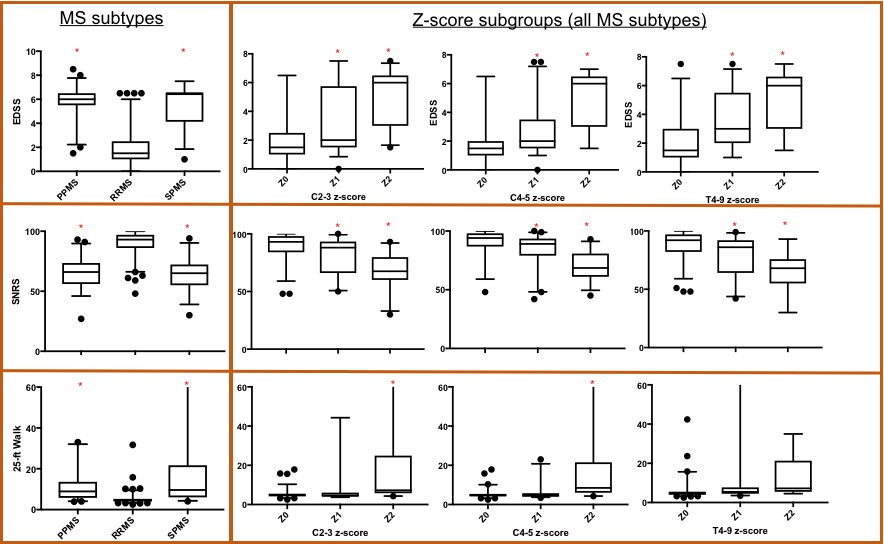
When separated by SCCSA z-scores irrespective of the MS subtype (Table 3), the Z0 group was characterized by lower age and disease duration, and lower likelihood of having progressive MS. While 79% of the RRMS subjects were in the Z0 group at any of the cord level, that was true for only 10% of the subjects with progressive forms of MS. All clinical scores compared were significantly different between the groups (ANOVA). Results of the post-hoc Tukey test are shown in Figure 2. Such grouping seemed to give a better stratification of the clinical disability in patients than classification by MS subtype alone.
Discussion and conclusion
This study demonstrate that patients clinically diagnosed with progressive forms of MS have thinner SCCSA than healthy subjects and subjects clinically classified as RRMS at all spinal cord levels examined. Furthermore, SCCSA measures were related to clinical outcomes, and revealed that up to 10-15% of disability (SNRS, 25-ft walk) can be explained by differences in SCCSA alone. These results are consistent with a number of previous reports of smaller cervical cords in MS patients. Importantly, our approach allows for measurements throughout the entire spinal cord, especially the thoracic region, which we show to be markedly atrophic in progressive forms of MS.
Finally, we attempted to segregate patients based on the SCCSA at various cord levels, irrespective of clinical MS subtype. Such classification seems to give a better stratification of clinical disability of the patient.
Studying SCCSA patterns, especially in a longitudinal setting, may help in better understanding of the pathophysiology of MS in the spinal cord. This study will be expanded to include more control subjects, longitudinal observation of SCCSA changes, and CSF immunological studies. These results suggest that SCCSA measures can be used as an outcome measure in clinical trials of natural history and disease modifying therapies.
Acknowledgements
Research Funded by the intramural Research Program at NINDS.References
1. Losseff NA, Webb SL, O'Riordan JI, et al. Spinal cord atrophy and disability in multiple sclerosis: a new reproducible and sensitive MRI method with potential to monitor disease progression. Brain 1996;119:701-708.
2. Horsfield MA, Filippi M. Spinal cord atrophy and disability in multiple sclerosis over four years. J Neurol Neurosurg Psychiatry 2003;74:1014–1015.
3. Zivadinov R, Banas AC, Yella V, Abdelrahman N, Weinstock-Guttman B, Dwyer MG. Comparison of three different methods for measurement of cervical cord atrophy in multiple sclerosis. AJNR Am J Neuroradiol 2008; 29(2): 319-25
4. Lukas C, Knol DL, Sombekke MH, et al. Cervical spinal cord volume loss is related to clinical disability progression in multiple sclerosis. J Neurol Neurosurg Psychiatry 2015; 86(4): 410-8.
5. Liu W, Nair G, Vuolo L, et al. In vivo imaging of spinal cord atrophy in neuroinflammatory diseases. Ann Neurol 2014; 76(3): 370-8.
6. Shila Azodi, Govind Nair, Yoshimi Enose-Akahata, Emily Charlip, Ashley Vellucci, Irene Cortese, Jennifer Dwyer, B. Jeanne Billioux, Chevaz Thomas, Joan Ohayon, Daniel S Reich, Steven Jacobson; Imaging Spinal Cord Atrophy in Progressive Myelopathies; Annals of Neurology (in press);
Figures