5291
Multicenter assessment of focal and diffuse cervical cord MTR abnormalities in early relapsing-remitting multiple sclerosis1Univ Rennes, Inria, CNRS, Inserm, IRISA UMR 6074, VISAGES ERL U-1228, F-35000, Rennes, France, 2Neurology department, Rennes University Hospital, Rennes, France, 3Radiology department, Rennes University hospital, Rennes, France, 4MNI, Montréal, Canada, Montreal, QC, Canada, 5CRMBM UMR7339, Aix-Marseille University, CNRS, Marseille, France, 6Montpellier University Hospital, Montpellier, France, 7APHM, La Timone Hospital, Marseille, France, 8Toulouse University Hospital, Toulouse, France, 9Strasbourg University Hospital, Strasbourg, France, 10Lyon University Hospital, Lyon, France
Synopsis
The purpose of this work was to assess the ability of magnetization transfer ratio imaging of the cervical spinal cord to capture relevant differences in the first stage of multiple sclerosis in a multicenter context. For this purpose, we analyzed the MTR values in the lesions, the whole cord and normal-appearing cord from 52 patients in the first 18 months of the disease and from 17 controls. Images were acquired in 5 centers. We showed such measurements were able to capture relevant group differences and displayed slightly higher correlations with patients clinical status than lesion volume.
Introduction
The spinal cord is a part of the central nervous system potentially relevant when studying ambulatory disability in multiple sclerosis (MS), as motor and sensitive tracts are gathered in a small structure. However, the correlation between spinal cord lesion load and disability remains modest. Magnetization transfer ratio (MTR) imaging is sensitive to tissue integrity in MS lesions and in normal-appearing tissue. More specifically, low MTR values in the cord white matter has been shown to be associated with disability-related reduction in well-established MS patients1-10. The purpose of this work is to evaluate, in a multicenter context, the ability of MTR imaging of the cervical spinal cord (SC) to capture relevant differences in the first stage of the disease.Methods
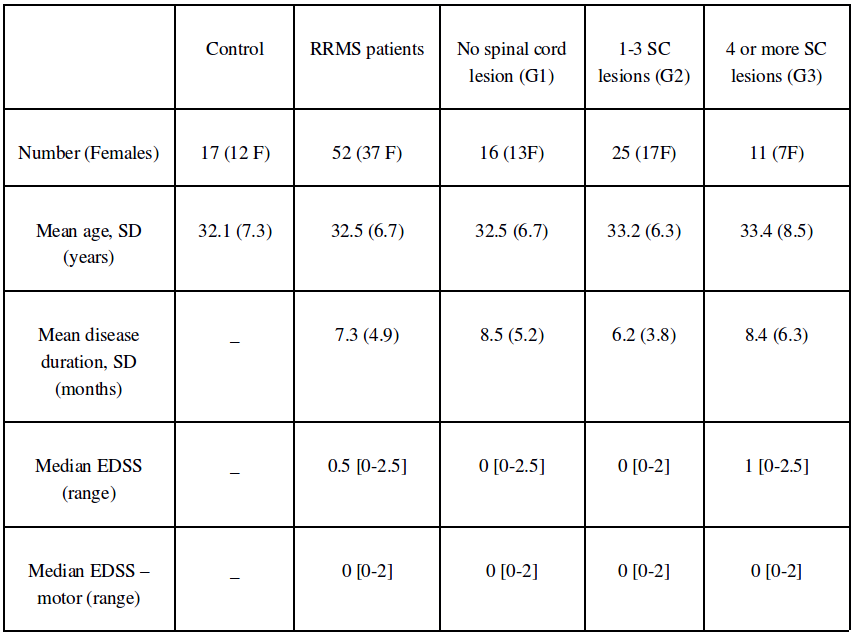
Fifty-two patients with relapsing remitting MS (disease duration < 18 months) and 17 aged-matched healthy controls were included (7 were scanned twice to investigate intra-subject reproducibility). The two first columns of Figure 1 give their demographic and clinical characteristics. Images were acquired from 3T scanners in 5 centers (three MAGNETOM Verio (VB17) and two MAGNETOM Skyra (VD13); Siemens Healthineers, Erlangen, Germany). mt0 and mt1 images were acquired perpendicular to the cord spanning from C1 to C7 with a voxel size of 0.7x0.7x3mm3 and a 3D readout. The SC and vertebral levels were automatically segmented on mt0 using the spinal cord toolbox11. Each mt1 volume was non-linearly registered to the associated mt0 using the anima toolbox12 and the MTR maps were estimated. The cervical lesions were manually labeled on axial T2*-w (0.7×0.7×3 mm3) images using sagittal PSIR (0.8×0.8×2.5 mm3) and T2 (0.9×0.7×2.5 mm3) images as additional information. T2*w images and lesion masks were non-rigidly aligned to the MTR maps12. Mean MTR values were computed in the lesions and for each vertebral level of the whole cord (WC) and of the normal-appearing cord (NASC), excluding lesions and perilesional areas. All group comparisons were corrected for center using mixed linear models. No correction for multiple comparisons was performed. Results and discussions
Control population:
Measurements along the cord were inhomogeneous, with significantly higher mean MTR values for the first three levels. From C4 to C6, the MTR mean and standard deviation were respectively 34.1and 0.9 percent units (pu) in WC13. The greatest variability was found in within-participant measurements, with a standard deviation of 0.8 pu in WC. By contrast, the between-center standard deviation was 0.5 pu, representing about 30% of overall variability, and no strong between-participant variability was detected.
Patient population and difference to controls:
Lesion count: Patients were classified in three groups according to their numbers of lesions: no lesion (group G1, n=16), 1 to 3 lesions (G2, n=25) and more than 3 lesions (G3, n=11). The three last columns of Figure 1 give a demographic and clinical summary of these subgroups.
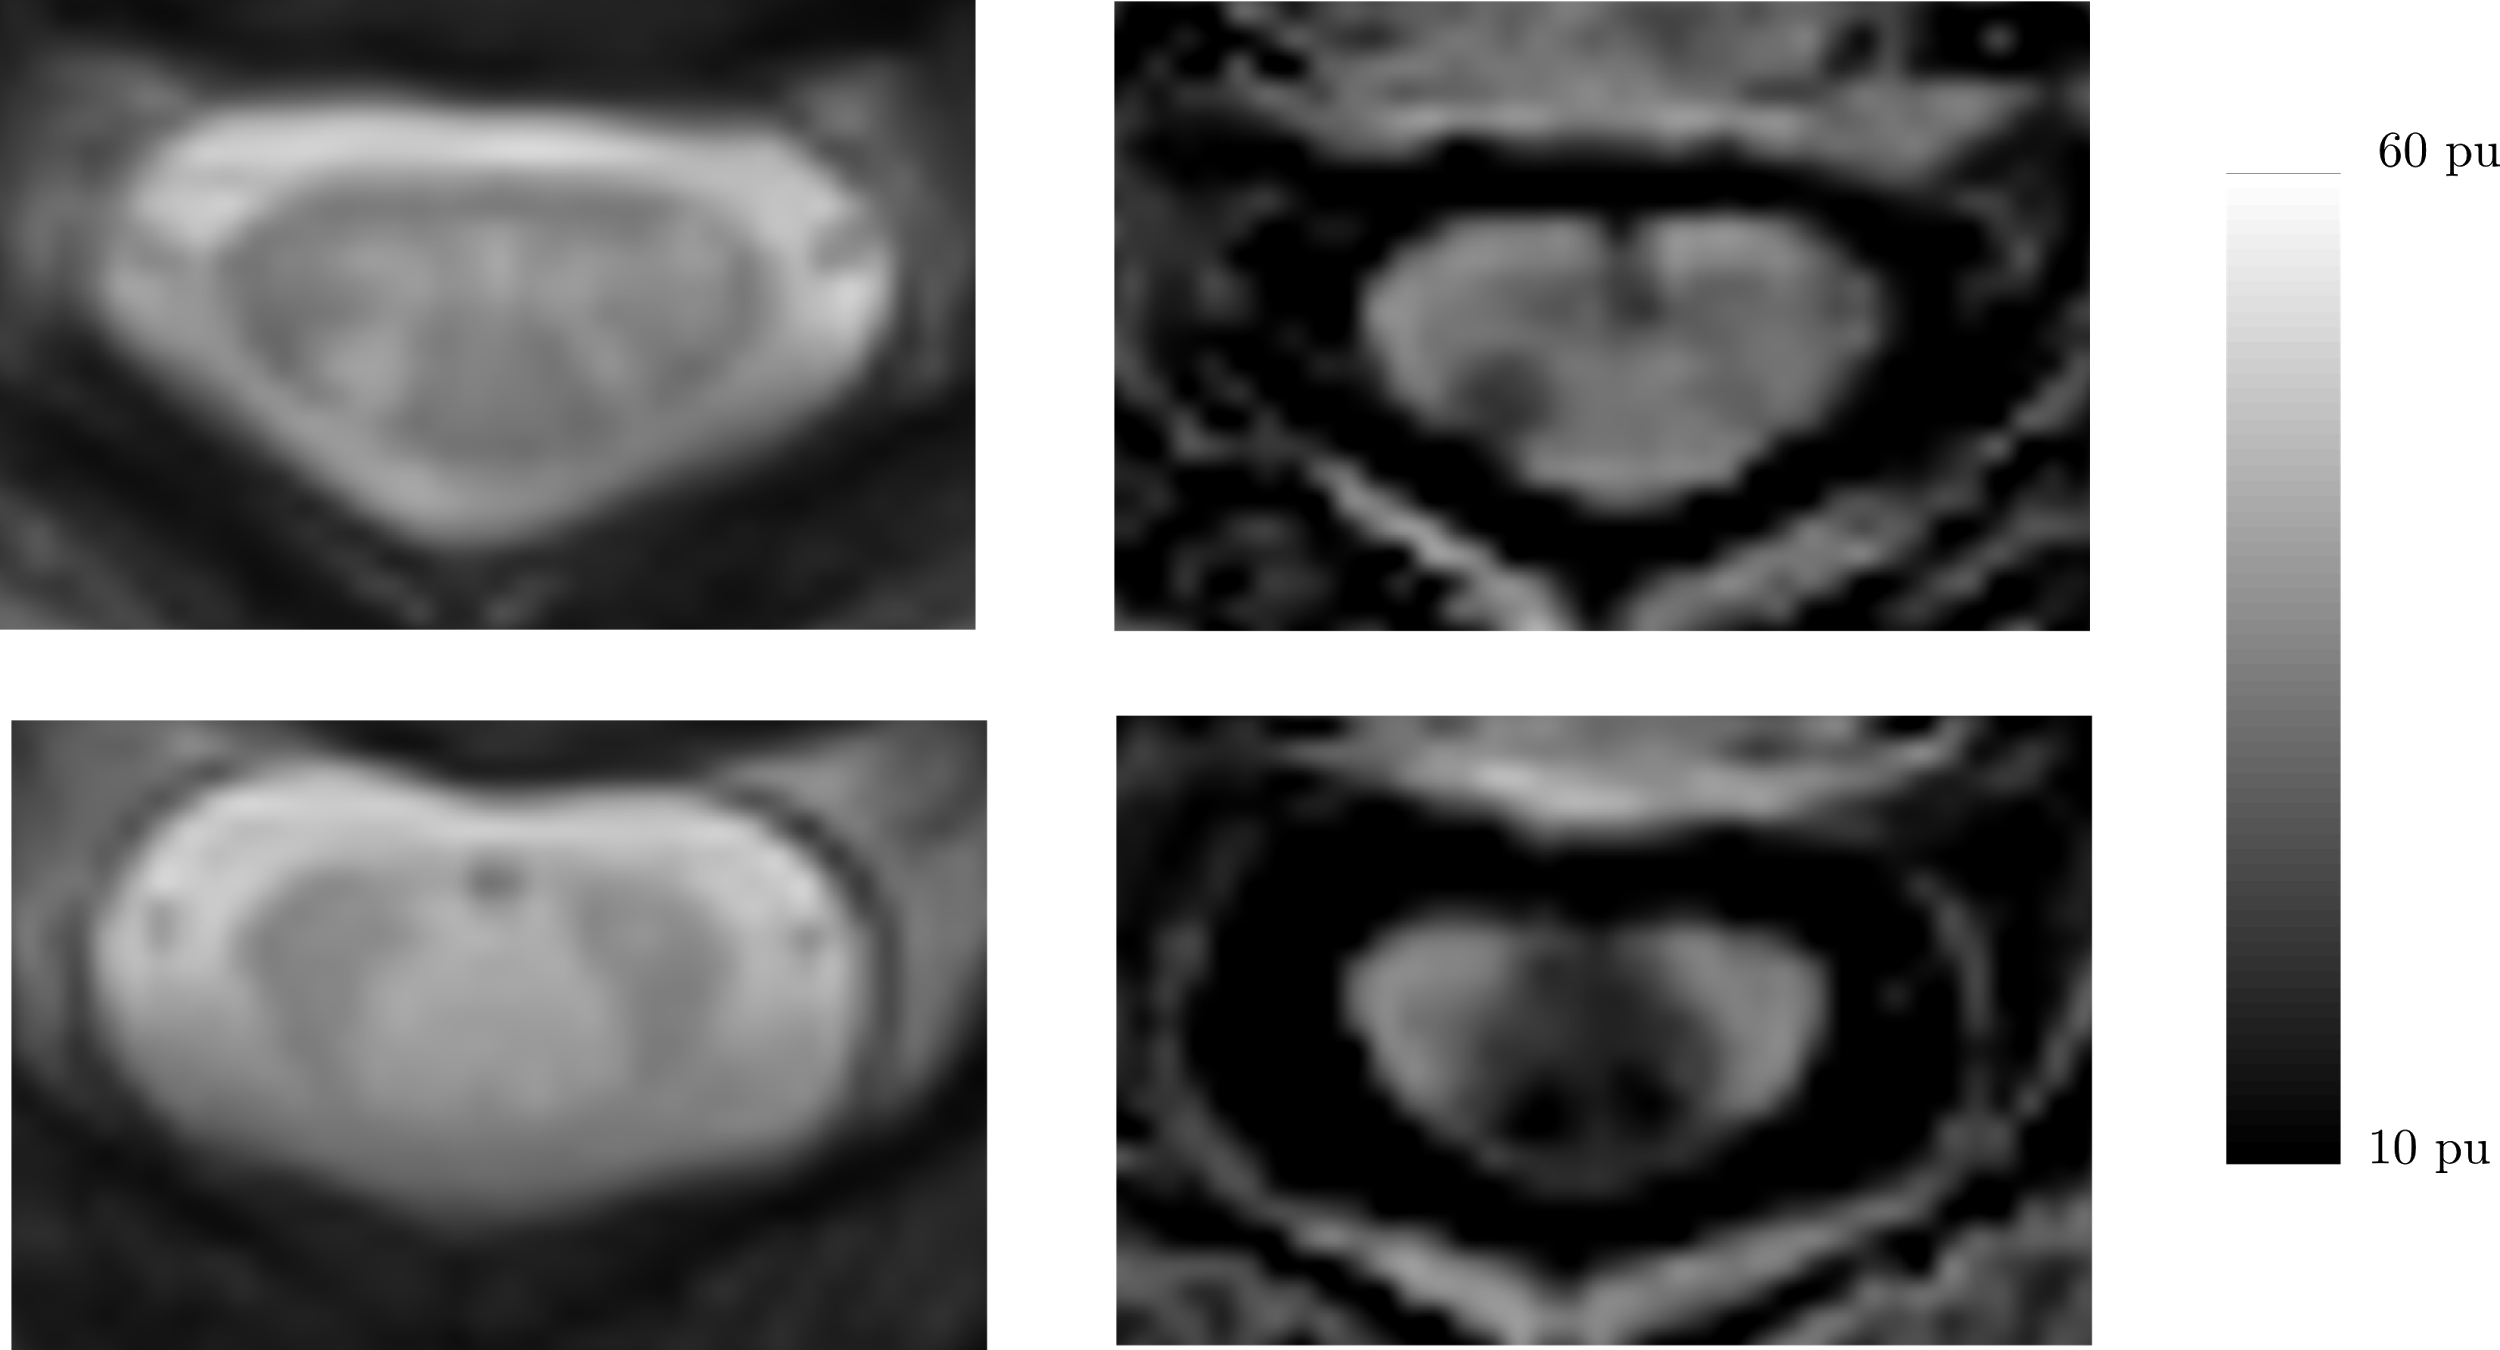
MTR in lesion: As exemplified in Figure 2, we observed a wide range of mean MTR loss in lesions (median: 4.0 pu, IQR: 4.0 pu). No evidence of correlation between mean MTR loss in lesions and i) MTR mean values in C4C6, ii) lesion volumes were observed.
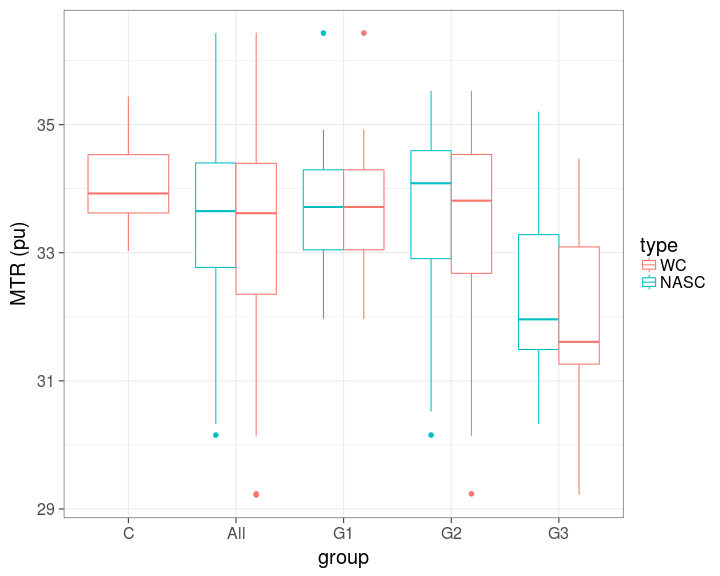
MTR in WC and NASC: Boxplots for the mean MTR in C4C6 WC and in NASC for patients, controls, subgroups G1, G2 and G3 are given in Figure 3. The mean MTR value in WC for the patient group was lower than for the control group (patient mean=33.3 pu, control mean=34.1 pu, p=0.02, 95% confidence interval (CI) for difference=(0.06,1.68)). After removing lesions and perilesional tissues, the mean MTR value was higher but still lower than the mean for the control group (mean=33.4 pu, p=0.04, CI for difference=(0.05,1.44)). Mean MTR in NASC C4C6 of G3 was lower than mean of G1 (CI for MTR difference to G1=(-2.25,-0.39), p=0.04). By contrast, we did not observe evidence of difference between G2 and G1 (CI=(-0.66 0.86), p=0.48).
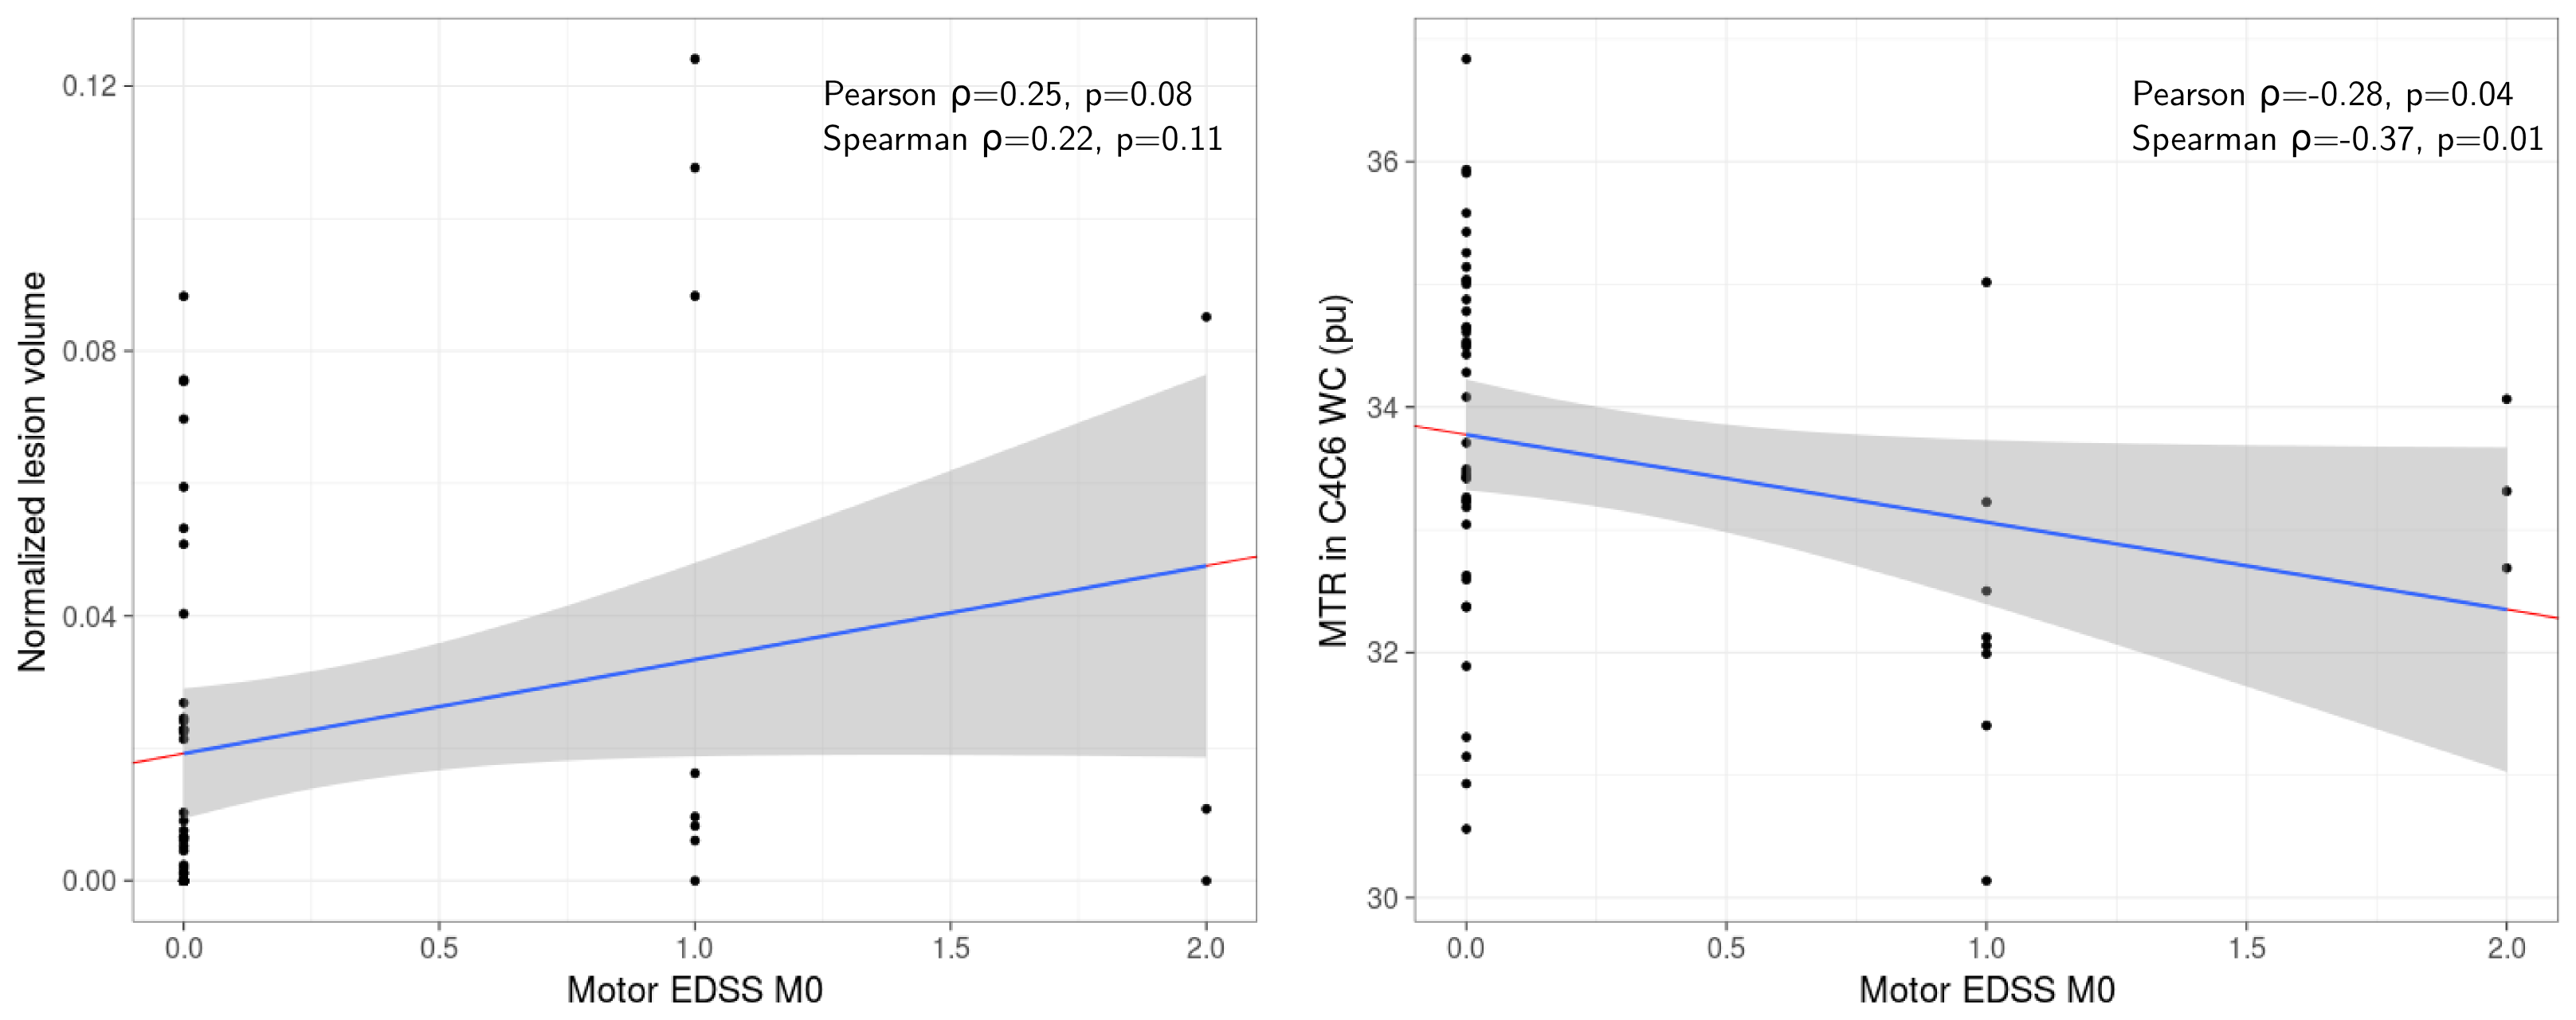
Relationship to clinical scores: Figure 4 displays the relationship between motor EDSS at baseline and respectively lesion volume and MTR in WC C4C6. Interestingly, we observed evidence of a moderate correlation between motor EDSS and MTR in WC C4C6 (p=0.04).
Conclusion
Due to the low variability within healthy population and moderate center effect, the assessment of relevant MTR differences at the first stage of MS is feasible in a multicenter context. Interestingly, we observed that patients with the highest lesion loads (G3) are associated to lower MTR values in normal appearing SC suggesting higher diffuse tissue damage (Figure 3). Moreover, at this early stage of the disease, the correlation of clinical status were slightly higher with MTR values in the cord than with lesion volume (Figure 4).Acknowledgements
Part of MRI data acquisition was supported by the Neurinfo MRI research facility from the University of Rennes I. Neurinfo is granted by the the European Union (FEDER), the French State, the Brittany Council, Rennes Metropole, Inria, Inserm and the University Hospital of Rennes.
The project was funded by the French National Clinical Research Program (Call 2012). https://clinicaltrials.gov/ct2/show/NCT02117375
References
1. Kearney H, Yiannakas MC, Samson RS, Wheeler-Kingshott CAM, Ciccarelli O, Miller DH. Investigation of magnetization transfer ratio-derived pial and subpial abnormalities in the multiple sclerosis spinal cord. Brain. 2014;137(9):2456-2468. doi:10.1093/brain/awu171.
2. Silver NC, Barker GJ, Losseff NA, et al. Magnetisation transfer ratio measurement in the cervical spinal cord: A preliminary study in multiple sclerosis. Neuroradiology. 1997;39(6):441-445. doi:10.1007/s002340050442.
3. Bozzali M, Rocca MA, Iannucci G, Pereira C, Comi G, Filippi M. Magnetization-transfer histogram analysis of the cervical cord in patients with multiple sclerosis. AJNR Am J Neuroradiol. 20(10):1803-1808. http://www.ncbi.nlm.nih.gov/pubmed/10588100.
4. Agosta F, Pagani E, Caputo D, Filippi M. Associations Between Cervical Cord Gray Matter Damage and Disability in Patients With Multiple Sclerosis. Arch Neurol. 2007;64(9):1302-1305.
5. Rovaris M, Bozzali M, Santuccio G, et al. In vivo assessment of the brain and cervical cord pathology of patients with primary progressive multiple sclerosis. Brain. 2001;124(Pt 12):2540-2549. internal-pdf://4.54.25.202/Rovaris.
6. Filippi M, Bozzali M, Horsfield MA, et al. A conventional and magnetization transfer MRI study of the cervical cord in patients with MS. Neurology. 2000;54(1):207. doi:10.1212/WNL.54.1.207.
7. Filippi M, Rocca M a, Falini a, et al. Correlations between structural CNS damage and functional MRI changes in primary progressive MS. Neuroimage. 2002;15(3):537-546. doi:10.1006/nimg.2001.1023.
8. Oh J, Sotirchos ES, Saidha S, et al. Relationships between quantitative spinal cord MRI and retinal layers in multiple sclerosis. Neurology. 2015;84(7):720-728. doi:10.1212/WNL.0000000000001257.
9. Oh J, Zackowski K, Chen M, et al. Multiparametric MRI correlates of sensorimotor function in the spinal cord in multiple sclerosis. Mult Scler. 2013;19(4):427-435. doi:10.1177/1352458512456614.
10. Zackowski K, Smith S, Reich D, et al. Sensorimotor dysfunction in multiple sclerosis and column-specific magnetization transfer-imaging abnormalities in the spinal cord. Brain 2009: 132; 1200-1209.
11. De Leener B, Lévy S, Dupont SM, et al. NeuroImage SCT : Spinal Cord Toolbox , an open-source software for processing spinal cord MRI data. Neuroimage 2017;145:24–43.
12. Commowick O, Wiest-Daesslé N, Prima S. Automated diffeomorphic registration of anatomical structures with rigid parts: application to dynamic cervical MRI. 15th Int Conf Med Image Comput Comput Assist Interv 2012;15:163–70.
13. Elise Bannier, Benoit Combès, et al. Evaluating the reliability of cervical spine magnetization transfer imaging in the context of multicenter longitudinal studies ESMRMB, Oct 2017, Barcelona, Spain. 2017
Figures