5290
Quantitative MT (qMT) imaging of the Whole Brain: Conventional 3D MT vs. 3D EP-vfMT methods1Department of Biomedical Engineering, Hankuk University of Foreign Studies, Yong-In, Republic of Korea, 2Imaging Institute, Cleveland Clinic Foundation, Cleveland, OH, United States, 3Department of Electrical and computer engineering, Seoul National University, Seoul, Republic of Korea, 4Mellen Center, Cleveland Clinic Foundation, Cleveland, OH, United States
Synopsis
In this study, the whole brain qMT map from conventional MT imaging was compared with that from a newly proposed method, Segmented EPI readout Variable Flip angle Magnetization Transfer (EP-vfMT). The voxel-wise correlation shows a high correlation between the two maps. Compared to the conventional MT method, EP-vfMT provides similar image quality with good reproducibility. It also covers a whole brain volume in a much reduced scan time.
Introduction
In quantitative MT (qMT) imaging, signal from macromolecules is quantified using multiple sets of MT data1-4. Long scan times have impeded use of qMT among patients with neurological disease. Recently, Dortch et al. demonstrated whole-brain qMT imaging at 7T, however overall scan time is long for routine use in patients5.
Recently, a new qMT method, Segmented EPI readout Variable Flip angle Magnetization Transfer (EP-vfMT) has been proposed6. This method utilizes a 3D segmented EPI readout to cover a 3D volume rapidly and reduce EPI-associated artifacts. In order to reduce SAR while maintaining similar MT saturation to conventional MT, the flip angle of the MT RF pulse is varied as a function of the slice-encoding index. Compared to conventional methods, EP-vfMT acquires qMT data sets rapidly enough for clinical use. In this work, we compared a qMT map from EP-vfMT with results from a conventional method. The spatial distribution of the qMT map over the whole brain was compared qualitatively and quantitatively. Additionally, intra-session reproducibility was estimated using a test-retest scan.
Method
For the comparison of the whole brain qMT map, data were collected from an ex-vivo brain, 5 healthy controls and an in-situ multiple sclerosis (MS) postmortem brain (IRB approved) at 3T (Siemens Healthcare, Erlangen).
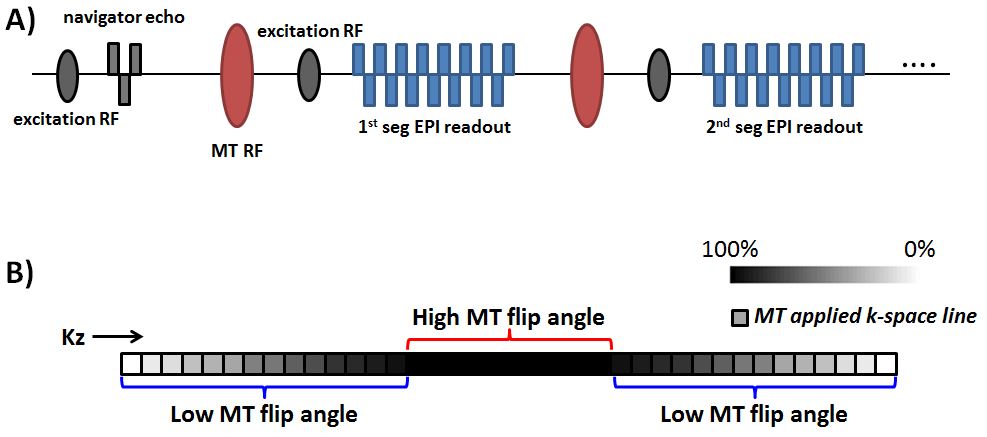
The EP-vfMT sequence diagrams are shown in Fig. 1. To cover a 3D volume rapidly and reduce EPI-associated artifacts, a 3D segmented EPI readout was utilized. In order to reduce SAR while maintaining similar MT saturation to conventional MT, the flip angle of the MT RF pulse was varied as a function of the slice-encoding index (Fig. 1(B)).
MR Scans: To demonstrate the spatial distribution of the qMT map from the EP-vfMT method, data were acquired with 10 different combinations of MT RF flip angles (212, 434, 843°) and offset frequencies (1000, 2500, 3500, 5000, 7500, 15000 Hz). The scan parameters are as follows: 1.6×1.6×4.0 mm3, NEX = 2, 200 dummy scans, TR = 32-40 ms (minimum TR depending on SAR limitations). The parallel imaging technique was not used. To generate the bound pool fraction map, the acquired data is fitted using a nonnegative least-squares fitting method proposed by Cabana et al.7
Parameter-matched conventional pulsed GRE-MT data were acquired. The scan parameters from EP-vfMT were used with the exception of TR, NEX and parallel imaging option, as follows: TR = 60-74 ms, NEX = 1, GRAPPA acceleration factor 3.
The bound pool fraction from qMT can be interpreted as a measure of myelin density. For comparison, alternative measures of myelin from ViSTa8-9 and multi-echo 3D GRASE10 were used for comparison.
Data analysis: After generating bound pool fraction maps from each method, a voxel-wise correlation was calculated in a brain mask, which was generated from the non-MT image segmented by FSL11.
Reproducibility: To test intra-session reproducibility, the EP-vfMT scan was acquired twice (7 day gap between 1st and 2nd scan) from a healthy control. An ex-vivo brain was scanned three times (on a different days) using conventional and EP-vfMT methods.
Result
EP-vfMT can achieve whole-brain coverage in a much shorter scan time (6.25 min with TR = 33ms) than the conventional method (26.2 min with TR = 62 ms).
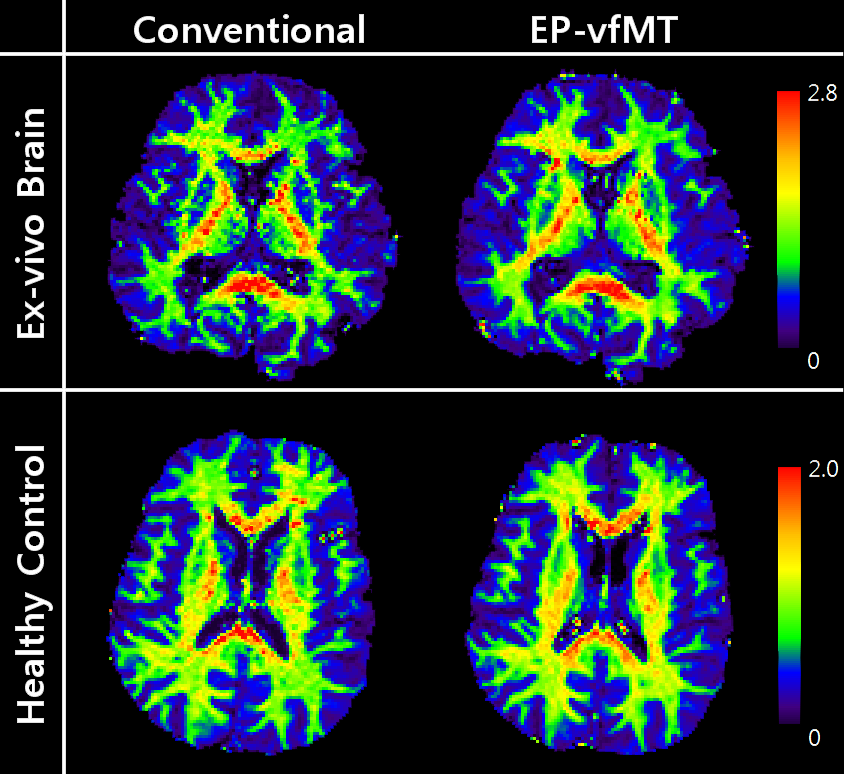
Qualitative comparison of EP-vdMT against conventional qMT is shown in Fig. 2. Maps of bound pool fraction (F-maps) reveal similar signal distributions. In all maps, higher bound pool fraction is observed in regions with high myelin density (genu, splenium and internal capsule). When voxel-wise correlation was performed, the mean correlation coefficients were 0.95 ± 0.002 (ex-vivo brain, n = 3) and 0.81 ± 0.39 (healthy control, n = 5), suggesting a high similarity between the two maps.
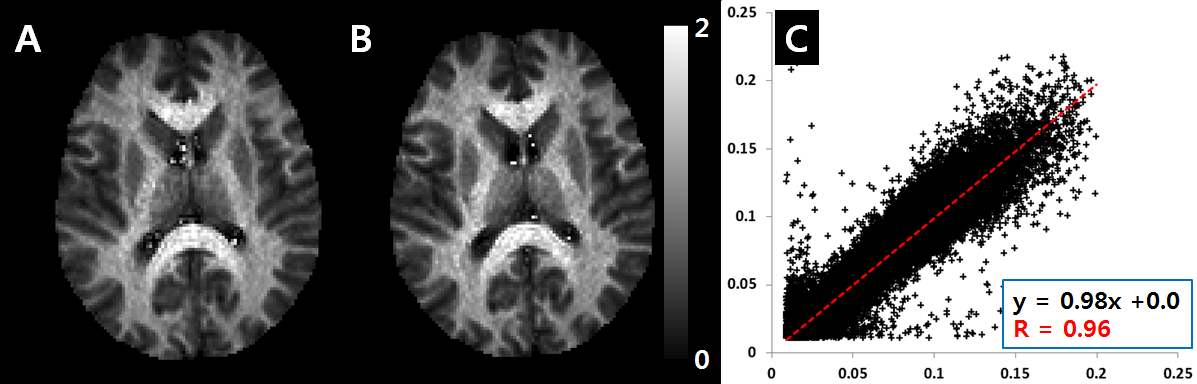
A result of the reproducibility test result from a healthy control is shown in Fig. 3. Both F-maps reveal qualitatively similar signal distributions. Voxel-wise correlation was high (R = 0.96), and the slope of the trend line was 0.98, suggesting high similarity.
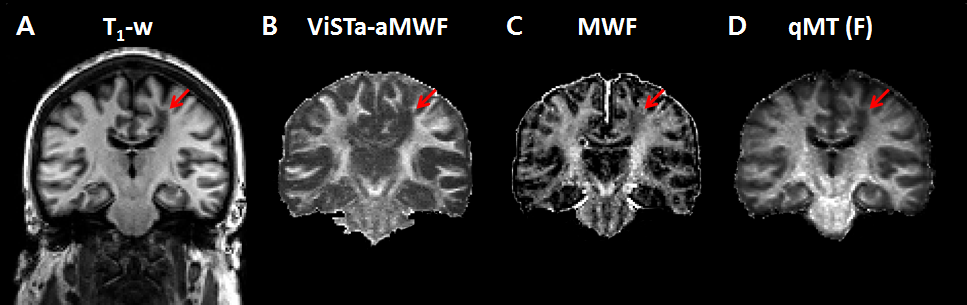
Figure 4 show images acquired in-situ from an MS patient within 6 hours of death. Demyelinated MS lesions demonstrated hypo-signal on the T1-weighted, ViSTa apparent myelin water fraction (aMWF) and 3D-GRASE based MWF images. The corresponding areas in the F-map demonstrated much reduced signal levels, clearly delineating T1-hypointense lesions (Fig. 4D).
Discussion and Conclusions
Compared to the conventional method, the proposed EP-vfMT provides a similar qMT map with whole brain coverage in a clinically feasible scan time. The EP-vfMT F-map shows a good correlation with the conventional method and demonstrates good reproducibility. Moreover, it maintains sensitivity to demyelinated T1-hypointense lesions. These features make the proposed method appealing for clinical neuroimaging applications.Acknowledgements
This work was supported by Cleveland Clinic, the HankukUniversity of Foreign Studies Research Fund and National Research Foundation of Korea (NRF-2017R1C1B1008345). . The Cleveland Clinic MS brain donation program is supported by NIH Grant R01NS091683. Author gratefully acknowledges technical support by Siemens Medical Solutions.References
[1] Henkelman, R.M., Huang, X., Xiang, Q.S., Stanisz, G.J., Swanson, S.D., Bronskill, M.J., 1993. Quantitative interpretation of magnetization transfer. Magn Reson Med 29, 759-766.
[2] Pike, G.B., 1996. Pulsed magnetization transfer contrast in gradient echo imaging: a two-pool analytic description of signal response. Magn Reson Med 36, 95-103.
[3] Sled, J.G., Pike, G.B., 2000. Quantitative interpretation of magnetization transfer in spoiled gradient echo MRI sequences. J Magn Reson 145, 24-36.
[4] Sled, J.G., Pike, G.B., 2001. Quantitative imaging of magnetization transfer exchange and relaxation properties in vivo using MRI. Magn Reson Med 46, 923-931.
[5] Dortch, R.D., Moore, J., Li, K., Jankiewicz, M., Gochberg, D.F., Hirtle, J.A., Gore, J.C., Smith, S.A., 2013. Quantitative magnetization transfer imaging of human brain at 7 T. Neuroimage 64, 640-649.
[6] Se-Hong Oh and Mark J. Lowe, Segmented EPI readout Variable Flip-angle Magnetization Transfer (EP-vfMT) imaging for 7 T quantitative MT (qMT) Imaging, ISMRM 2017, #4738
[7] Jean-François Cabana, Ye Gu, Mathieu Boudreau, Ives R Levesque, Yaaseen Atchia, John G. Sled, Sridar Narayanan, Douglas L. Arnold, G. Bruce Pike, Julien Cohen-Adad, Tanguy Duval, Manh-Tung Vuong and Nikola Stikov, 2016, Quantitative magnetization transfer imaging made easy with qMTLab: Software for data simulation, analysis, and visualization, Concepts in Magnetic resonance Part A, 44A, 263–277
[8] Oh, S.H., Bilello, M., Schindler, M., Markowitz, C.E., Detre, J.A., Lee, J., 2013. Direct visualization of short transverse relaxation time component (ViSTa). Neuroimage 83C, 485-492.
[9] Se-Hong Oh, Joon Yul Choi, Jang-Yeon Park, Jongho Lee, “Three Dimensional Quantitative Myelin Water Imaging using Direct Visualization of Short Transverse Relaxation Time Component (ViSTa)”, ISMRM, 2014, Milan, #4280
[10] Prasloski, T., Rauscher, A., MacKay, A.L., Hodgson, M., Vavasour, I.M., Laule, C., Madler, B., 2013. Rapid whole cerebrum myelin water imaging using a 3D GRASE sequence. Neuroimage 63, 533-539.
[11] Smith, S.M., 2002. Fast robust automated brain extraction. Hum Brain Mapp 17, 143-155. van der Kolk, A.G., Hendrikse, J., Zwanenburg, J.J., Visser, F., Luijten, P.R., 2013. Clinical applications of 7 T MRI in the brain. Eur J Radiol 82, 708-718.
Figures