5288
Utility of Combination Image of T2-weighted and FLAIR using Synthetic MRI for Improved Lesion Contrast in Multiple Sclerosis1Department of Medical Imaging, Faculty of Life Sciences, Kumamoto University, Kumamoto, Japan, 2Schoo of Health Sciences, Kumamoto University, Kumamoto, Japan, 3Radiological Center, University of Fukui Hospital, Fukui, Japan, 4Department of Radiology, University of Fukui, Fukui, Japan
Synopsis
To
improve multiple sclerosis plaque, we attempted to produce Synthetic FLAIR3
(SyFLAIR3) combined from FLAIR and T2WI using Synthetic MRI. The purpose of
this study was to determine optimal contrast weighting for SyFLAIR3 and to
evaluate whether the SyFLAIR3 can improve the T2 contrast on WM. To
effectively suppress CSF signal for SyFLAIR3, it was necessary to optimize the
combination of TE for T2WI and FLAIR. The optimized SyFLAIR3 using Synthetic
MRI makes it possible to improve contrast in MS lesion.
PURPOSE
Multiple sclerosis (MS) is an inflammatory demyelinating disease of the central nervous system characterized by inflammatory cell infiltration and demyelination around white matter (WM). MS lesions are visualized by their relatively high signal compared with peripheral tissue using T2-weighted image (T2WI) and fluid attenuated inversion recovery image (FLAIR). To improve the accuracy of the MS diagnosis, higher image contrasts of MS lesions are necessary. Gabr et al. reported the post-acquisition combination of three-dimensional T2WI and FLAIR, termed FLAIR3, that improve the visualization of a MS lesion.1,2 However, their acquisitions are time consuming, which may cause motion artifacts or displacements between two acquisitions. Synthetic MRI is a technique to quantify T1, T2, and proton density (PD), with only a pulse sequence.3,4 After quantification, the images can be produced with any contrast weighting by freely changing TR, TE, and TI without additional scanning. In this study, we attempted to produce Synthetic FLAIR3 images (SyFLAIR3) from FLAIR and T2WI with optimal contrast weighting using Synthetic MRI. The purpose of this study was to determine the optimal contrast weighting for SyFLAIR3 and to evaluate any benefits of improving the T2 contrast of WM.MATERIALS AND METHODS
All studies were performed on a 3.0T MRI (Discovery MR750; GE Healthcare, Waukesha, WI) with a 32-channel head array coil. The study protocol was approved by the institutional review board of the University of Fukui. Ten healthy volunteers were enrolled (mean age 39.2 y.o.). The general multiplicative combination of two images is given by the following equation:
Signal intensity of SyFLAIR3 = Signal intensity of FLAIRα × Signal intensity of T2WIβ
where, α = 1.55 and β = 1.45, representing positive exponents.2
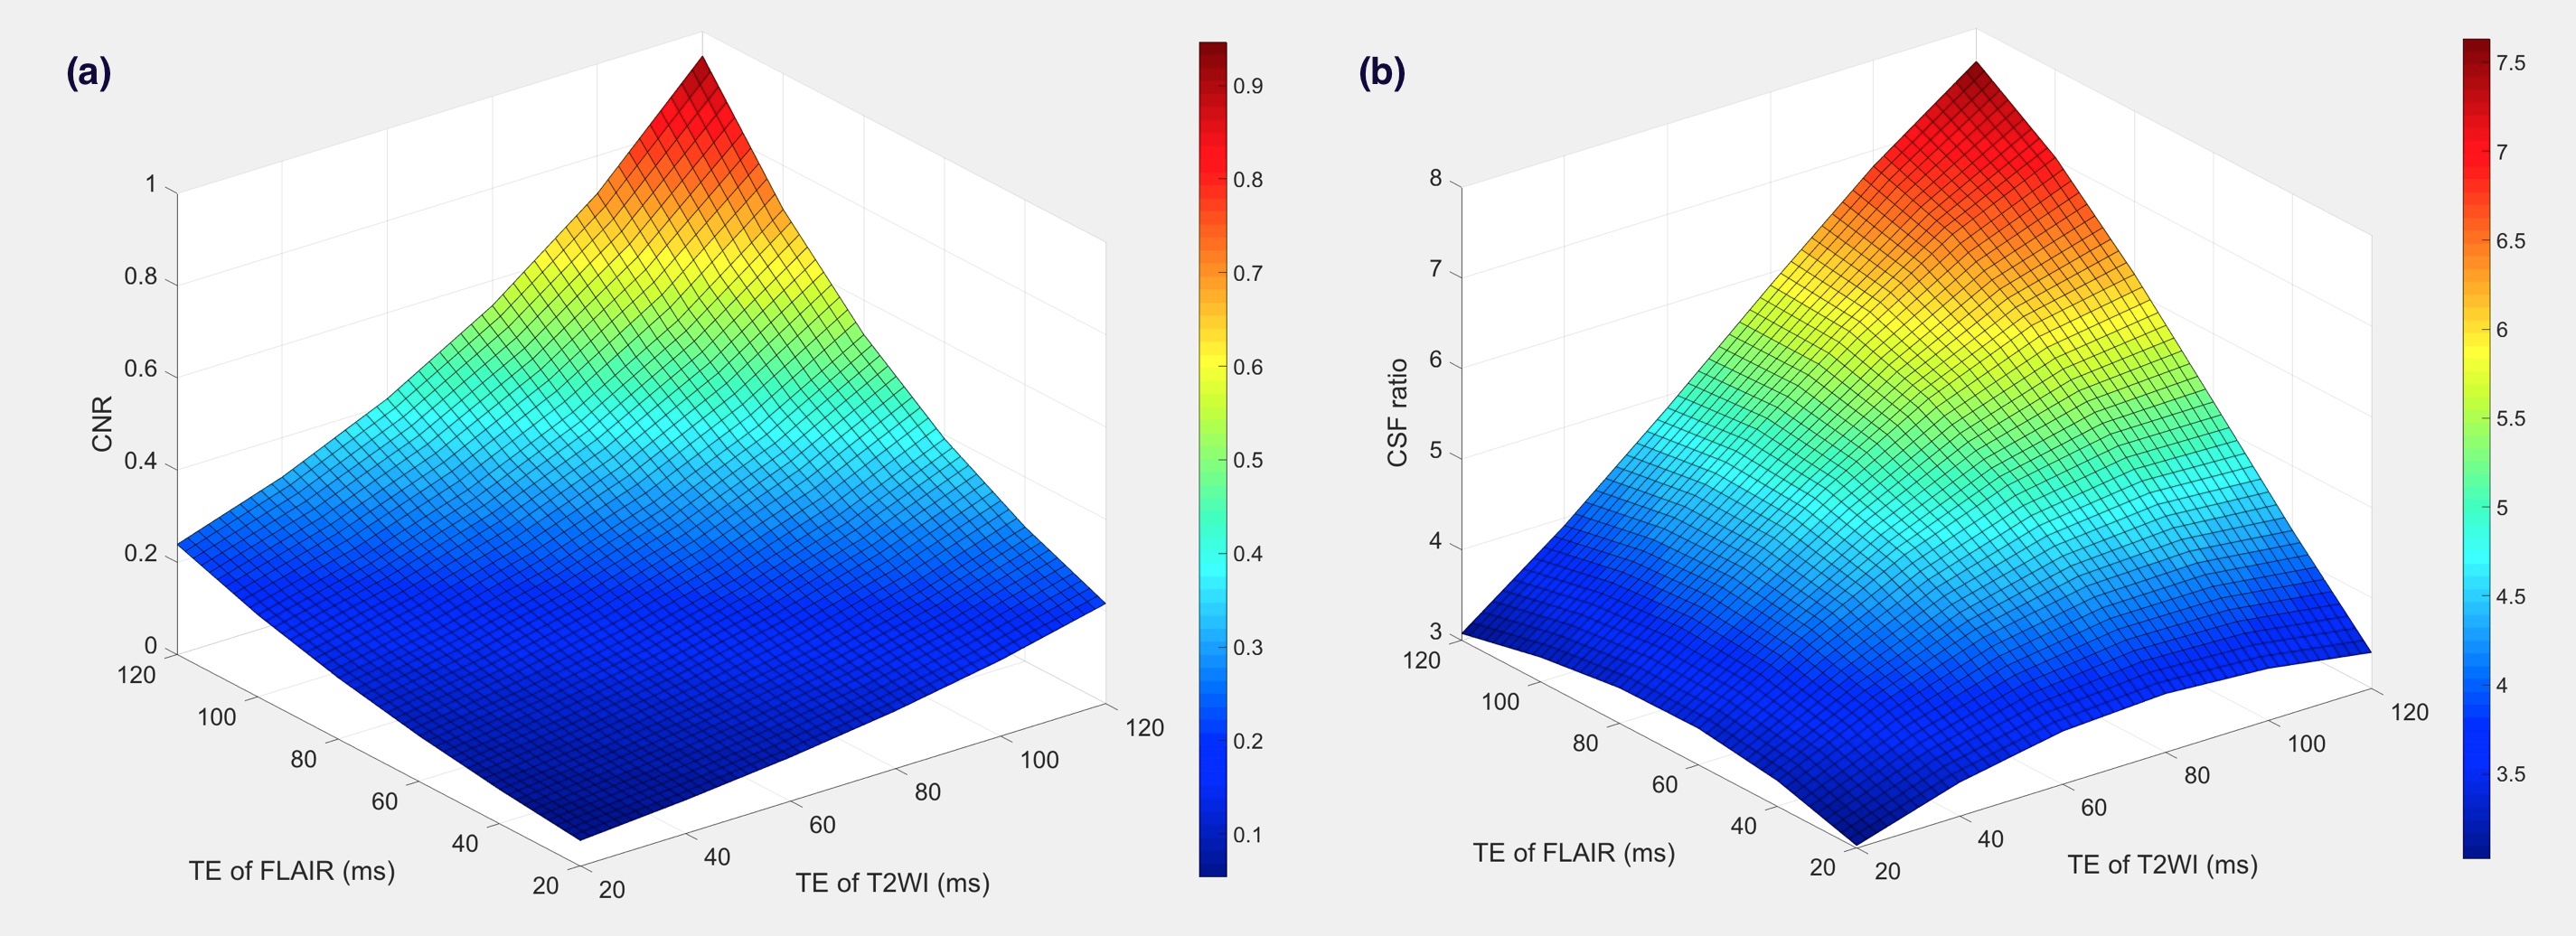
1. Numerical simulation
To estimate the optimal TE for combining the T2WI with the FLAIR, the signal intensities of the WM, white matter lesion (WML), gray matter (GM), cerebrospinal fluid (CSF), and noise on FLAIR3 at the setting of TE from 20 to 140 ms, were simulated. The image noise was estimated as 10% of the signal intensity of each tissue. Then, the contrast-to-noise-ratios between WM and WM lesion (CNRs) of FLAIR, T2WI, and SyFlAIR3 were compared. Moreover, to estimate the effect of the CSF signal suppression, the ratio of the signal intensity of the CSF and GM (CSF ratio) was defined and calculated for both FLAIR and SyFLAIR3.
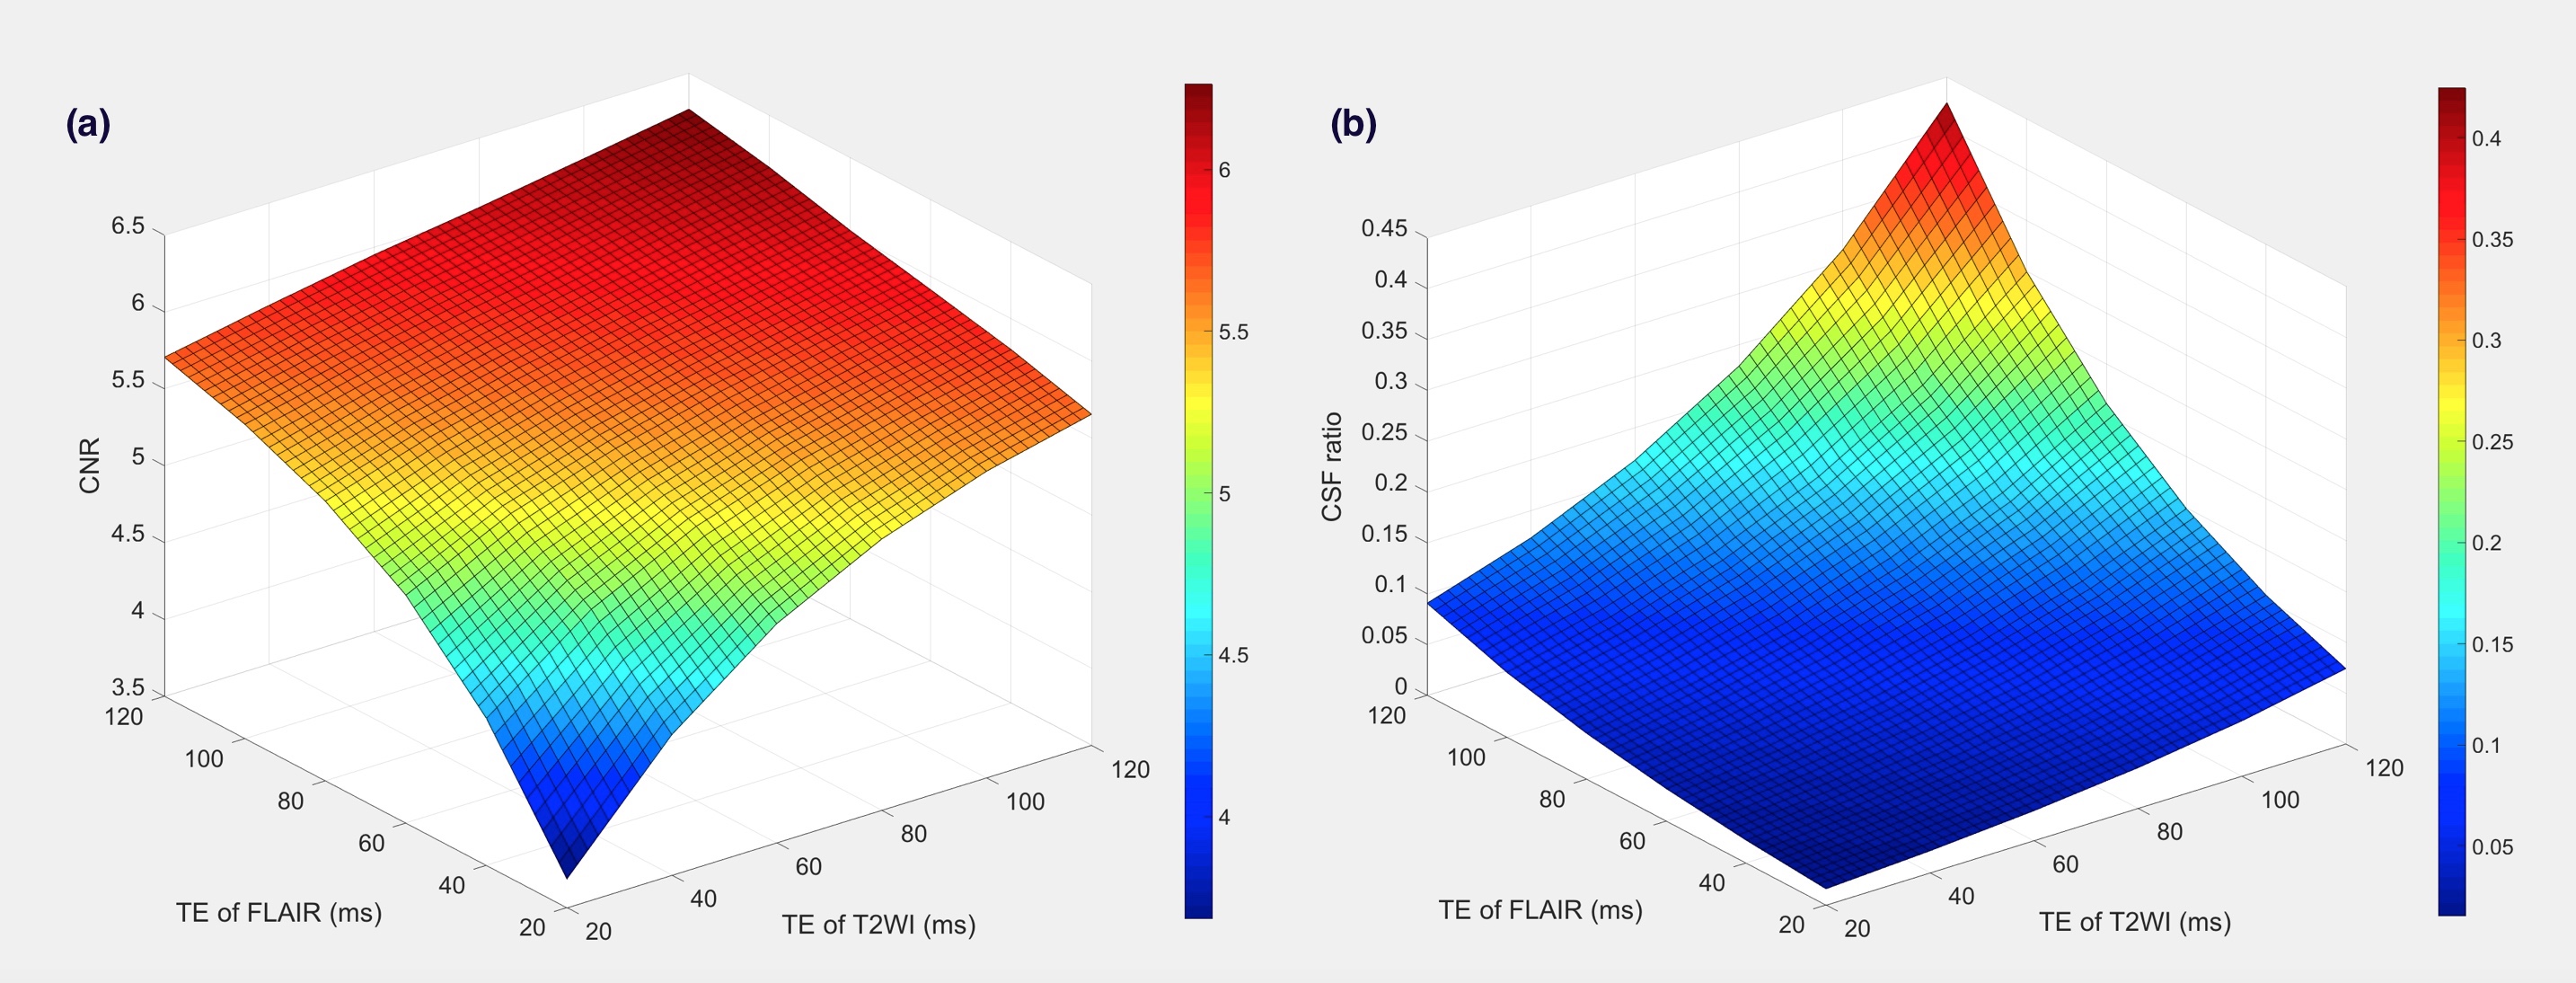
2. in vivo study
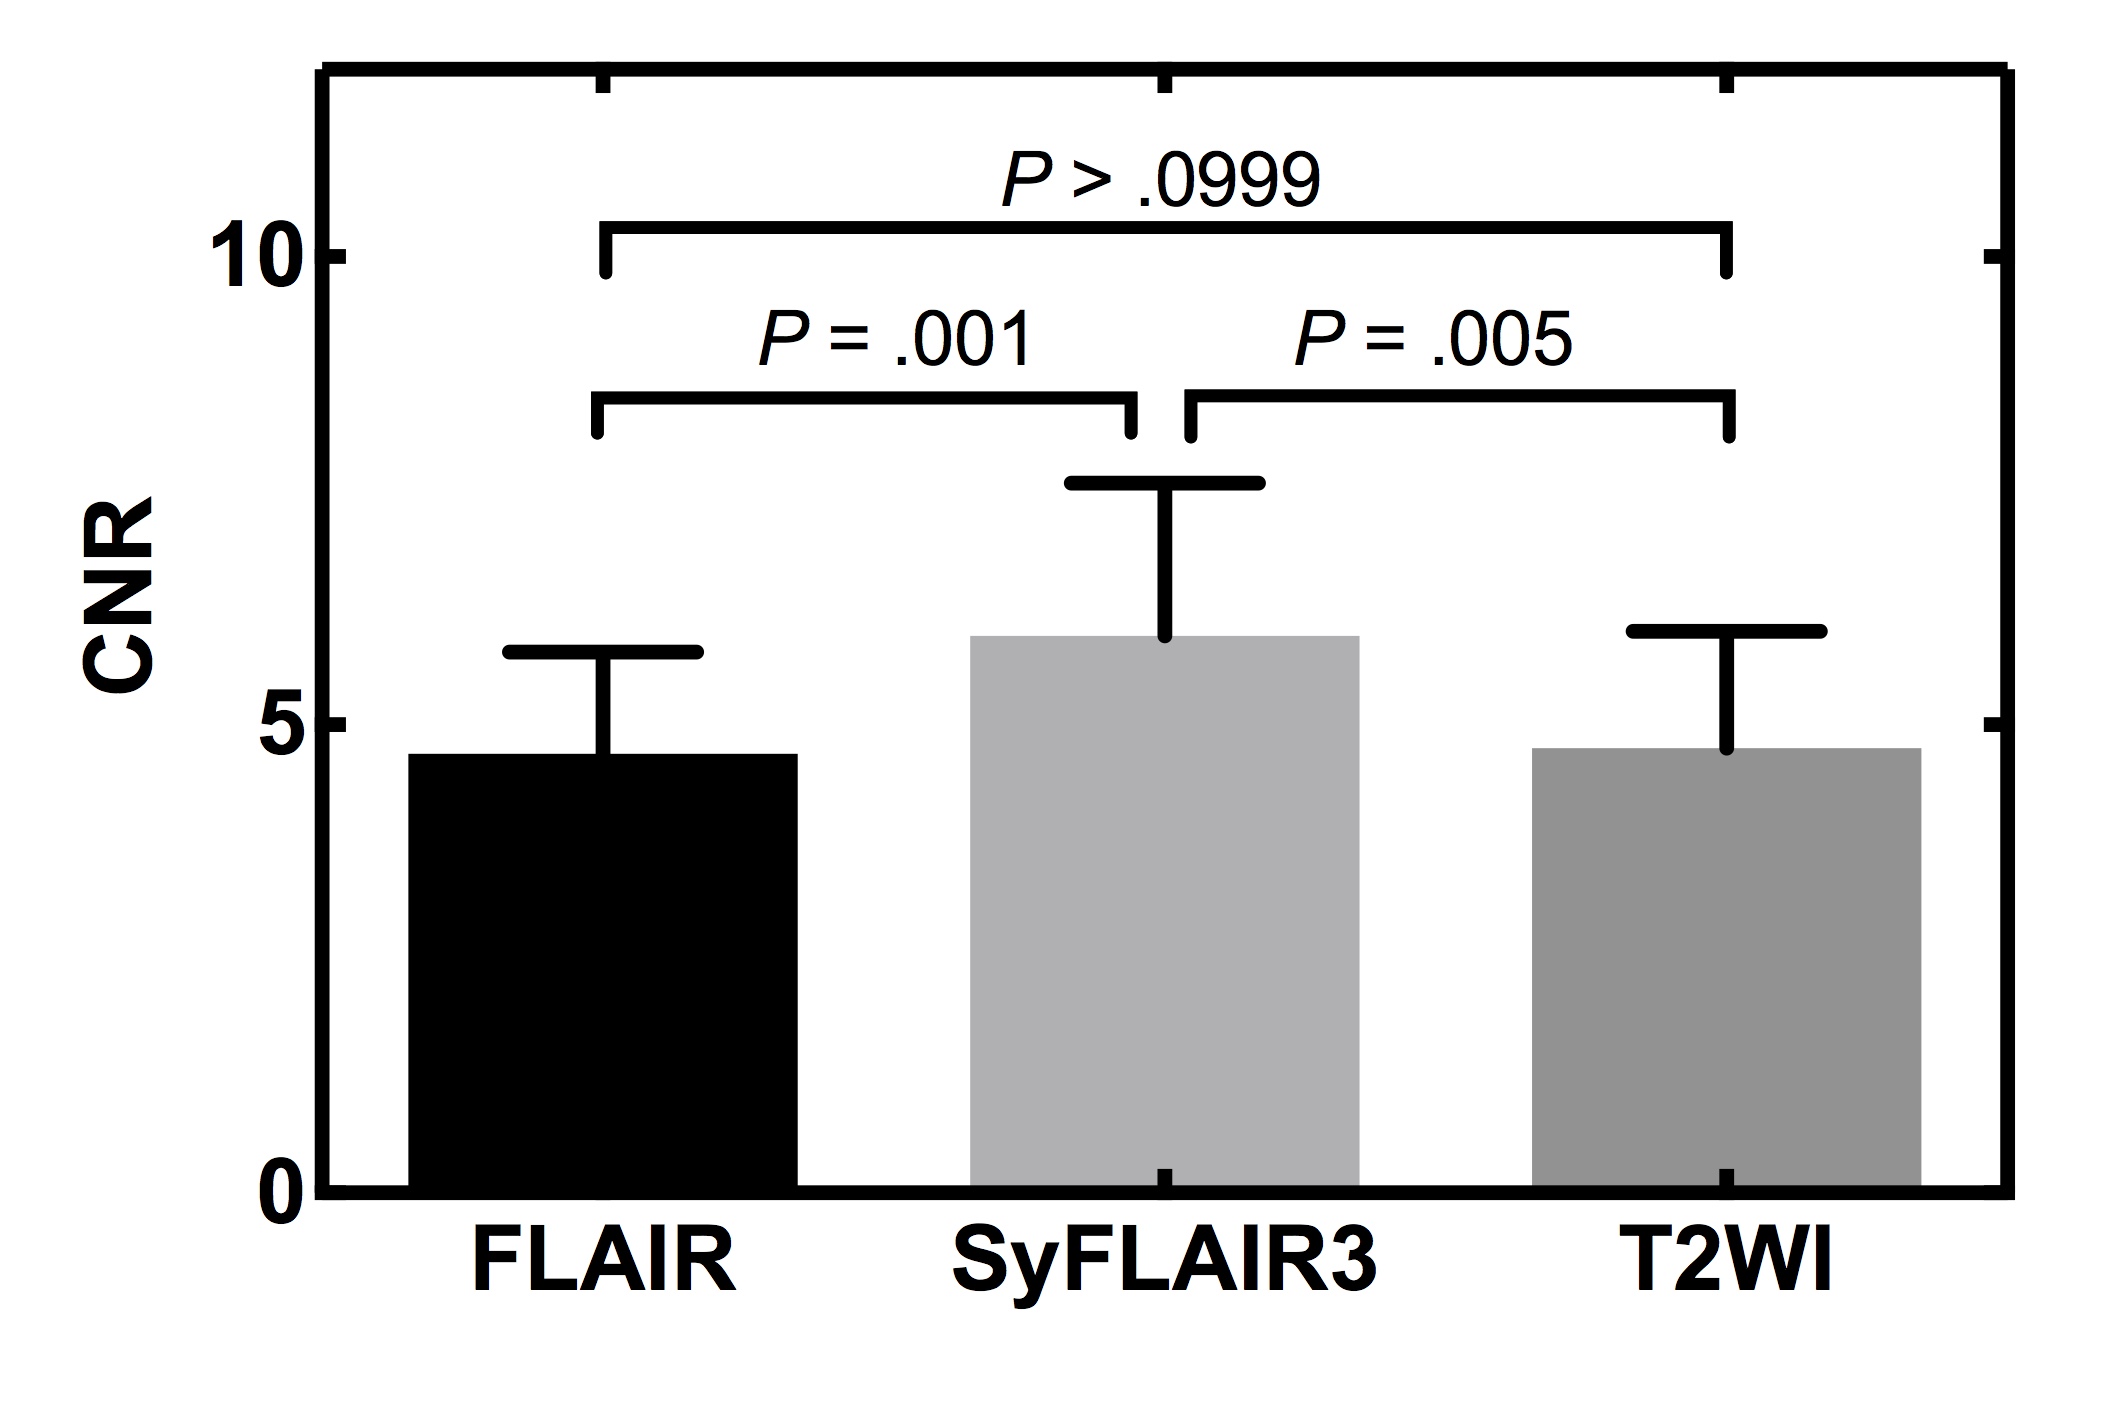
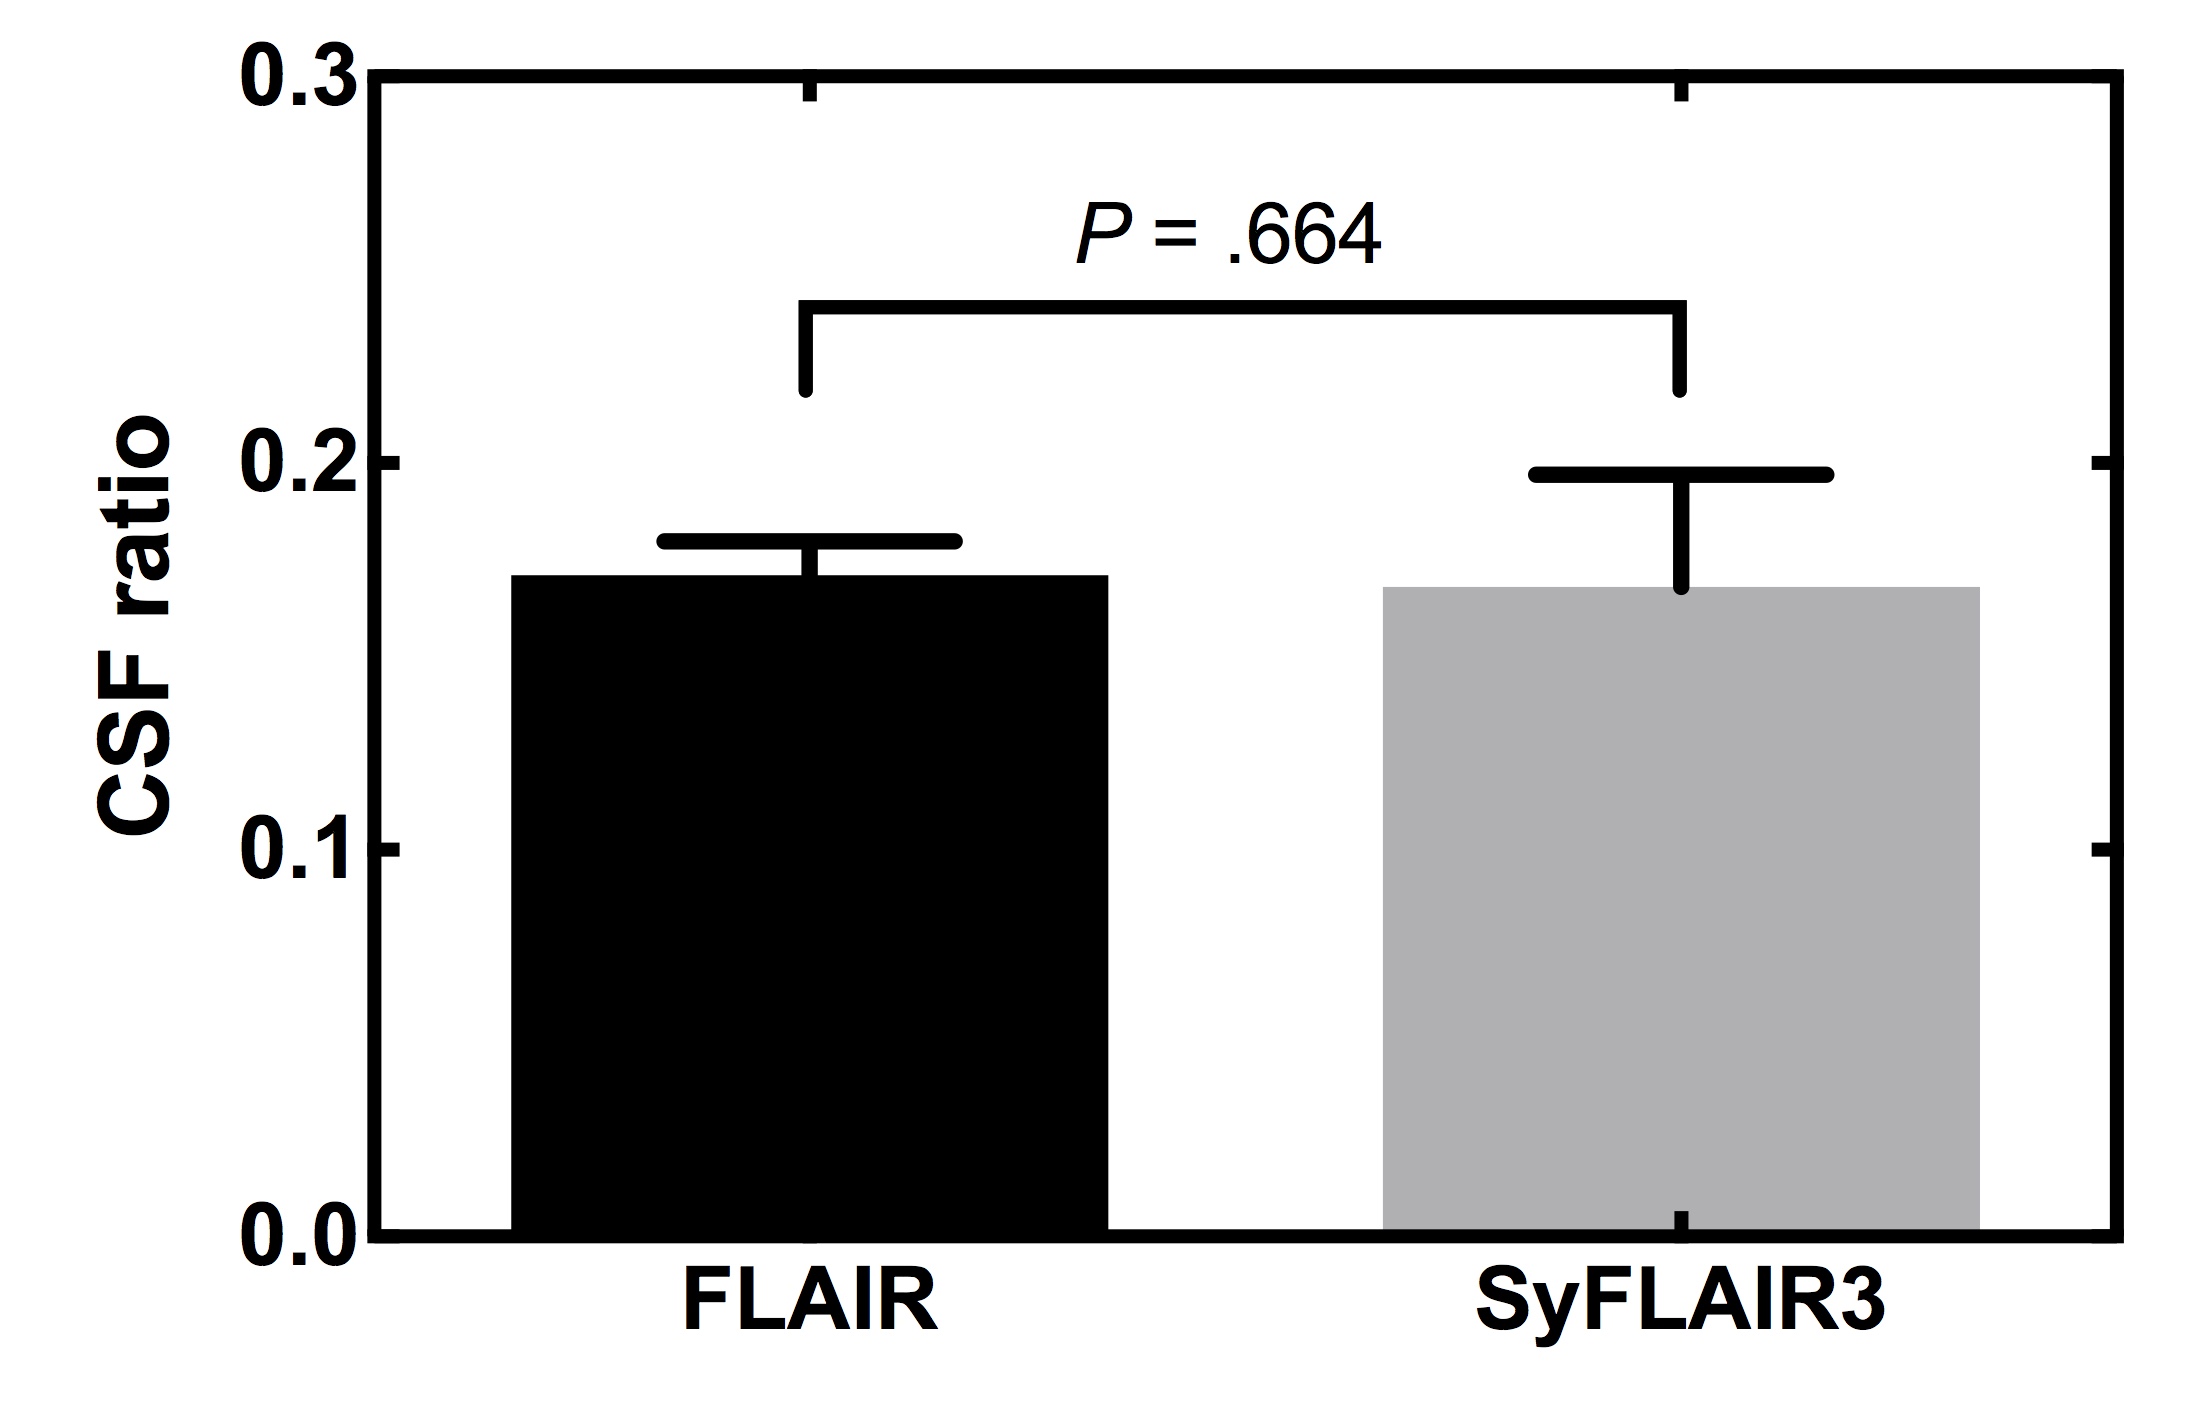
To validate the optimal combinations of TE for the T2WI and FLAIR, volunteer images were obtained using a Synthetic MRI pulse sequence. The imaging parameters were as follows: FOV = 240 mm; TR = 4000 ms; TE = 21.3 and 85.2 ms; ASSET factor = 2; and matrix size = 320 × 256. The T2WI and FLAIR images were generated from the set, for 20–140 ms of SyFLAIR3, with all TE combinations generated. The signal intensity of the frontal WM, superior frontal gyros (GM), and CSF in the frontal horn of the lateral ventricle were measured. The signal intensity of WML was measured as a region in which the T2 value was prolonged by 15% compared with that of WM, as a substitute of WML. These regions were located in around the parietal WM. Then, to determine the optimal combination of TE for the T2WI and FLAIR, the CNR and CSF ratio were measured. The nonparametric Wilcoxon matched-pairs rank test was used to compare the CSF ratio between FLAIR and SyFLAIR3. Moreover, the Friedman test was performed to compare the CNR among FLAIR, SyFLAIR3, and T2WI, and post-hoc tests were performed using Dunn’s multiple comparisons test.
RESULTS
In the numerical simulation, the CNR was increased or decreased for the setting of longer or shorter TE, respectively, for T2WI and FLAIR. The results of the in vivo study showed tendencies similar to that of the numerical simulation. The optimal combination of TE for T2WI and FLAIR, for application to SyFLAIR3, were determined to be 60 ms for the T2WI and 120 ms for the FLAIR. The CNR values were significantly higher for optimized SyFLAIR3 than those for FLAIR and T2WI. There was no significant difference between the CSF ratios for optimized SyFLAIR3 and FLAIR.DISCUSSION AND CONCLUSION
The CNR and CSF ratio for SyFLAIR3 combined with Synthetic MRI were dependent on the setting of TE for FLAIR and T2WI. In particular, the setting of a longer TE for the T2WI was increased the CSF ratio for SyFLAIR3, because the T2 value of the CSF was relatively longer compared to GM. To effectively suppress the CSF signal and improve contrast of MS lesion for SyFLAIR3, it was necessary to optimize the combination of TE for T2WI and FLAIR. In conclusion, SyFLAIR3 produced by Synthetic MRI improves contrast in an MS lesion.
Acknowledgements
No acknowledgement found.References
-
Wiggermann V, Hernández-Torres E, Traboulsee A, Li DKB, Rauscher A. FLAIR2: A Combination of FLAIR and T2 for Improved MS Lesion Detection. AJNR Am J Neuroradiol 2016;37:259–265.
- Gabr RE, et al. Optimal combination of FLAIR and T2-weighted MRI for improved lesion contrast in multiple sclerosis. J. Magn. Reson. Imaging 2016;44:1293–1300.
- Warntjes JBM, et al. Rapid magnetic resonance quantification on the brain: Optimization for clinical usage. Magn. Reson. Med. 2008;60:320–329.
- Hagiwara A, et al. SyMRI of the Brain: Rapid Quantification of Relaxation Rates and Proton Density, With Synthetic MRI, Automatic Brain Segmentation, and Myelin Measurement. Invest Radiol 2017;52:647–657.
Figures