5286
Advanced diffusion MRI characterization of microstructure changes associated with increasing T1 hypointensity in the white matter lesions of relapsing-remitting multiple sclerosis patients.1New York University, New York, NY, United States
Synopsis
Autopsy studies of white matter lesions in relapsing-remitting multiple sclerosis demonstrate that FLAIR-bright lesions represent a juxtaposition of inflammation, demyelination, axonal injury and gliosis, whereas T1 hypointense lesions represent more severe confluent injury and axonal loss. We used a white matter tract integrity (WMTI) previously validated in cuprizone animal models of demyelination to better characterize specific in vivo microstructure changes associated with graded T1 signal intensity changes in multiple sclerosis lesions.
INTRODUCTION
Relapsing-remitting multiple sclerosis (RR-MS) is a common disease of inflammation and neurodegeneration affecting young adults that results in progressive disability. MRI in most RR-MS patients is characterized by transient foci of enhancement associated with active inflammation followed by the progressive accumulation of FLAIR-hyperintense inflammatory and demyelinating lesions, and parenchymal volume loss1. Previous studies have suggested that FLAIR-bright lesions with T1 hypointensity are more severe, better correlate with disability and represent more severe, confluent axonal loss and matrix destruction2-4. We used a white matter tract integrity (WMTI)5 model previously validated in cuprizone animal models of demyelination6-7 to better characterize in vivo the microstructure changes associated with T1 signal intensity changes in RR-MS lesions.METHODS
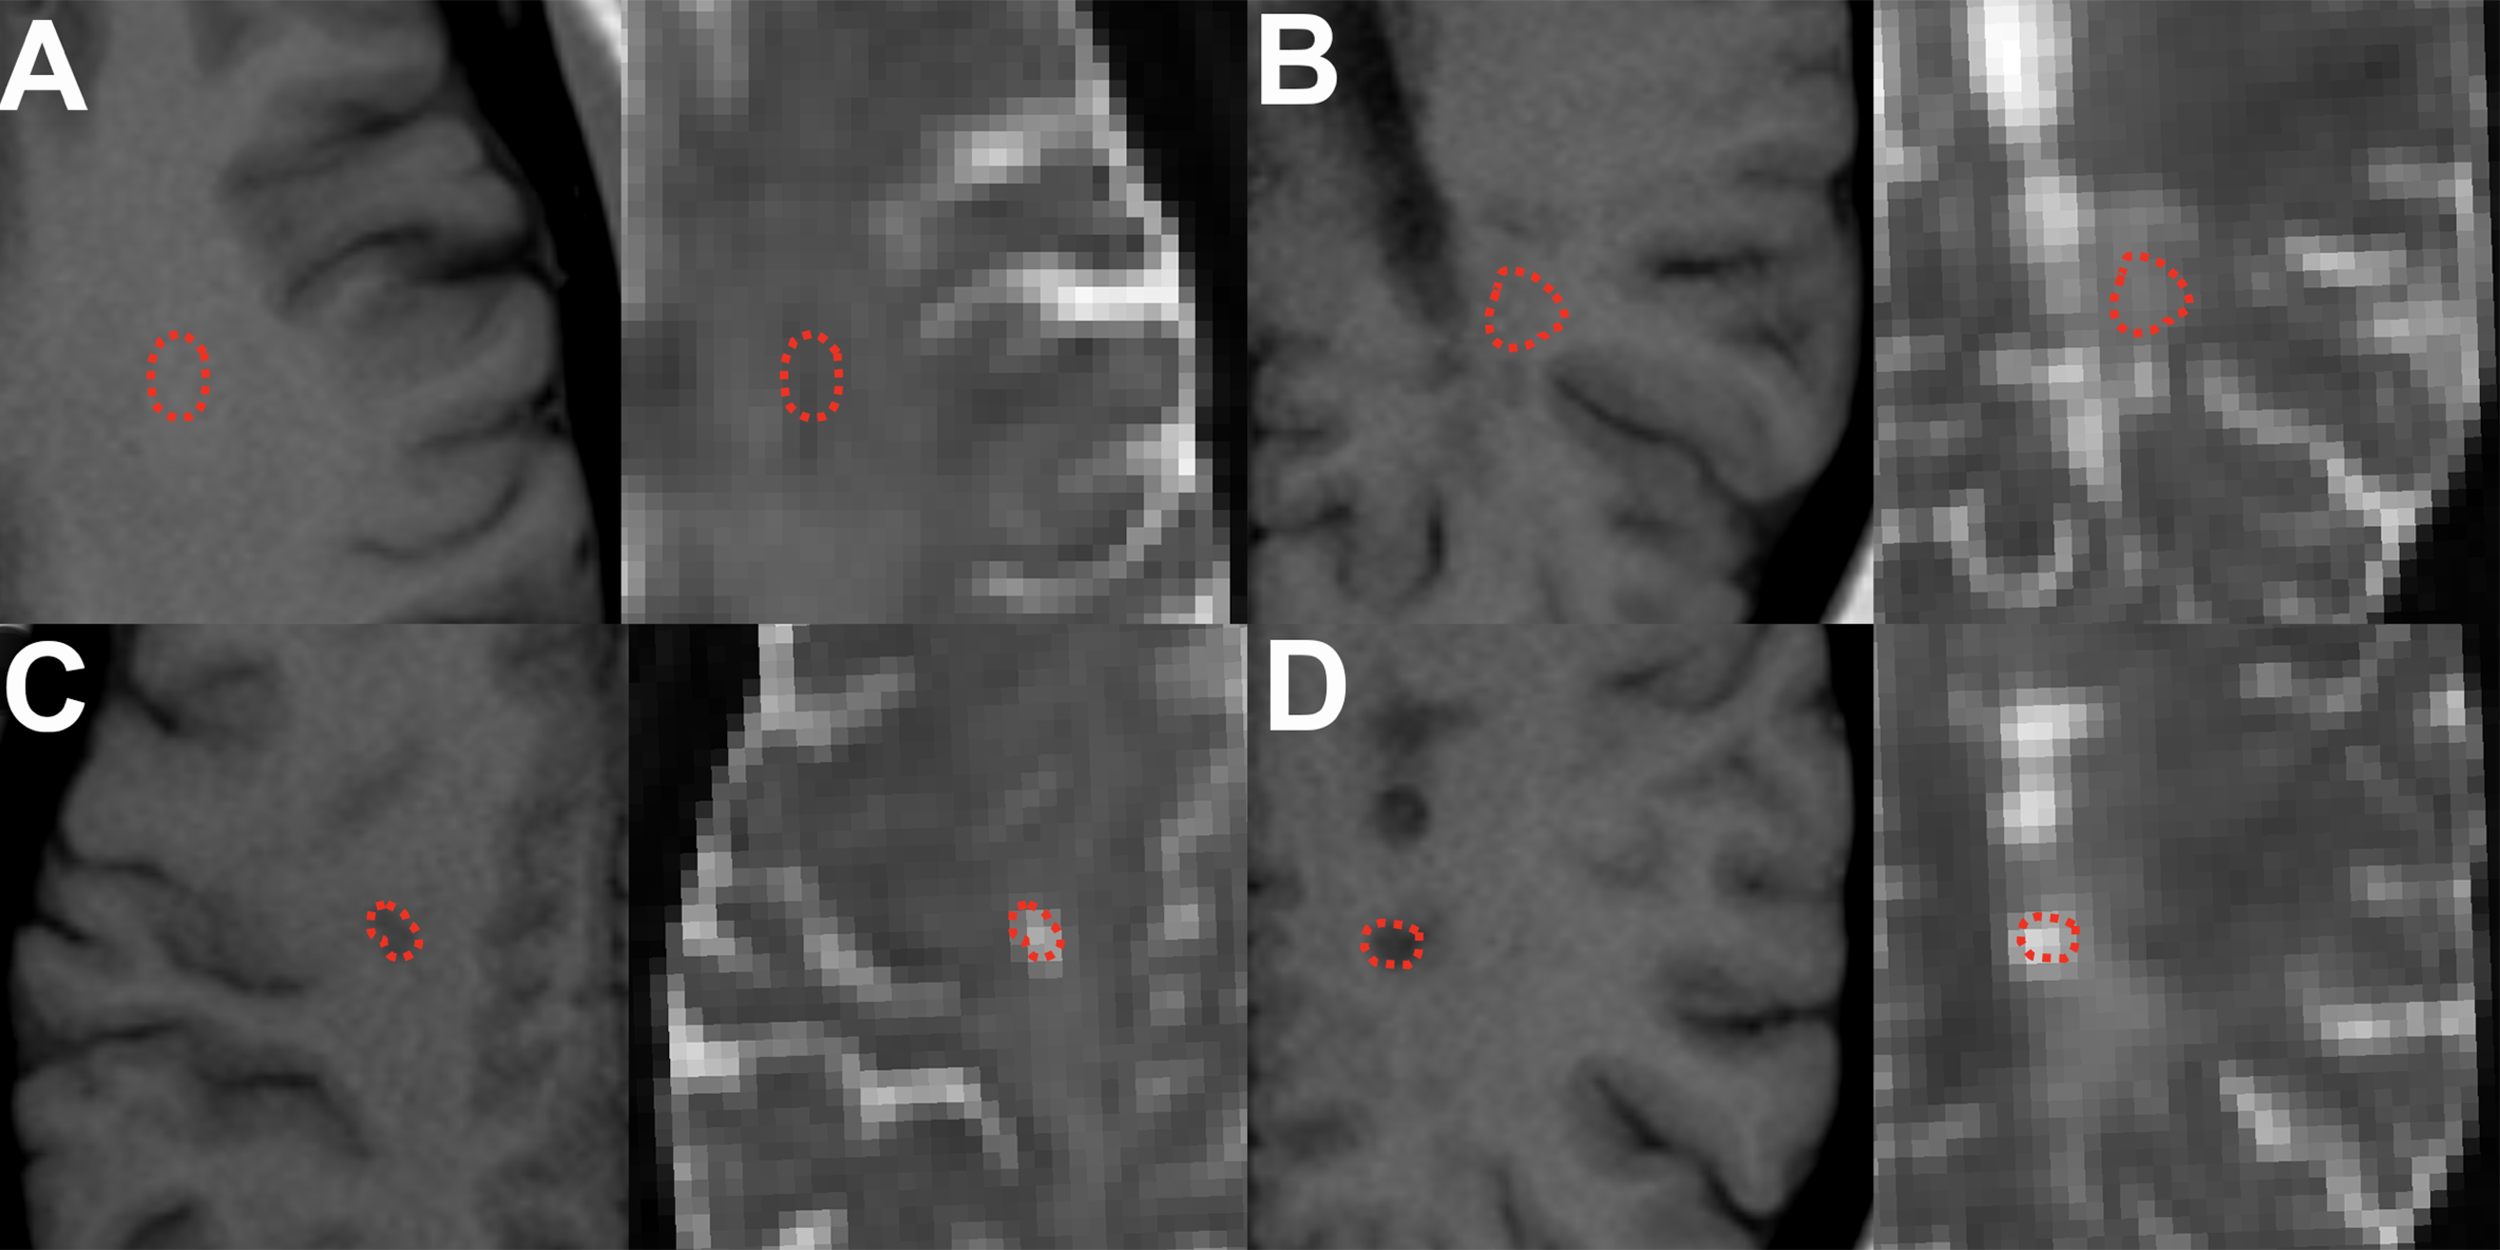
The local institutional review board approved a retrospective analysis of 3-T MRI diffusion data (1.69x1.69mm in-plane resolution, 3-mm slice-thickness, b = 0, 250, 1000, & 2000 s/mm2 along 84 diffusion directions, TR/TE = 3500/95ms) obtained in 54 patients with clinically-established RR-MS (39.7±7.6 yrs, 41 female) and 26 age-matched controls with normal MRI reports (40.6±13.1 yrs, 18 female). Diffusion data was co-registered to 1-mm isotropic volumetric T1-weighted images (MPRAGE: TR/TE/TI = 2100/2.72/900ms) and processed using DESIGNER8 to generate maps of mean, radial & axial diffusion (MD, RD & AD), fractional anisotropy (FA), mean, radial & axial kurtosis (MK, RK & AK), axonal water fraction (AWF), parallel & perpendicular extracellular diffusion (De-par & De-perp), and axonal diffusivity (Daxon) using the WMTI model5. Manual regions-of-interest (ROI) were drawn by a board-certified neuroradiologist on b=0-images using T1 reference images for white matter in healthy controls (N=26), normal-appearing white matter in RR-MS patients (NAWM, N=52) and FLAIR-bright RR-MS lesions with T1 signal intensity isointense to white matter (WM, N=37), gray matter (GM, N = 39) or CSF (N=31) (Figure 1). All ROIs were placed within the centrum semiovale to avoid region-specific variation in white matter microstructure. Only 1 ROI per type was obtained from each subject. Diffusion parameters were compared across lesions using 1-way ANCOVA controlled for age differences with posthoc Tukey multiple comparisons tests.RESULTS
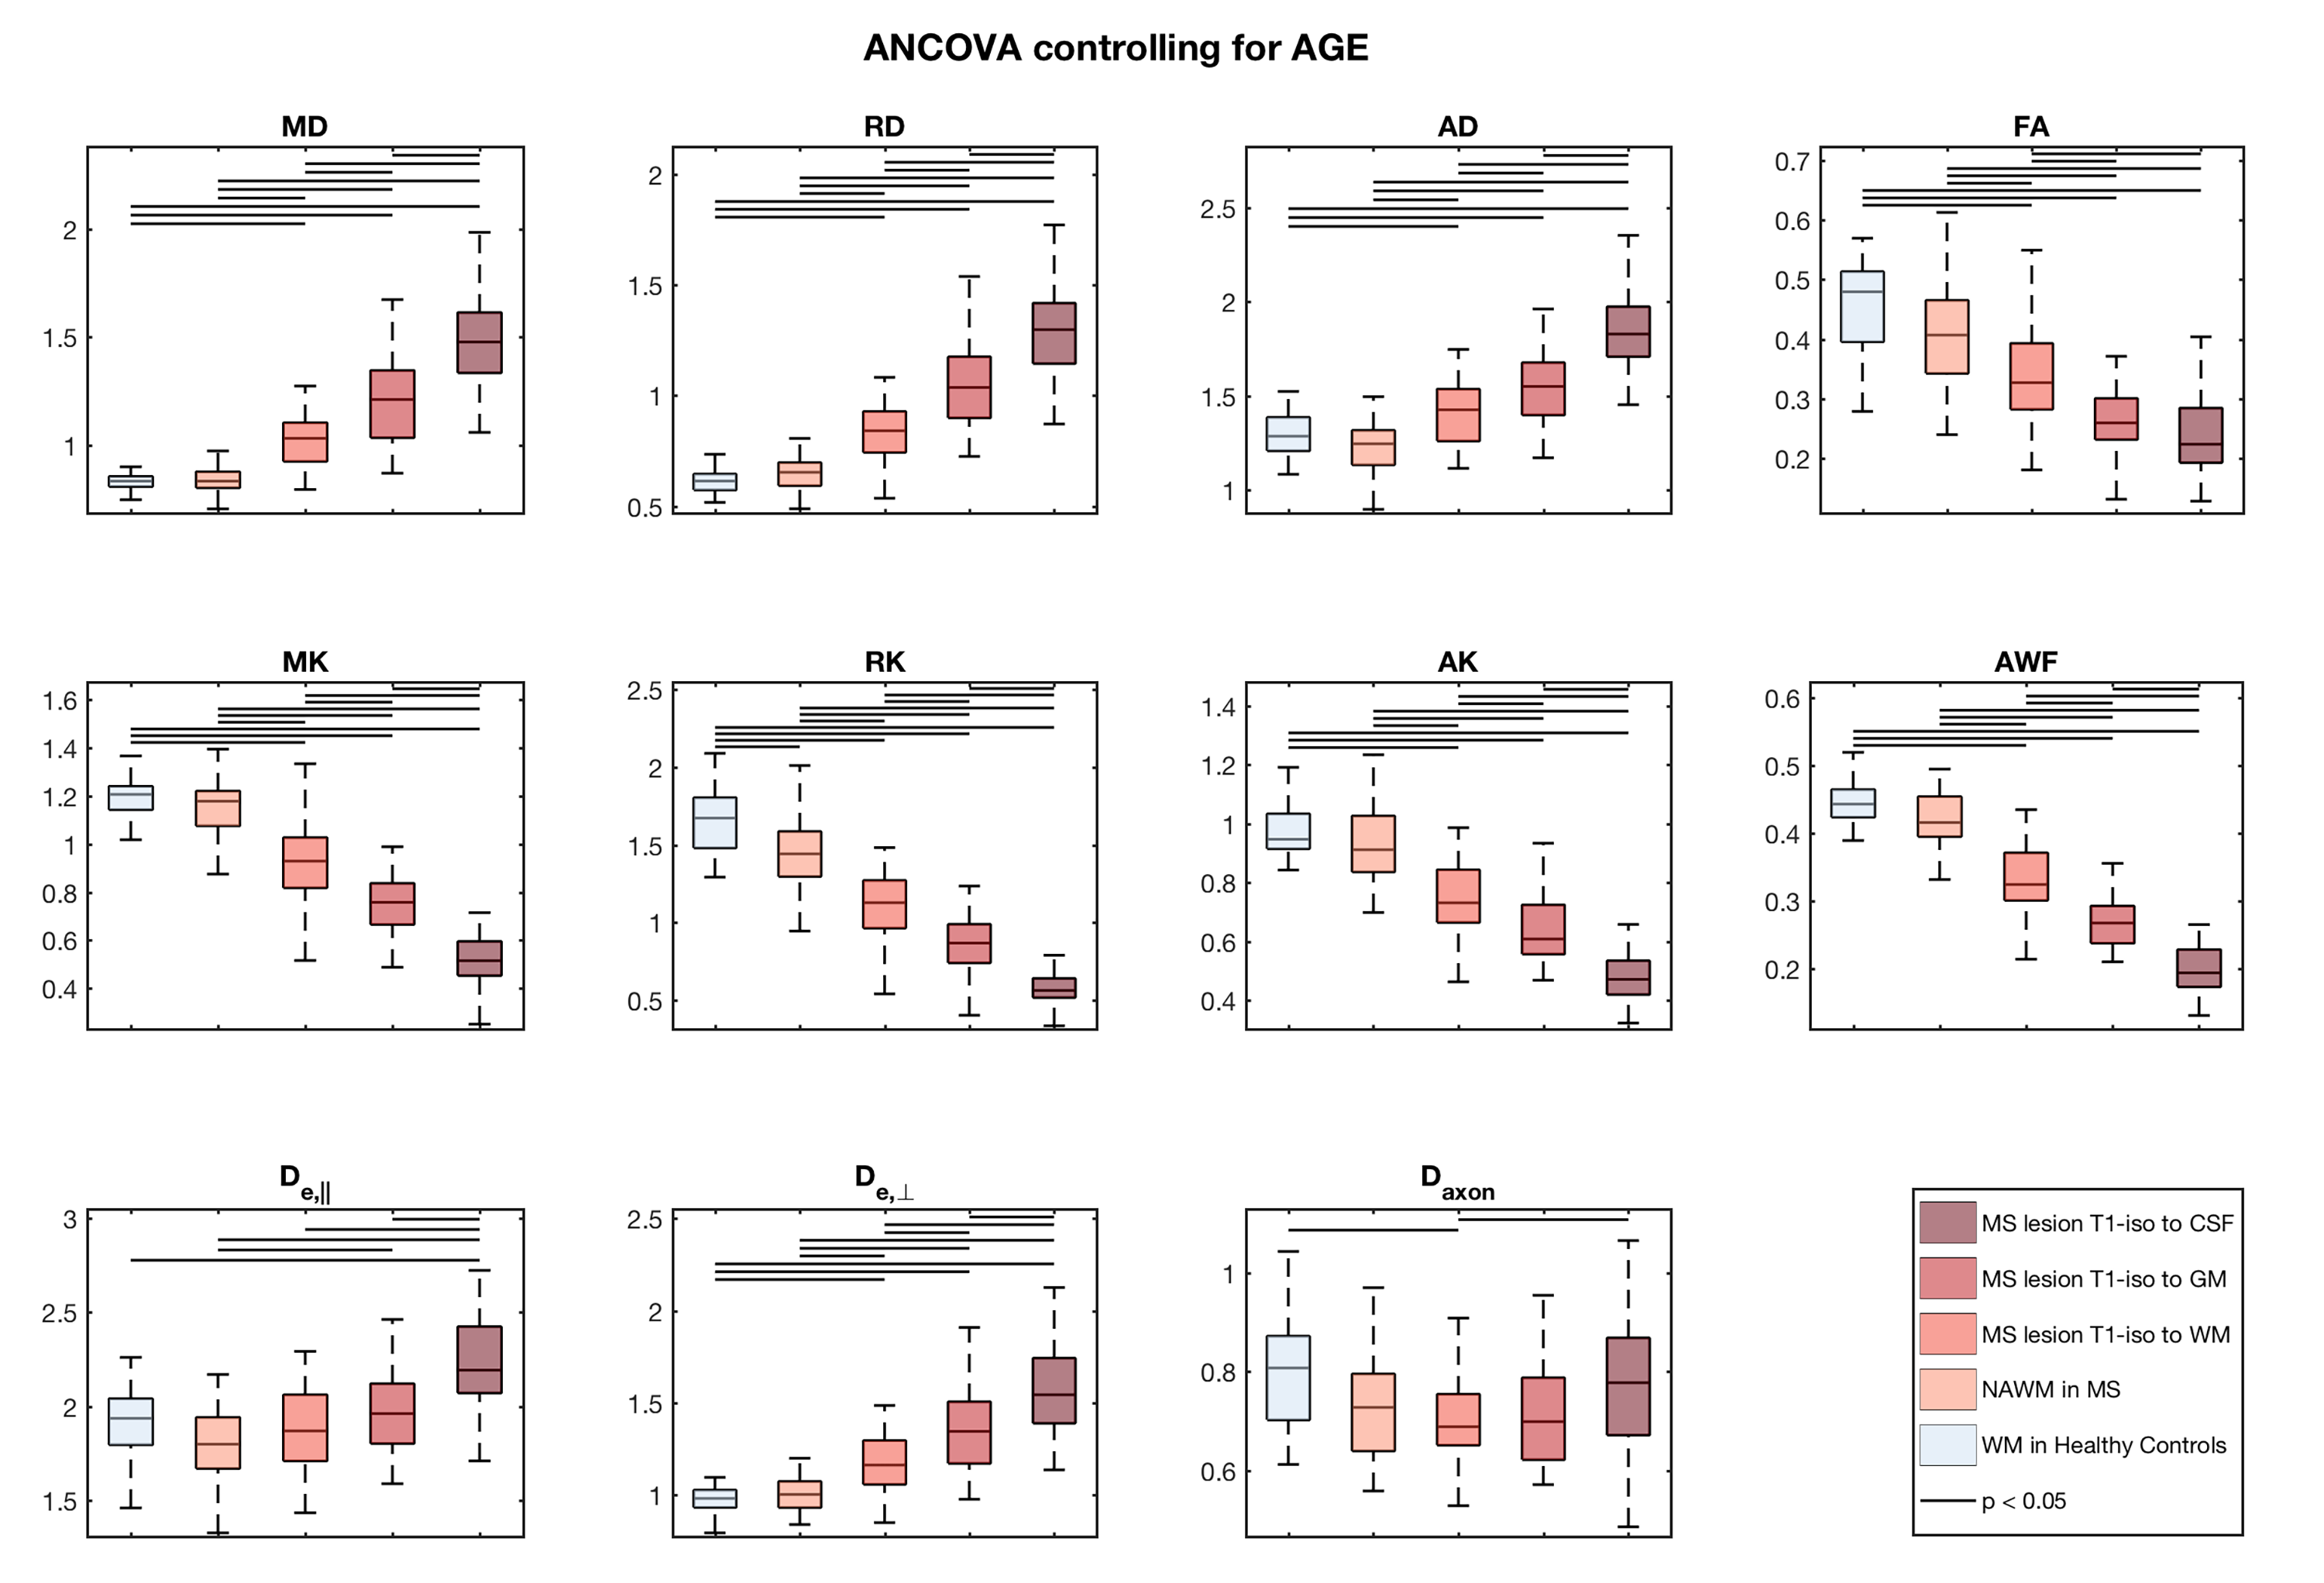
We observed a 13% reduction (P<0.05) in radial kurtosis (RK) between healthy controls and the NAWM of RR-MS patients, but no other significant differences. In FLAIR-bright RR-MS lesions, we observed statistically significant step wise increases for MD, AD, RD and De-perp, and step-wise decreases for MK, RK, AK and AWF (P<0.05)(Figure 2). FA also decreased with increasing T1 hypointensity (P<0.05), but did not differ between lesions T1 isointense to gray matter or CSF. De-par was not different for NAWM and FLAIR-bright T1 isointense lesions, but then increased with increasing T1 hypointensity (P<0.05). Axonal diffusivity in FLAIR-bright, T1 isointense lesions was decreased compared to control WM and lesions T1 isotense to CSF (P<0.05).DISCUSSION
Autopsy studies of RR-MS demonstrated that FLAIR-bright lesions represent inflammation, demyelination, axonal injury and gliosis, whereas FLAIR-bright lesions also with T1 hypointensity represented more severe injury and axonal loss4. Previous in vivo MRI of RR-MS patients have been less specific. Magnetization transfer MRI demonstrated decreased macromolecular content in T1 hypointense lesions, but did not discriminate between contributions from demyelination and axonal loss9. Mean diffusivity increases correlated with increasing T1 hypointensity, but were not specific to particular microstructure changes10. We also observed sensitive, but nonspecific progressive in vivo changes for all DTI and DKI parameters in RR-MS lesions with increasing T1 hypointensity. In cuprizone animal models of demyelination6-7, individual WMTI model parameters correlated more specifically with acute inflammation (Daxon), patchy demyelination (AWF), global demyelination (De-perp) and axonal loss (AWF) – we now observe similar results in this cross-sectional study of in vivo RR-MS patients. AWF changes (patchy demyelination & axonal loss) progressively increased with increasing T1 hypointensity, whereas De-perp changes (global demyelination) were only observed in the darker T1 lesions typically associated with chronicity and more fulminate tissue injury. Axonal diffusivity was only decreased significantly in FLAIR-bright RR-MS lesions T1-isointense to WM, which may reflect swelling or increased axonal tortuosity in a lesion dominated by the early pathological stages of inflammation. A potential limitation to this study is that the observed changes could also reflect breakdown in the assumptions of the WMTI model within destructive RR-MS lesions.CONCLUSION
The WMTI model provides potential specific and quantitative measures of the microstructure changes associated with RR-MS lesions graded in severity based on T1 signal intensity. This suggests the WMTI model has potential as an objective quantitative biomarker for specific underlying microstructure changes in RR-MS useful for monitoring disease progression and responses to disease-modifying therapies.Acknowledgements
No acknowledgement found.References
1. Lovblad et al. MRI in multiple sclerosis: Review and recommendations in current practice. AJNR 2010;31:983-989.
2. Rocca et al. The role of T1-weighted derived measures of neurodegeneration for assessing disability progression in multiple sclerosis. Front Neurol 2017;8:433.
3. Sahraian et al. Black holes in multiple sclerosis: Definition, evolution and clinical correlations. Acta Neurol 2010;122:1-8.
4. van Walderveen et al. Histopathologic correlate of hypointense lesions on T1-weighted spin-echo MRI in multiple sclerosis. Neurol 1998;50:1282-1288.
5. Fieremans et al. White matter characterization with diffusional kurtosis imaging. Neuroimage 2011;58:177-188.
6. Jelescu et al. In vivo quantification of demyelination and recovery using compartment-specific diffusion MRI metrics validated by electron microscopy. Neuroimage 2016;132:104-114.
7. Guglielmetti et al. Diffusion kurtosis imaging probes cortical alterations and white matter pathology following cuprizone induced demyelination and spontaneous remyelination. Neuroimage 2016;125:363-377.
8. http://www.diffusion-mri.com/software
9. Levesque et al. The role of edema and demyelination in chronic T1 black holes: A quantitative magnetization transfer study. JMRI 2005;21:103-110.
10. Nussbaum et al. Quantitative diffusion measurements in focal multiple sclerosis lesions: Correlations with appearance on T1-weighted MR images. AJR 2000;175:821-825.
Figures