5284
Multi-dimensional microstructural imaging offers novel in vivo insights into brain pathology: an application to multiple sclerosis1Danish Research Centre for Magnetic Resonance, Copenhagen University Hospital Hvidovre, Copenhagen, Denmark, 2Random Walk Imaging, AB, Lund, Sweden, 3Clinical Sciences, Lund, Department of Radiology, Lund University, Lund, Sweden, 4Division of Physical Chemistry, Department of Chemistry, Lund University, Lund, Sweden, 5Center for Magnetic Resonance, DTU Electrical Engineering, Technical University of Denmark, Kgs. Lyngby, Denmark, 6Department of Neurology, Copenhagen University Hospital Bispebjerg, Copenhagen, Denmark, 7Danish Multiple Sclerosis Center, Copenhagen University Hospital Rigshospitalet, Copenhagen, Denmark, 8Department of Applied Mathematics and Computer Science, Technical University of Denmark, Kgs. Lyngby, Denmark
Synopsis
Magnetic resonance imaging is today the most versatile imaging method for characterization of multiple sclerosis (MS) in vivo, but clinical examinations lack sensitivity to capture changes in the tissue microstructure. Using a multi-dimensional microstructural imaging approach, we demonstrate how it is possible to obtain more specific and broader microstructural insights about the underlying pathology of MS. For this we use a comprehensive battery of conventional and novel diffusion weighted imaging and quantitative MRI sequences each capable of explaining different and complementary microstructural properties. This allows us to explore the underlying pathology of MS, which is normally only accessible with histology.
Introduction
Multiple sclerosis (MS) is an autoimmune disease characterized by inflammatory processes leading to demyelination and neurodegeneration. Both demyelination and axonal degeneration occur in diffuse lesions throughout the central nervous system, but microstructural changes are also present in the normal appearing white matter (NAWM)1–3. Magnetic resonance imaging (MRI) is today the most versatile imaging method for characterization of MS in vivo, where structural imaging is used to detect the dynamic of MS lesions and to extract clinical measures such as the lesion number and volume4. Yet, the lesion pattern is weakly associated with clinical disability scores and poorly predicts disease progression5. Newer MRI technologies such as diffusion tensor imaging (DTI) improve the sensitivity but still lack in specificity to the underlying microstructural pathological alterations in MS. Using a multi-dimensional microstructural imaging approach, we demonstrate how it is possible to obtain more specific and broader microstructural insights about the underlying pathology of MS. For this we use a comprehensive battery of novel diffusion weighted imaging (DWI) and quantitative MRI (qMRI) sequences each capable of explaining different and complementary microstructural properties. This allows us to explore the underlying pathology of MS, which is normally only accessible with histology.Methods
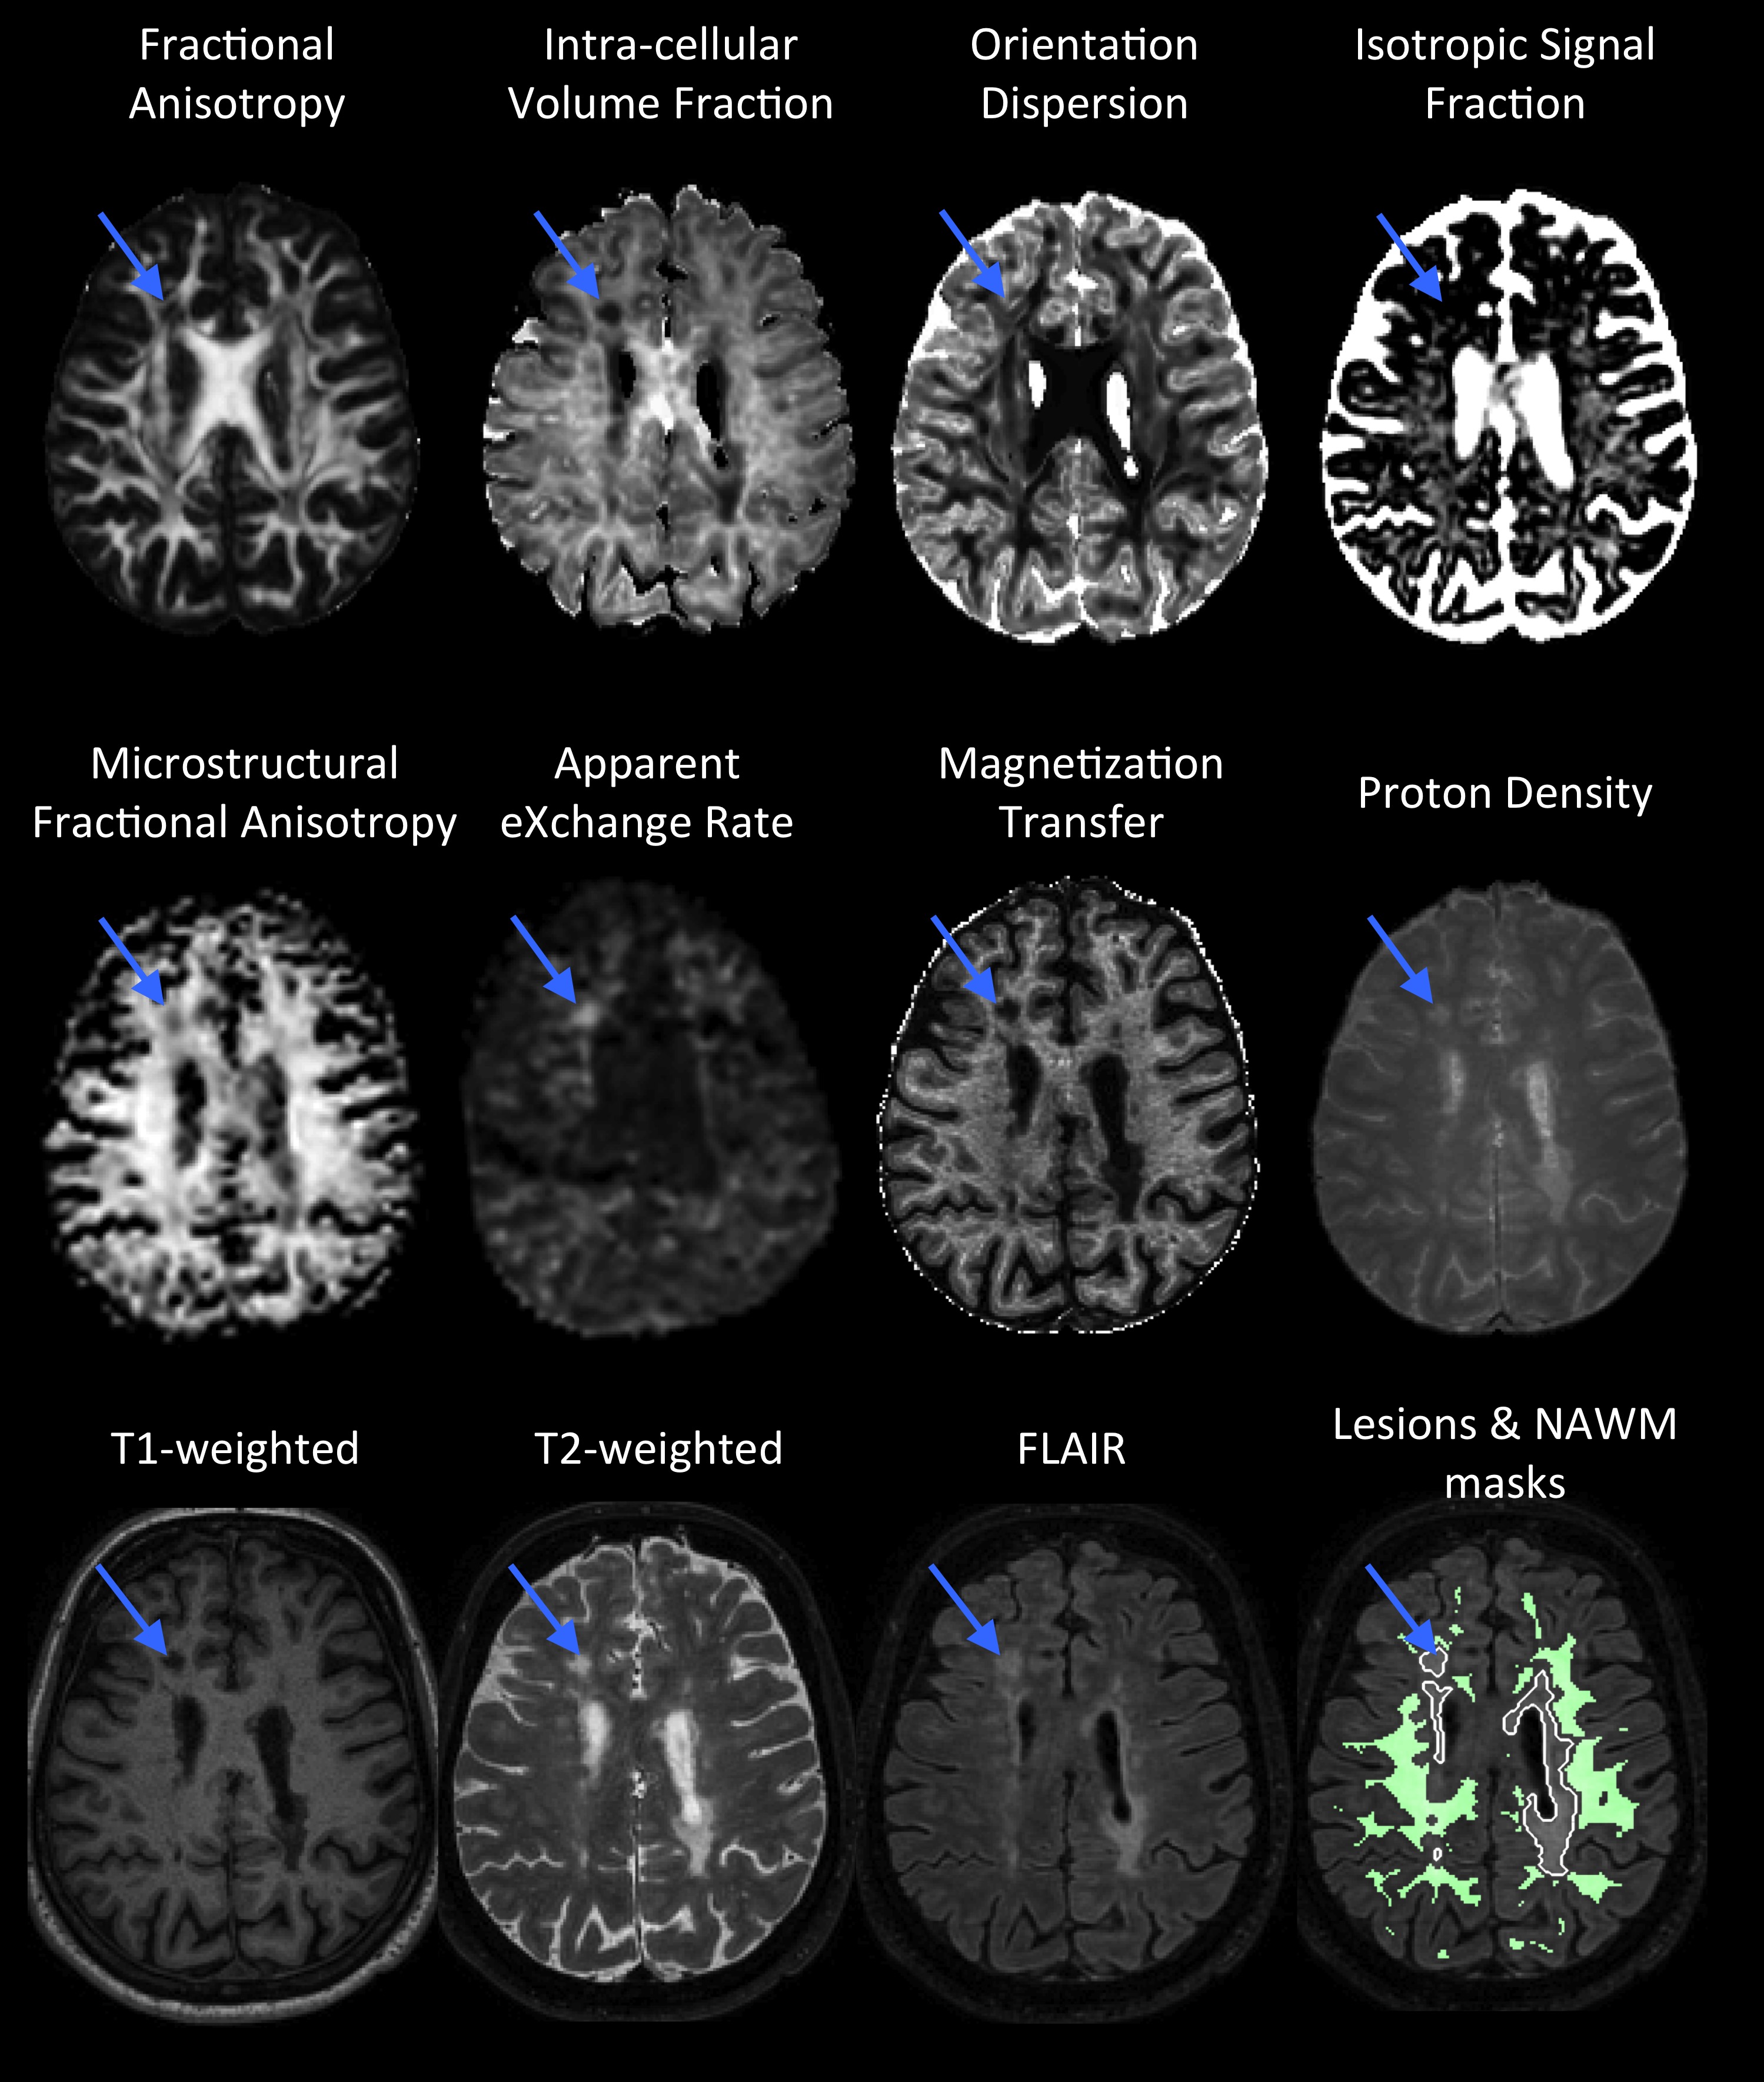
The comprehensive protocol of MR sequences includes (figure 1):
- Microscopic fractional anisotropy (µFA) mapping using magic angle spinning of the q-vector (qMAS)6. µFA is sensitive to cell shape or microscopic anisotropy7–9.
- Apparent exchange rate (AXR) mapping10 using filter exchange imaging (FEXI)11. AXR is sensitive to cell-membrane permeability.
- Intra-cellular volume fraction (ICVF - mostly sensitive to axon density), orientation dispersion (OD - reflecting the architectural axonal organization), and isotropic signal fraction (ISOSF) mapping using multi-shell DWI and the NODDI model12.
- Fractional anisotropy (FA) mapping using DTI13.
- Magnetization transfer (MT) and proton density (PD) mapping using qMRI14. MT is sensitive to myelin content and PD is sensitive to mobile moities.
- Conventional structural scans (T1w, T2w, and FLAIR) were used for manual delineation of MS lesions and segmentation of white matter (WM).
While the conventional approaches allow for detecting the underlying pathology, the novel diffusion weighting and quantitative approaches might provide increased sensitivity to different microstructural features. A combination of the large array of approaches used in this study then allows for a nuanced view into the diseased tissue microstructure.
Thirty MS patients and 17 healthy controls (HC) were included. In the MS group, FLAIR hyperintense lesions were manually delineated. WM was segmented using FreeSurfer. In MS, lesions were masked from the WM ROIs. ROIs were then eroded by 2 voxels to reduce partial volume effects. All parameter maps were co-registered to the structural T1w-image and average parameters were extracted in HC WM (HC-WM), MS NAWM (MS-NAWM), and MS lesions (MS-L). Group-differences were evaluated using 2-sample T-tests.
Results and Discussion
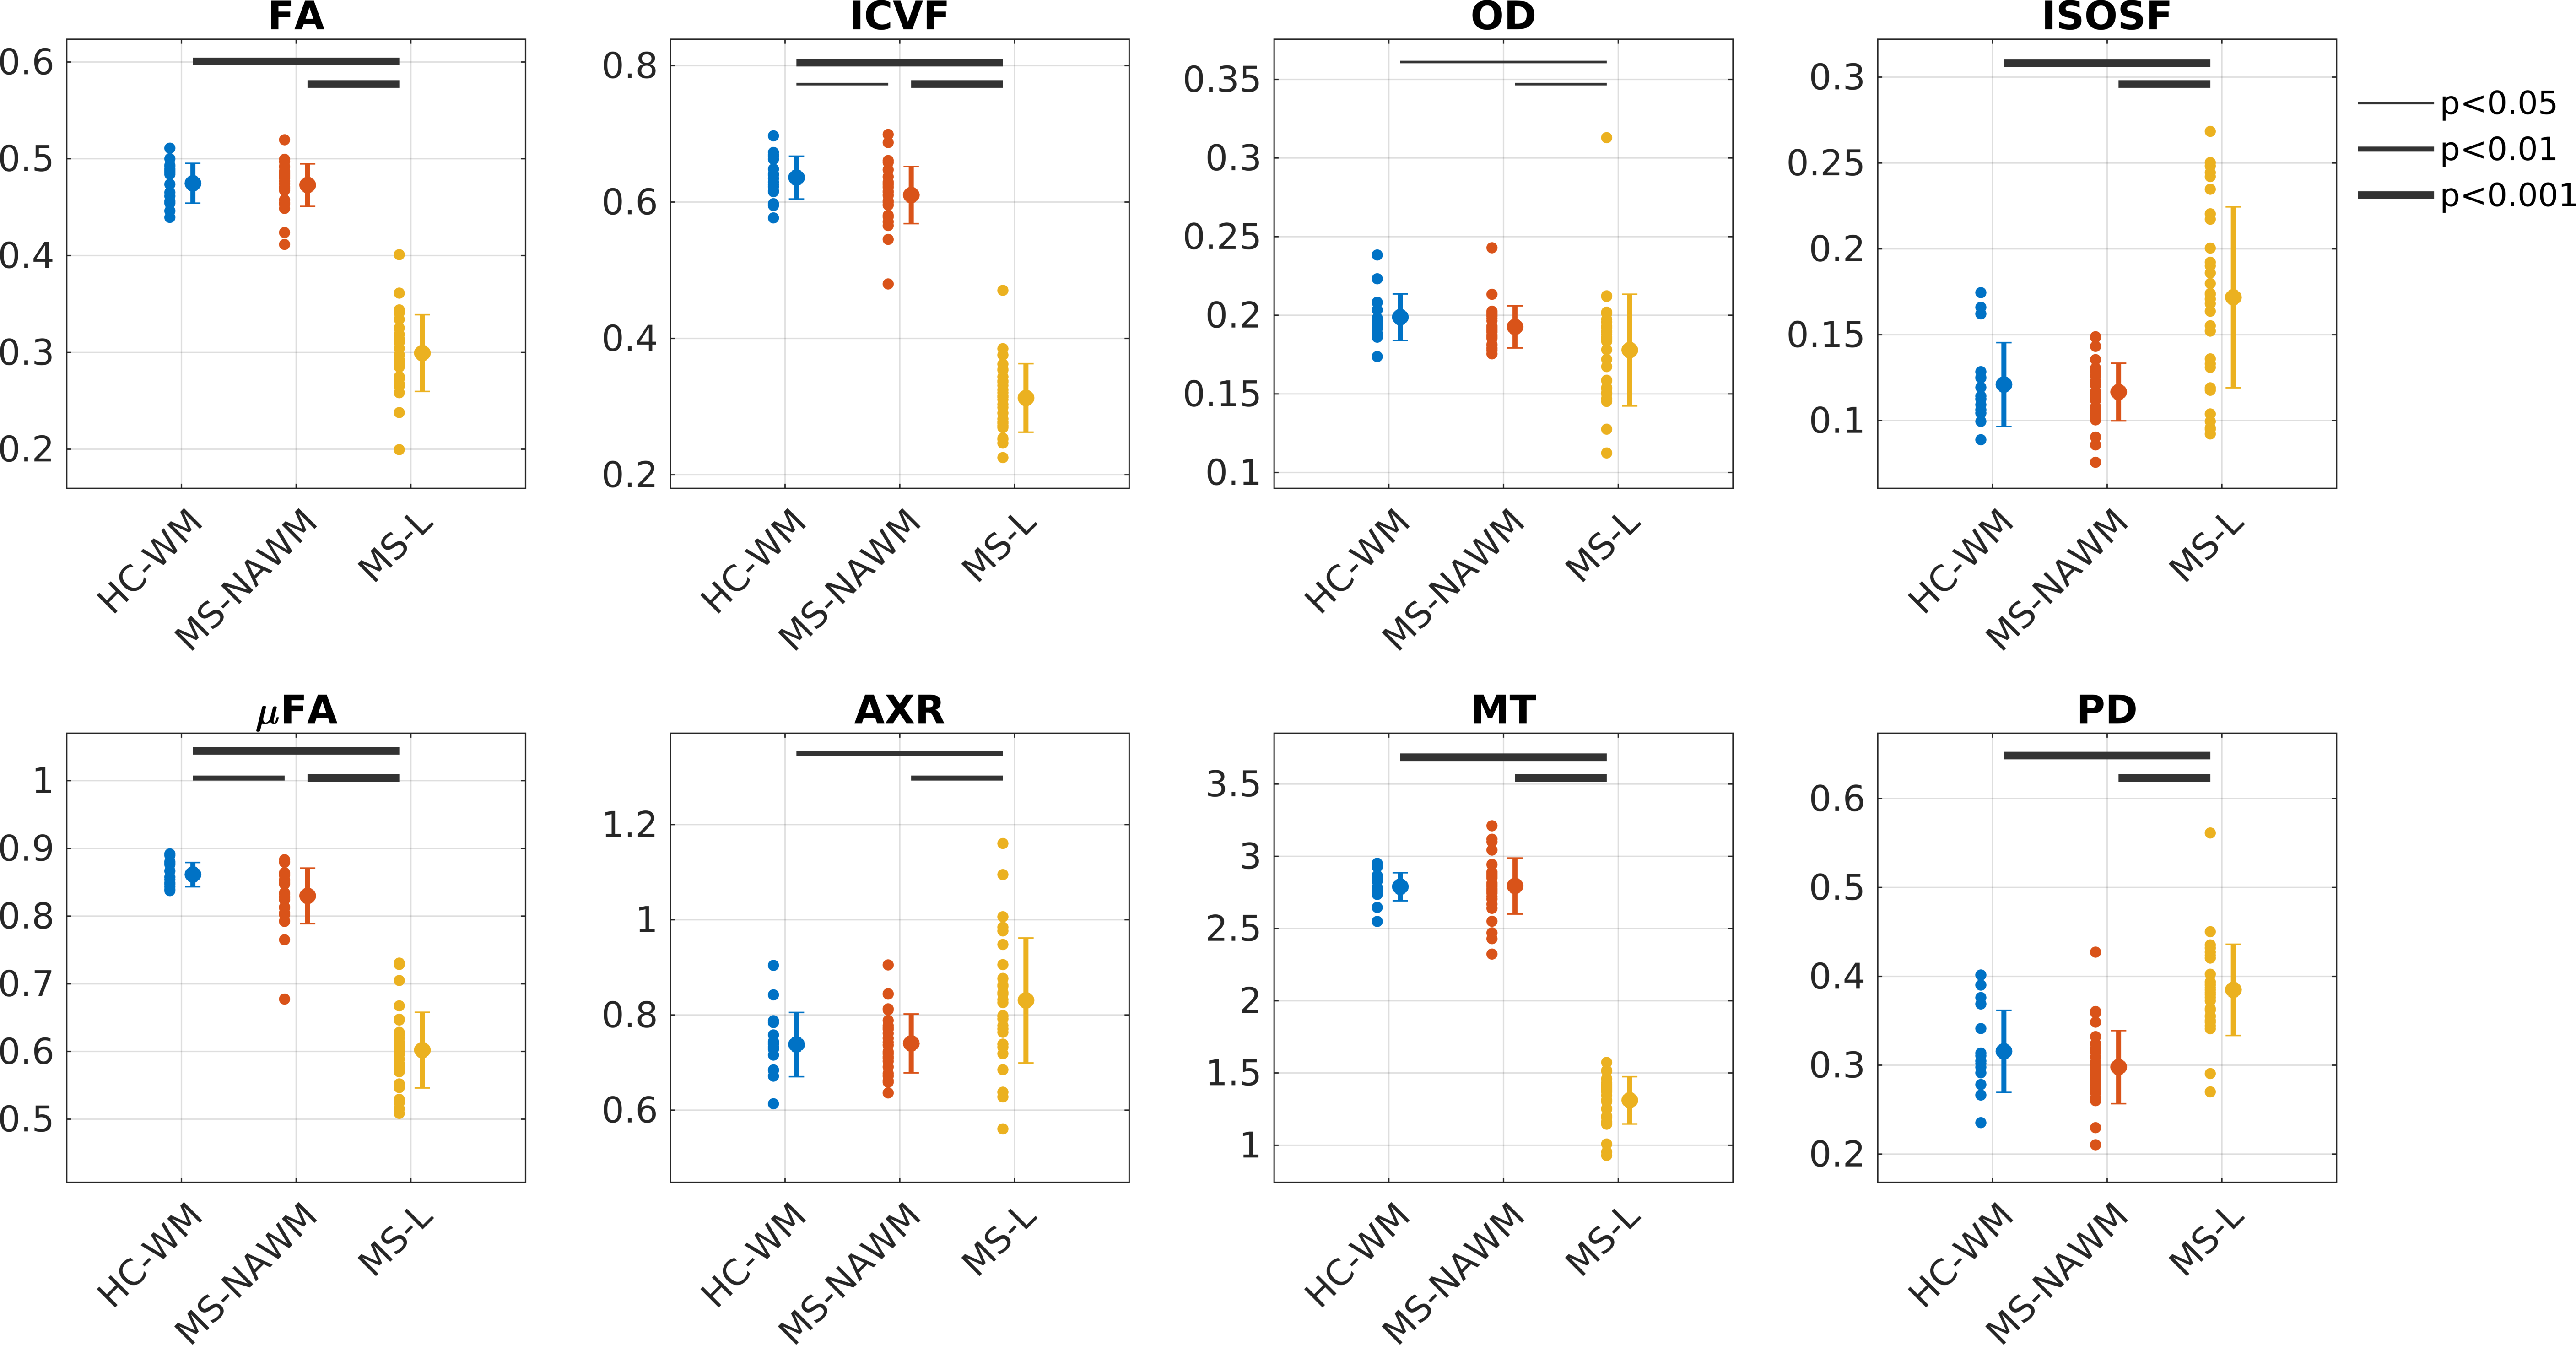
Figure 2 plots the group average (standard deviation) as well as significance levels in the group comparisons.
MS-NAWM was associated with lower µFA and ICVF compared to HC-WM, while the other parameters were not significantly different between groups. This is consistent with histology showing that diffuse axonal damage (i.e decreased axonal density) is the dominant pathology occurring in MS-NAWM1,15. In MS-NAWM, primary demyelination is sparse, but myelin damage is a consequence of axonal damage1. This is also reflected in our multi-dimensional data, which shows no reduction in the myelin-sensitive parameter (MT) and no changes in permeability (AXR). However, a larger spread in MT was found in MS-NAWM compared with HC-WM.
In MS-lesions all parameters were significantly different from HC-WM and MS-NAWM.
Myelination: As expected, myelination (MT) was decreased in lesions. Increased AXR suggests increased cell permeability due to demyelinated axons or/and increasing number of glial cells in lesions1. Decrease in FA indicates a more isotropic compartment, but the µFA of 0.6 suggests that a fraction of demyelinated axons remain present in the lesions.
Axonal density: ICVF is clearly reduced compared with NAWM suggesting significant neurodegeneration. Less axonal dispersion (OD) was found in lesions, which could be due to less crossing fibers due to neurodegeneration or systematic degeneration of a specific axonal size population16. In general, it is expected that free water is increased in MS-lesions, which is supported by higher ISOSF and PD as well as lower FA.
Conclusion
Conventional scans, used in clinical examinations of MS, are sensitive to brain tissue changes, but less specific to features of tissue microstructure. The combination of qMRI and DWI gives a complementary view of brain pathology, currently only offered by post-mortem examinations. By using multi-dimensional imaging, and tracking changes over time, potentially allow for better diagnosis and treatment of patients.Acknowledgements
Funding:
- Danish Multiple Sclerosis Society (A31910 and A27996).
- VINNMER Marie Curie Industry Outgoing grant (nr. 013-04350).
References
1. Kutzelnigg, A. & Lassmann, H. Pathology of multiple sclerosis and related inflammatory demyelinating diseases. Handbook of Clinical Neurology 122, (Elsevier B.V., 2014).
2. Lassmann, H. Review: the architecture of inflammatory demyelinating lesions: implications for studies on pathogenesis. Neuropathol. Appl. Neurobiol. 37, 698–710 (2011).
3. van Horssen, J. et al. Clusters of activated microglia in normal-appearing white matter show signs of innate immune activation. J. Neuroinflammation 9, 156 (2012).
4. Miller, D. H., Altmann, D. R. & Chard, D. T. Advances in imaging to support the development of novel therapies for multiple sclerosis. Clin. Pharmacol. Ther. 91, 621–34 (2012).
5. Poloni, G., Minagar, A., Haacke, E. M. & Zivadinov, R. Recent developments in imaging of multiple sclerosis. Neurologist 17, 185–204 (2011).
6. Lasič, S., Szczepankiewicz, F., Eriksson, S., Nilsson, M. & Topgaard, D. Microanisotropy imaging: quantification of microscopic diffusion anisotropy and orientational order parameter by diffusion MRI with magic-angle spinning of the q-vector. Front. Phys. 2, 1–14 (2014).
7. Szczepankiewicz, F. et al. Quantification of microscopic diffusion anisotropy disentangles effects of orientation dispersion from microstructure: Applications in healthy volunteers and in brain tumors. Neuroimage 104, 241–252 (2015).
8. Jespersen, S. N., Lundell, H., Sønderby, C. K. & Dyrby, T. B. Orientationally invariant metrics of apparent compartment eccentricity from double pulsed field gradient diffusion experiments. NMR Biomed. 26, 1647–1662 (2013).
9. Szczepankiewicz, F. et al. The link between diffusion MRI and tumor heterogeneity: Mapping cell eccentricity and density by diffusional variance decomposition (DIVIDE). Neuroimage 142, 522–532 (2016).
10. Lasič, S., Nilsson, M., Lätt, J., Ståhlberg, F. & Topgaard, D. Apparent exchange rate mapping with diffusion MRI. Magn. Reson. Med. 66, 356–365 (2011).
11. Nilsson, M. et al. Noninvasive mapping of water diffusional exchange in the human brain using filter-exchange imaging. Magn. Reson. Med. 69, 1572–80 (2013).
12. Zhang, H., Schneider, T., Wheeler-Kingshott, C. a & Alexander, D. C. NODDI: practical in vivo neurite orientation dispersion and density imaging of the human brain. Neuroimage 61, 1000–16 (2012).
13. Basser, P. J. & Jones, D. K. Diffusion-tensor MRI: theory, experimental design and data analysis - a technical review. NMR Biomed. 15, 456–67 (2002).
14. Helms, G., Dathe, H., Kallenberg, K. & Dechent, P. High-resolution maps of magnetization transfer with inherent correction for RF inhomogeneity and T1 relaxation obtained from 3D FLASH MRI. Magn. Reson. Med. 60, 1396–407 (2008).
15. Seewann, A. et al. Diffusely Abnormal White Matter in Chronic Multiple Sclerosis. Arch. Neurol. 66, 601–609 (2009).
16. DeLuca, G. C., Ebers, G. C. & Esiri, M. M. Axonal loss in multiple sclerosis: A pathological survey of the corticospinal and sensory tracts. Brain 127, 1009–1018 (2004).
Figures