5281
Mismatch Between Cerebral Glucose and Oxygen Metabolisms in Young Adults with Relapsing-Remitting Multiple Sclerosis1Radiology, Stony Brook University Hospital, Stony Brook, NY, United States, 2Biomedical Engineering, Stony Brook University, Stony Brook, NY, United States, 3Neurology, New York University Medical Center, New York, NY, United States, 4Psychiatry, Stony Brook University Hospital, Stony Brook, NY, United States
Synopsis
Oxidative stress has been linked to neuroinflammation that leads to demyelination in multiple sclerosis (MS). While most studies focus on older MS patients, the underlying cause of oxidative stress at this stage of the disease may be obscured. In this study, cerebral metabolic rates of oxygen and glucose in young adult relapsing-remitting MS patients were measured with simultaneous PET/MRI. Several brain regions, most associated with the corticostriatal pathway, exhibited increased oxygen metabolism and decreased glucose metabolism in young MS patients when compared to healthy controls. These observations may elucidate the mechanism for mitochondrial dysfunction and neuroinflammation in MS pathophysiology.
Introduction:
Multiple sclerosis (MS) is the largest cause of disability in young adults1. The neuroinflammation that leads to demyelination in MS has been associated with increased oxidative stress2. While most existing studies have focused on MS patients over 30 years old, little attention has been paid to potential different pathophysiologic response of MS in young adults. In this study, abnormal brain metabolism in MS patients was investigated with simultaneous MRI and PET measurement. Quantitative BOLD (qBOLD) approach3, combined with brain perfusion measurement by pseudo-continuous ASL (pCASL) 3D-GRASE, provides a non-invasive measurement of cerebral metabolic rate of oxygen (CMRO2)4. The MRI-derived CMRO2 values were correlated with metabolic rate of glucose (MRGlu) values measured from quantitative 18F-FDG PET.Methods:
Ten healthy controls (5F, 22.2±2.0 years old) and 4 relapsing-remitting MS patients (2F, 25.3±5.3 years old, 1.5±0.6 EDSS, 7.0±3.1 years disease duration) were recruited for this IRB-approved study. Simultaneous PET/MRI quantification of brain metabolism was performed on Siemens 3T Biograph mMR with a 12-channel head coil. MRI parameters for 2D qBOLD were: FOV of 256×256mm2; voxel size of 2×2×4mm3; 5 interleaved 4mm slices with 100% spacing; TR of 1000ms; 4 repetitions with total acquisition time of ~8 minutes. Navigator echoes were inserted to correct B0 drifting during the scan. pCASL with background suppression and segmented echo-shifting 3D-GRASE acquisition was implemented for CBF quantification8. The labeling time was 1600ms with a post-labeling delay of 1400ms. Other parameters for ASL sequence were: voxel size of 3×3×3mm3; matrix of 64×48×28; 3PAR× 2PE segmentation scheme; echo train duration of 21ms; 120° refocusing RF pulse; TR of 4sec; total acquisition time of ~7min (16 label/control pairs). The MR qBOLD data was processed individually before the estimated maps were averaged to calculate oxygen extraction fraction (OEF). CBF maps were calculated using ASLtoolbox5. CMRO2 was subsequently calculated from the product of CBF and OEF. Standard dynamic quantitative 18F-FDG-PET protocol ran simultaneously with the MRI. Two IV catheters were inserted into the subject’s upper limbs. One was used to inject ~5mCi of FDG when patient was on the MRI scanner table. The other was used to obtain venous blood samples to measure glucose levels at 45 mins after injection. Total PET acquisition time was 60min. MRGlu, CBF, and CMRO2 measurements in controls and patients were compared in 16 cortical and sub-cortical grey matter (GM) regions6.Results:
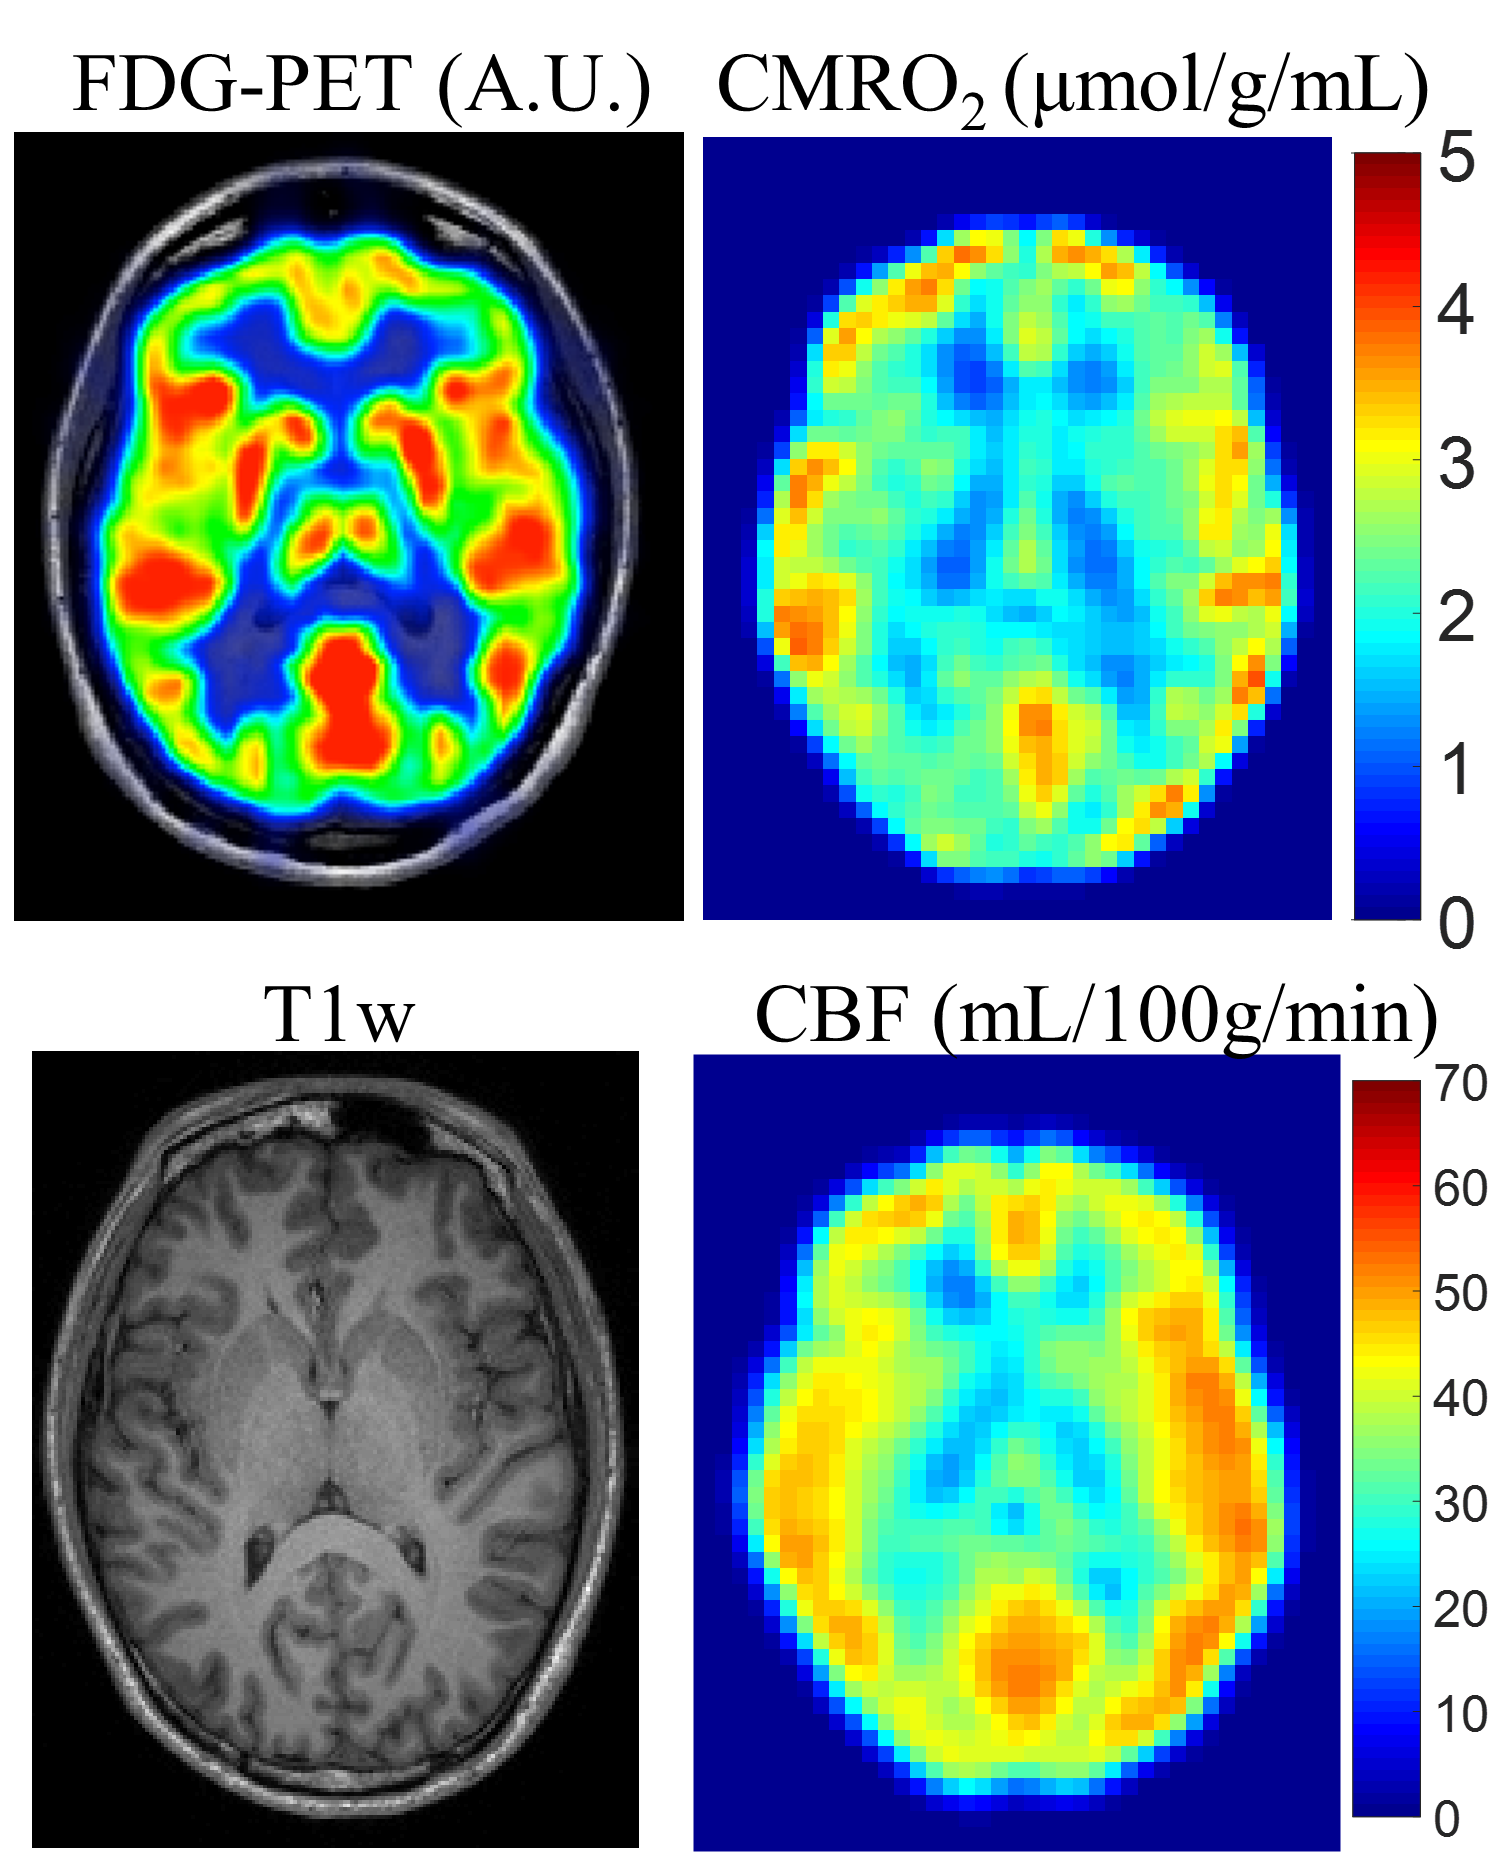
Figure 1 shows the 18F-FDG-PET, CMRO2 and CBF maps along with the corresponding T1w image from a representative healthy control. In general, oxygen and glucose metabolism show good overall agreement. MS patients exhibited lower average correlation for MRGlu and CMRO2 compared to healthy controls (r = 0.17 vs 0.40). The young adult MS patients in this study displayed a global reduction of MRGlu and global increase in both CBF and CMRO2.
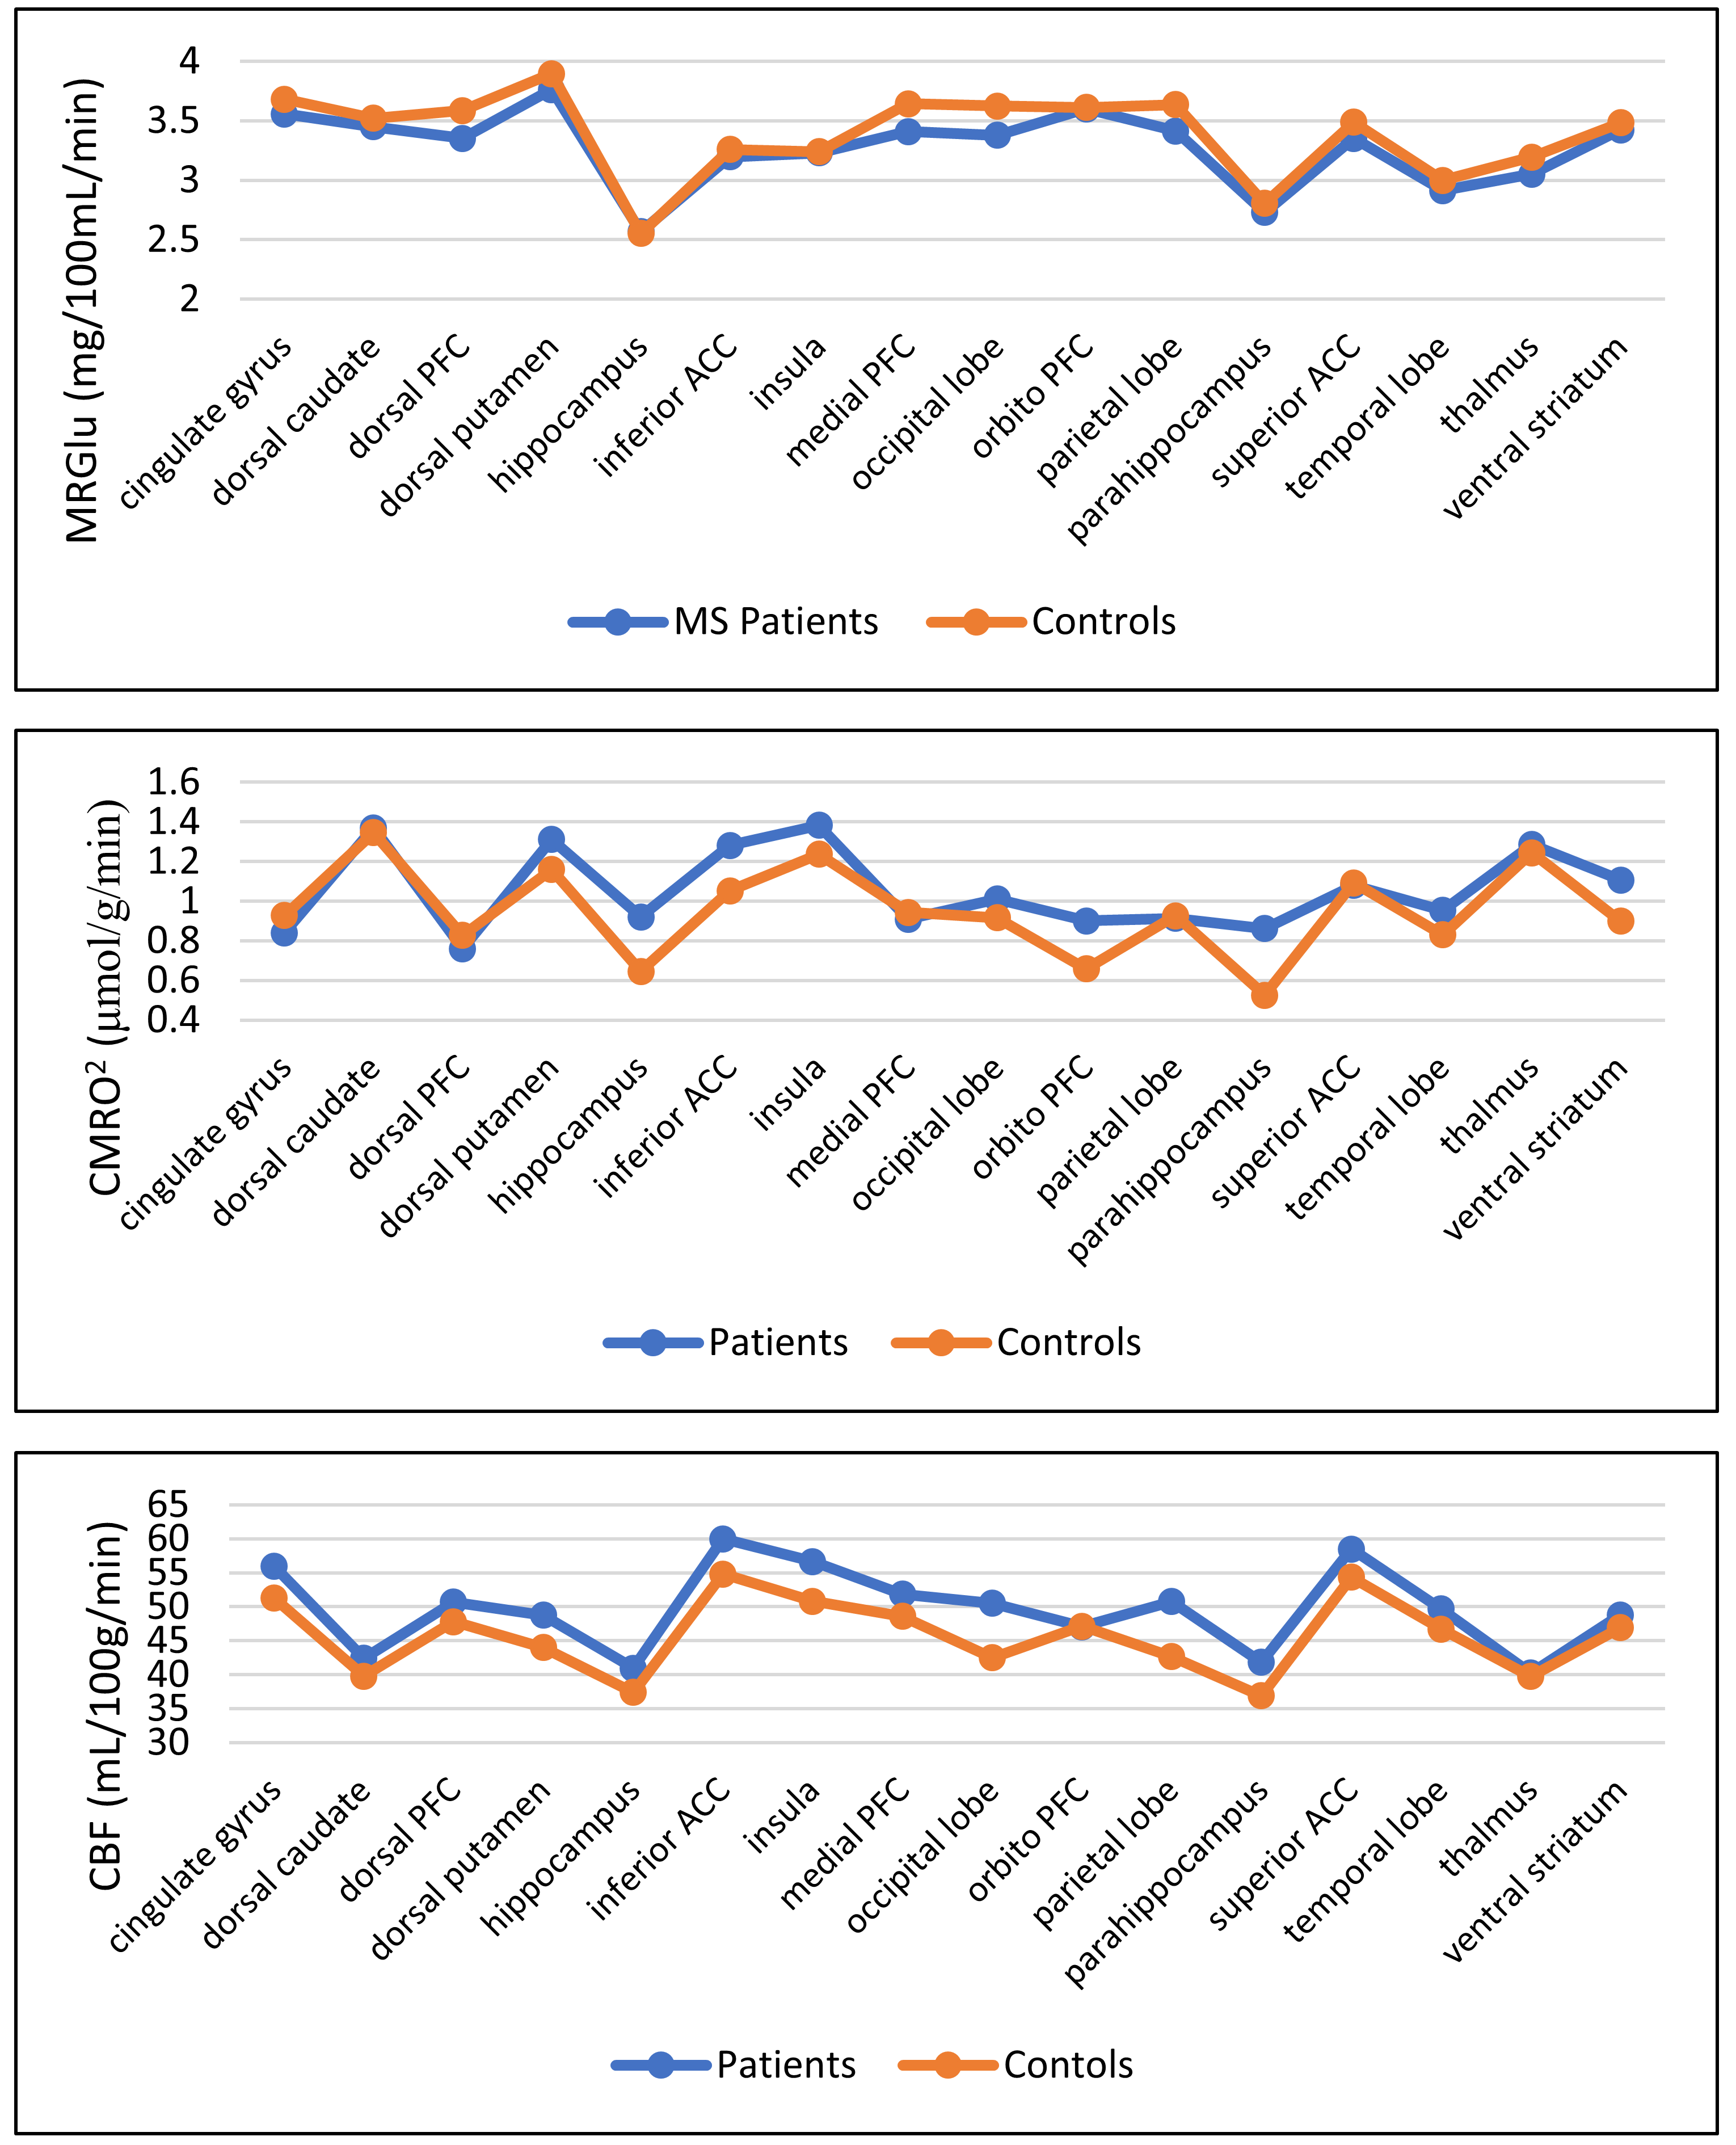
The average CBF, CMRO2 and MRGlu for the 10 healthy subjects and 4 young adult MS patients in the 16 GM regions are displayed in Fig. 2. Six regions demonstrated a mismatch of increased oxygen metabolism with decreased glucose metabolism between MS patients and healthy controls; most of these regions are part of the corticostriatal pathway. The dorsal striatum showed increased CMRO2 in patients while MRGlu was decreased. A similar trend occurred in the inferior anterior cingulate cortex, medial pre-frontal, parahippocampus, temporal lobe and ventral striatum. Only the cingulate gyrus and dorsolateral pre-frontal cortex exhibited a decrease in both CMRO2 and MRGlu when compared to healthy controls.
Discussion:
This study investigated cerebral metabolic differences in oxygen and glucose between young adult MS patients and healthy controls. Overall, good agreement was shown between CMRO2 and MRGlu with healthy subjects demonstrating greater correlation between the two metabolic rates. The discrepancy between oxygen and glucose metabolism in MS patients may result from a failure of cerebral metabolic regulation mechanisms7. The cerebral metabolism differences were shown to arise from increased oxygen metabolism and decrease glucose metabolism in young adult MS patients. This may suggest potential mitochondrial dysfunction causing reduced efficiency of oxygen utilization, production of excessive reactive oxygen species and elevated oxidative stress8. Most of the regions that demonstrated this metabolic mismatch are part of the corticostriatal pathway. Multiple studies have identified deficiencies in this network in patients with MS9,10.Conclusion:
In young adult MS patients, increased CMRO2 in GM regions is coupled with reduced MRGlu. Compared to previous studies of older MS patients, young adult MS patients showed increased CBF and CMRO2. These observations may elucidate the mechanism for mitochondrial dysfunction and neuroinflammation in young adult MS that leads to demyelination.Acknowledgements
No acknowledgement found.References
1. Frohman EM. Multiple sclerosis. Medical Clinics of North America. 2003;87(4):867-897.
2. Gilgun-Sherki Y, Melamed E, Offen D. The role of oxidative stress in thepathogenesis of multiple sclerosis: The need for effectiveantioxidant therapy. Journal of Neurology. 2004;251(3):261-268.
3. He X, Yablonskiy DA. Quantitative BOLD: Mapping of human cerebral deoxygenated blood volume and oxygen extraction fraction: Default state. Magnetic Resonance in Medicine. 2007;57(1):115-126.
4. Yablonskiy DA, Sukstanskii AL, He X. Blood oxygenation level‐dependent (BOLD)‐based techniques for the quantification of brain hemodynamic and metabolic properties–theoretical models and experimental approaches. NMR in Biomedicine. 2013;26(8):963-986.
5. Wang Z, Aguirre GK, Rao H, et al. Empirical optimization of ASL data analysis using an ASL data processing toolbox: ASLtbx. Magnetic resonance imaging. 2008;26(2):261-269.
6. Fischl B. FreeSurfer. Neuroimage. 2012;62(2):774-781.
7. Dutta R, McDonough J, Yin X, et al. Mitochondrial dysfunction as a cause of axonal degeneration in multiple sclerosis patients. Annals of neurology. 2006;59(3):478-489.
8. Haider L, Fischer MT, Frischer JM, et al. Oxidative damage in multiple sclerosis lesions. Brain. 2011;134(7):1914-1924.
9. Cui F, Zhou L, Wang Z, et al. Altered Functional Connectivity of Striatal Subregions in Patients with Multiple Sclerosis. Frontiers in Neurology. 2017;8:129.
10. Centonze D, Muzio L, Rossi S, et al. Inflammation triggers synaptic alteration and degeneration in experimental autoimmune encephalomyelitis. Journal of Neuroscience. 2009;29(11):3442-3452.
Figures