5280
Indirect assessment of cerebral metabolism in deep grey matter areas of progressive multiple sclerosis subjects – preliminary results1Neurology, OREGON HEALTH & SCIENCE UNIV, Portland, OR, United States, 2Advanced Imaging Research Center, OREGON HEALTH & SCIENCE UNIV, Portland, OR, United States
Synopsis
Mitochondrial injury and impaired metabolic capacity are hypothesized to drive neurodegeneration in multiple sclerosis (MS). Here, we investigate a novel putative marker of tissue metabolic activity, trans-capillary water flux, derived from dynamic contrast enhanced MRI. In this study we compared 23 subjects with progressive MS to 19 healthy controls. We find significantly reduced measures on capillary water flux in MS thalami compared to controls. Implications for use of this new biomarker are discussed.
Introduction
Mitochondrial injury caused by inflammation-related oxidative stress might play a role in inducing the destruction of myelin sheet and other neurodegenerative processes in multiple sclerosis1, 2. Consequently, decreased cerebral metabolism might predict disease progression prior to neurodegeneration3. Capillary water flux is driven by local Na+/K+- ATPase activity4. Therefore, the water permeability surface product (PwS) is potential surrogate of brain metabolic activity. The goal of this study was to assess PwS in subcortical grey matter regions of progressive multiple sclerosis subjects with dynamic contrast enhanced MRI, and to compare PwS values to healthy controls.Methods
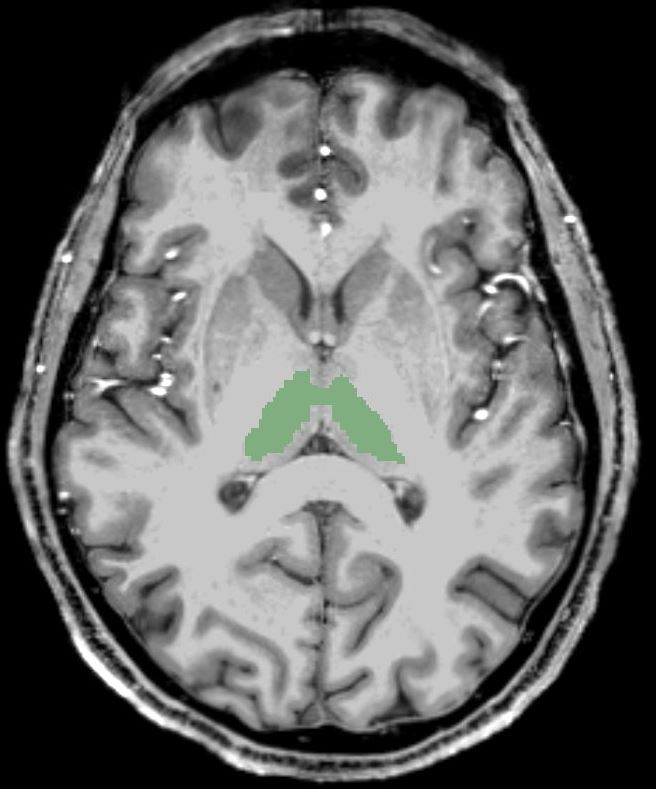
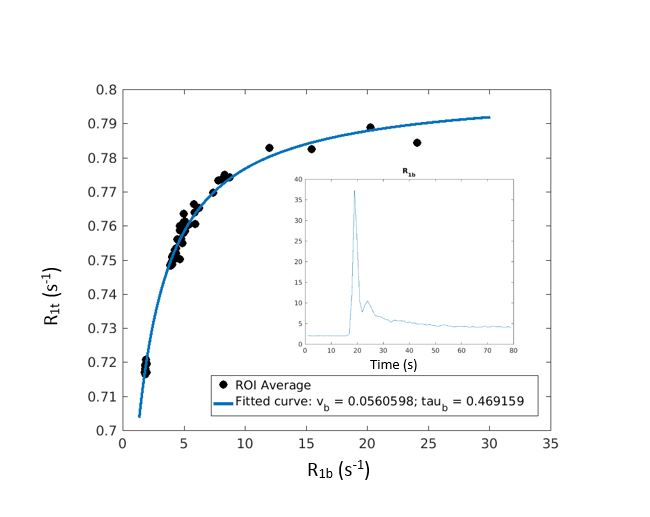
Twenty-three progressive multiple sclerosis (MS) subjects (5 primary and 18 secondary progressive, 14 males, 9 females, mean age ± SD: 56.7 ± 9.1 years) and nineteen control subjects (8 males, 11 females, mean age ± SD: 50.6 ± 11.4) underwent dynamic contrast enhanced imaging with a 7T MRI instrument (Siemens). A T1-weighted 3D-spoiled gradient echo sequence with whole-brain coverage (TR/TE/FA: 2.7ms/1.2ms/6°, 44 axial slices, 5 mm slice thickness, 3.6 s temporal resolution, 80 volumes) was obtained. A gadoteridol (ProHance; Bracco, Cranberry, NJ) dose of 0.57 mmol/kg was injected at 2 mL/s and followed by a 20mL saline flush. R1 maps were calculated on a voxel-wise basis. The bilateral thalami were segmented with Freesurfer v6.0.05 using bias-corrected T1-w MPRAGE scans as an input (Figure 1). Mean blood volume fraction (vb) and equilibrium water extravasation rate constant (kpo) values within the thalami were determined by non-linear modeling with the following equation4 using MATLAB (MathWorks, Inc., Natick, MA) (Figure 2):
R1(t) = { [R1b(t) + R1i + kpo(1 + pb/(1-pb))] - [(R1i - R1b(t) - kpo(1 + pb/(1-pb)))2 + (2kpo)2pb/(1-pb)]1/2 }/2
where
pb is the mole fraction of tissue water in blood (vb=pb·fw,
fw is the tissue volume fraction accessible to mobile aqueous
solutes), R1t(t) is the tissue 1H2O R1, R1b(t) is the R1 of
blood 1H2O, time-dependent due to differential plasma concentration of gadoteridol, and was measured from the R1 map in
the sagittal sinus. R1i is the longitudinal relaxation rate constant of parenchymal 1H2O sans contributions from blood water. PwS was calculated as the product of vb
and kpo. PwS values were compared between subjects and controls
with a multiple linear regression model with PwS as dependent, while
disease group (MS vs. control), age and sex as independent variables using SPSS
(IBM Corp., Armonk, NY).
Results
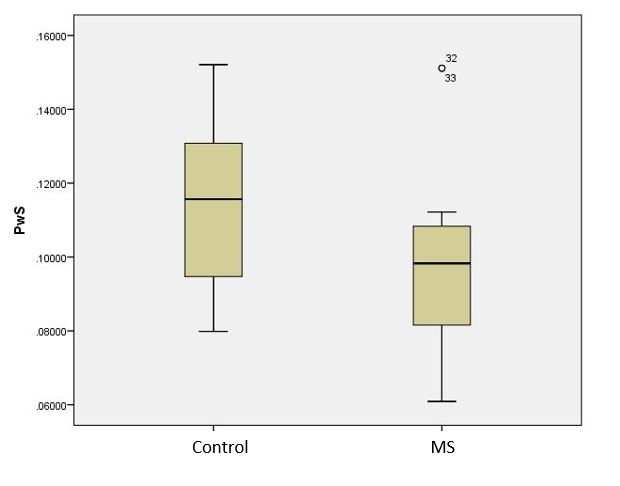
Group average thalami PwS was significantly lower in the MS compared to healthy control groups (mean ± SD: 0.0930 ± 0.0155 vs. 0.114 ± 0.023, respectively, p= 0.0434). Age and sex had a significant effect on PwS values (p= 0.0395 and p= 0.0490, respectively).Discussion
Reduced PwS in subcortical grey matter areas of progressive multiple sclerosis patients suggests decreased metabolic activity possibly due to excessive oxidative stress and impaired mitochondrial function. Revealing impaired cerebral metabolism in the earlier stages of the disease might contribute to the development of more effective treatments that could possibly prevent brain atrophy. PwS and other DCE-derived parameters are promising as potential biomarkers, however, further studies needed to validate their use.Acknowledgements
Acknowledgements: Funding: Conrad N Hilton Innovation Fund; NIH OD018224; NMSS FG-16-7-25259References
1. Lassmann H, van Horssen J, Mahad D. Progressive multiple sclerosis: pathology and pathogenesis. Nature reviews Neurology. 2012;8(11):647-656.
2. Mahad DH, Trapp BD, Lassmann H. Pathological mechanisms in progressive multiple sclerosis. The Lancet Neurology. 2015;14(2):183-193.
3. Ge Y, Zhang Z, Lu H, et al. Characterizing brain oxygen metabolism in patients with multiple sclerosis with T2-relaxation-under-spin-tagging MRI. J Cereb Blood Flow Metab. 2012;32(3):403-412.
4. Rooney WD, Li X, Sammi MK, et al. Mapping human brain capillary water lifetime: high-resolution metabolic neuroimaging. NMR in biomedicine. 2015;28(6):607-623.
5. Fischl B, Salat DH, Busa E, et al. Whole brain segmentation: automated labeling of neuroanatomical structures in the human brain. Neuron. 2002;33(3):341-355.
Figures