5279
Examining Cortical Thickness Markers in Relapse Remitting Multiple Sclerosis1Medical Biophysics, The University of Western Ontario, London, ON, Canada, 2Centre of Functional and Metabolic Mapping, London, ON, Canada
Synopsis
Recent evidence suggests that cortical pathology in Multiple Sclerosis (MS) does not affect all brain regions equally. We aim to investigate regional cortical MS pathology by using cortical thickness measures in a relapsing-remitting group (RRMS). Structural scans from 21 RRMS and 21 controls were processed using Freesurfer to obtain cortical thickness measurements. Group level analysis was performed to investigate the preference of sulcal and gyral thinning. Differences between gyri and sulci thickness between groups were also calculated to see if there was any evidence of cortical-layer specific thinning. Sulcal preference was shown, and no layer specific thinning was observed.
Introduction
It is well known that cortical thinning occurs in Multiple Sclerosis (MS), often leading to a worsening of clinical disability status in patients1,2. There has been recent evidence suggesting that sulci of the cortex are more prone to MS pathology such as demyelination3, inflammation4, and cortical lesions5. Furthermore, differences between gyri and sulci thickness have been used as an indirect measure to identify cortical-layer specific thinning6. For these reasons, cortical thickness may play an important role as a marker helping to monitor disease status in MS populations. Here we investigate the regional specificity of cortical thinning, and the mean gyri-sulci thickness difference in a relapsing-remitting MS (RRMS) population.Material & Methods
Data Acquisition: 21 RRMS patients (recruited from the London MS clinics, London, Ontario), and 21 age and sex matched controls who participated in a previous longitudinal MS study were sampled. Structural T1-weighted (MP2RAGE) images were acquired using a 7T head-only MRI system (Siemens, Magnetom, Erlangen, Germany) with a resolution of 0.75 x 0.75 x 0.75mm3. The highest quality structural scan was selected from each participants’ collection of scans for the current study, as a way to control for motion artifacts and improve cortical reconstruction.
Data Processing: Cortical reconstructions were generated using the Freesurfer software7-9. The raw T1-weighted structural image was processed in native space. Data intensity was normalized, followed by bias field correction, and skull-stripping. The hemispheres were then separated, tessellated and deformed to produce an accurate and smooth representation of the cortical ribbon. Manual edits were performed to improve segmentation accuracy. Vertices from regions in the temporal lobe were omitted from all analysis due to poor segmentation. Mean curvature at each vertex in the cortex was measured and used to distinguish gyri from sulci. A vertex-wise analysis was conducted by registering all participants to a standard space (fsaverage) in order to examine the localization of cortical thinning between controls and patients. Subsequently, mean gyral and sulcal cortical thickness per hemisphere of each participant were obtained, and the difference between mean gyral thickness and sulcal thickness was calculated, to be used as an indirect measure of cortical morphology. A linear mixed-effect model was then used to compare these 3 measures between patients and controls. All analyses controlled for age, gender, hemisphere, and surface area.
Results
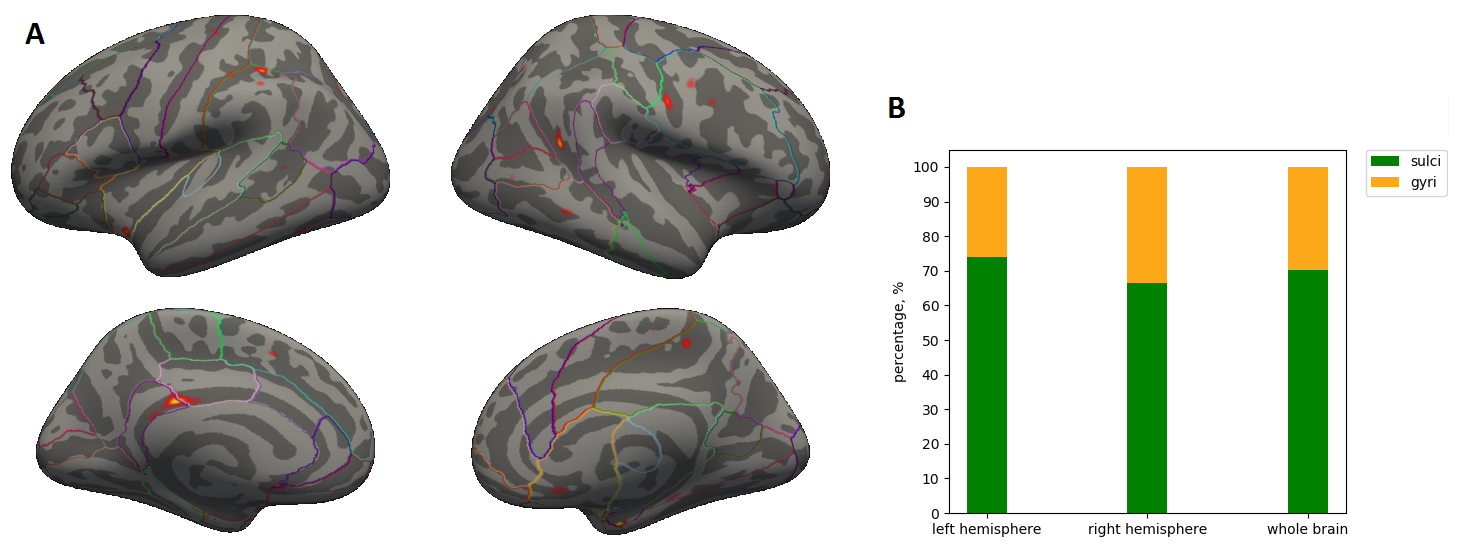
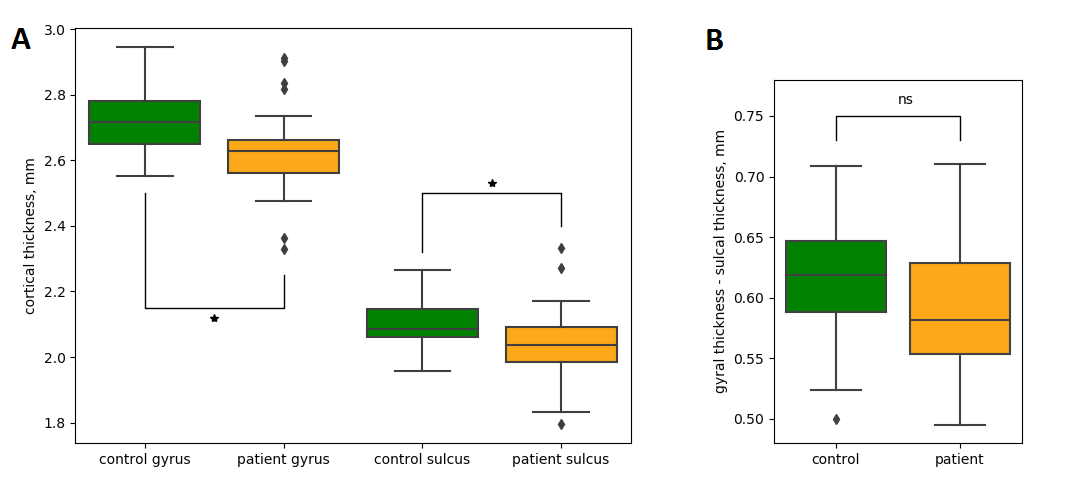
A vertex-wise analysis is shown in Figure 1A, where significant (p<0.01) regions indicate areas of reduced cortical thickness in patients relative to controls. Figure 1B shows the proportional contribution of sulci and gyri to the thinned regions. Whole brain analysis found that sulci contributed 70.4% of overall significant cortical thinning. Further investigation found a sulcal contribution of 73.9 and 66.5% in the left and right hemisphere, respectively. These results suggest a potential preference for cortical thinning in the sulci of RRMS patients. Additional analysis was conducted to compare the cortical thickness of gyri and sulci between groups (Figure 2A). A decrease in mean thickness was observed for patients’ gyri (B=-0.089, t=-2.98, p<0.01) and sulci (B=-0.067, t=-2.76, p<0.01), relative to controls. However, no significant changes were found when comparing the difference in mean thickness (mean gyri thickness – mean sulci thickness) between groups (B=-0.023, t=-1.53, p=0.133; Figure 2B). These findings suggest cortical thinning occurs in gyri and sulci equally.Discussion & Conclusion
Our data suggests that in an RRMS population, a higher proportion of cortical thinning occurs in sulci compared to gyri. This is in agreement with evidence from another in-vivo MRI study that found increased quantitative T2*, an indicator of demyelination in the sulci of RRMS patients3. Furthermore, we show that whole-brain thinning occurs uniformly across both gyri and sulci, and thus mechanisms underlying cortical thinning are likely not layer-specific. However, it is also possible that cortical thinning in RRMS is not large enough to detect significant changes in layer morphology. A logical step forward would be to perform similar analyses in more progressive MS patients to confirm that sulci thickness patterns are a relevant diagnostic marker of early MS phenotypes. Subsequently, it would be of interest to determine if layer-specific thinning becomes more prominent in these more progressive stages as an indicator of potential MS pathology.Acknowledgements
This project was supported by a Canadian Institutes of Health Research (CIHR) Foundation grant held by Dr. Ravi Menon.References
1. Fisher, E., Lee, J.-C., Nakamura, K. & Rudick, R. A. Gray matter atrophy in multiple sclerosis: A longitudinal study. Annals of Neurology, 2008;64(3), 255–265.
2. Calabrese, M., et al. Cortical Lesions and Atrophy Associated With Cognitive Impairment in Relapsing-Remitting Multiple Sclerosis. Archives of Neurology, 2009;66(9), 1144-1150.
3. Mainero, et al. A gradient in cortical pathology in multiple sclerosis by in vivo quantitative 7 T imaging. Brain, 2015;138(4), 932-945.
4. Haider, L., et al. The topograpy of demyelination and neurodegeneration in the multiple sclerosis brain. Brain, 2016;139(3), 807-815.
5. Harrison, D.M., et al. Association of Cortical Lesion Burden on 7-T Magnetic Resonance Imaging With Cognition and Disability in Multiple Sclerosis. JAMA Neurology, 2015;72(9), 1004-1012.
6. Wagstyl, K., Ronan, L., Whitaker, K. J., Goodyer, I. M., Roberts, N., Crow, T. J., & Fletcher, P. C. Multiple markers of cortical morphology reveal evidence of supragranular thinning in schizophrenia. Translational Psychiatry, 2016;6(4).
7. Fischl, B., & Dale, A. M. Measuring the thickness of the human cerebral cortex from magnetic resonance images. Proceedings of the National Academy of Sciences, 2000;97(20), 11050-11055.
8. Dale, A.M., Fischl, B., & Sereno, M.I. Cortical surface-based analysis I: Segmentation and surface reconstruction. NeuroImage, 1999;9, 179-194.
9. Fischl, B., Sereno, M.I., & Dale, A.M. Cortical surface-based analysis II: Inflation, flattening, and a surface-based coordinate system. NeuroImage, 1999;9, 195-207.
Figures