5277
Comparison of Methods for Whole-Brain and Grey Matter Atrophy Assessment in Multiple Sclerosis1Neuroimaging Research Unit, INSPE, Division of Neuroscience, San Raffaele Scientific Institute, Vita-Salute San Raffaele University, Milan, Italy, 2Department of Neurology, San Raffaele Scientific Institute, Vita-Salute San Raffaele University, Milan, Italy, 3Research and Development for Icometrix, KU Leuven, Leuven, Belgium, 4Xinapse Systems, Colchester, United Kingdom, 5Department of Medicine, Surgery and Neuroscience, University of Siena, Siena, Italy, 6Section of Neuroradiology, Department of Radiology, Hospital Universitari Vall d’Hebron, Barcelona, Barcelona, Spain, 7Unitat de Neuroimmunologia Clinica, CEM-Cat, Hospital Universitari Vall d’Hebron, Barcelona, Spain, 8Nuffield Department of Clinical Neurosciences, University of Oxford, Oxford, United Kingdom
Synopsis
We compared different methods for whole-brain and grey matter (GM) atrophy estimation (ANTs v1.9, CIVET v2.1, FSL-SIENA(X) v5.0.1, Icometrix-MSmetrix v1.7, and SPM v12) in multiple sclerosis (MS). The accuracy and precision were evaluated for cross-sectional and longitudinal whole-brain and GM atrophy measures. All software showed high accuracy and comparable repeatability for cross-sectional measures. However, since there was poor reproducibility and high variability in cross-sectional and longitudinal atrophy measures, changes of MR scanner should be avoided. This study may help in the selection of a suitable pipeline, depending on the requirements of the application (research center, clinical setting or clinical trial).
Introduction
Neurodegeneration is a clinically relevant pathological hallmark of multiple sclerosis (MS).1,2 The quantification of volume loss (atrophy) of the brain and of the grey matter (GM) from magnetic resonance imaging (MRI) is widely accepted as an in vivo biomarker of neurodegeneration in MS and many other neurological conditions.3-6 Halting neurodegeneration and promoting neuroprotection is a prime goal of current therapeutic strategies.7,8 Several software tools are available to measure atrophy from MRI, although none is routinely used in clinical practice.9-12 The aims of this study were the assessment and comparison of different automatic or semi-automatic methods (ANTs version 1.9, CIVET version 2.1, FSL-SIENAX/SIENA 5.0.1, Icometrix-MSmetrix 1.7, and SPM version 12) currently available for whole-brain and grey matter (GM) atrophy quantification in MS (both cross-sectionally and longitudinally), and an appraisal of the feasibility of moving them into the clinical setting.Methods
The dataset arranged for this study consisted of 3DT1 and 3D-T2 FLAIR MRI sequences of simulated data of MS brains, longitudinal data from healthy controls (HC), test and retest MRI of MS patients acquired at different MR scanner field strengths and manufacturers, and longitudinal data from MS patients (1 year of follow-up). A MRI simulator was developed for the creation of the simulated data. The digital brain phantoms with mild and severe lesion load (respectively 0.42 and 10.1 ml), tissue MR parameters and Intensity non-uniformity (INU) fields available from BrainWeb were used.13 Standard 1.5T parameters were included into the Bloch equation to obtain T1-weighted and FLAIR sequences:
S(x,y,z)=ρ(x,y,z)|1-2exp(-TI/T1(x,y,z) ) |*[1-exp(-TR/T1(x,y,z) ) ]*exp(-TE/(T2(x,y,z)));
Cross-sectional and longitudinal whole-brain and GM atrophy estimation were tested for each software package. For ANTs and SPM, longitudinal pipelines were implemented using their own tools, according to Jacobian integration method.14 For the validation, we used test-retest MRI of MS patients acquired using the same scanner to evaluate repeatability, while test-retest scans acquired using different scanner manufacturers and different MR field strengths were used to assess the reproducibility of brain and GM volume measures. Simulated data of MS patients and longitudinal dataset from HC were used to assess the accuracy of respectively whole-brain and GM cross-sectional and longitudinal atrophy measures. Longitudinal data from MS patients (1 year of follow-up) were used to assess the agreement between atrophy results for the different methods, using the Intra-class correlation coefficient (ICC). Moreover, the main steps that are common to all processing pipelines were qualitatively and quantitatively evaluated [brain and GM segmentation, image registration, white matter (WM) lesion filling].
Results
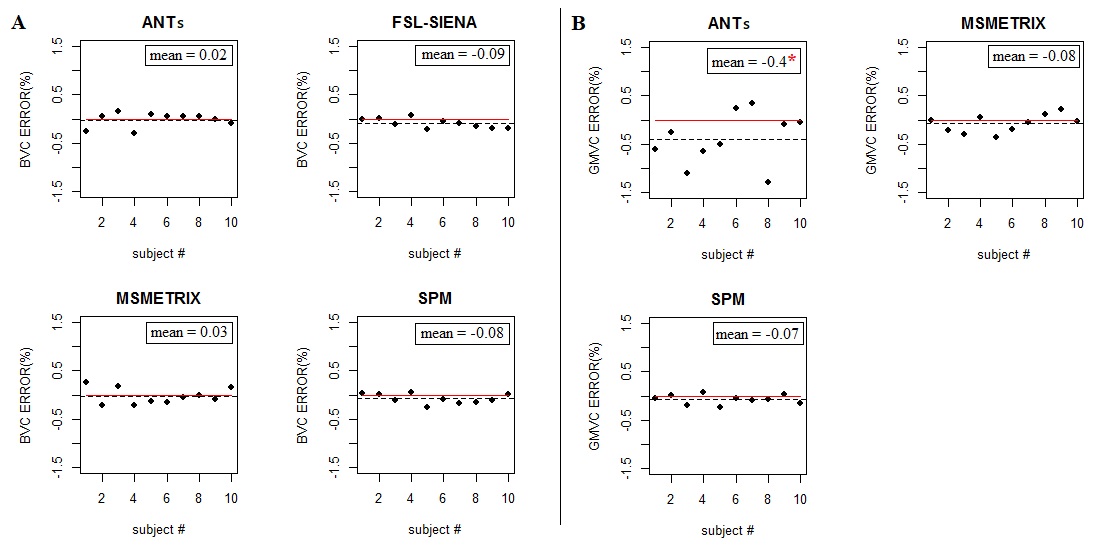
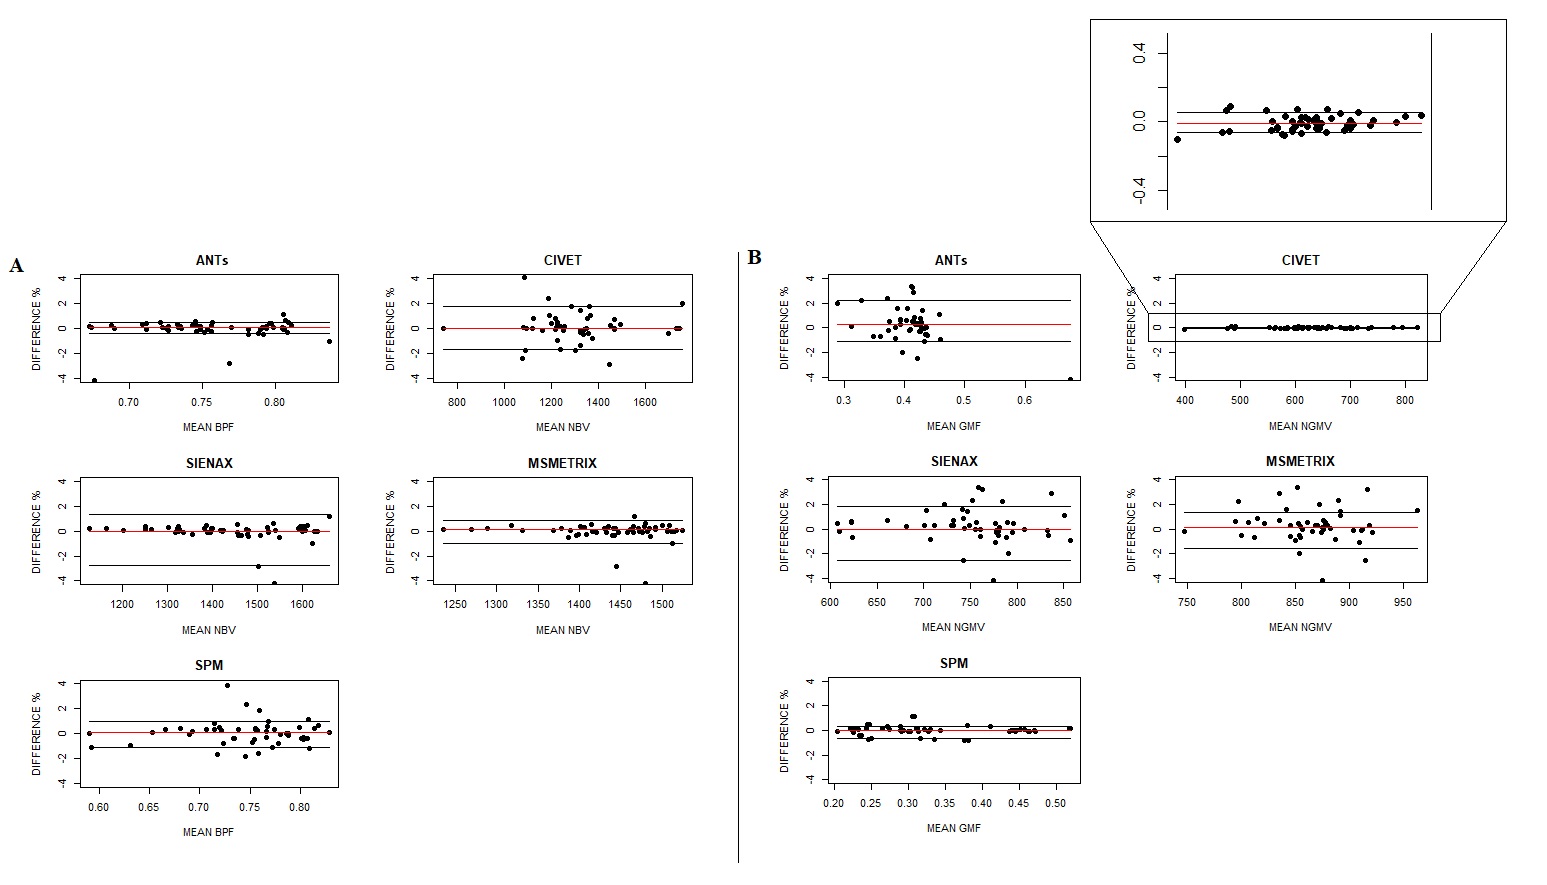
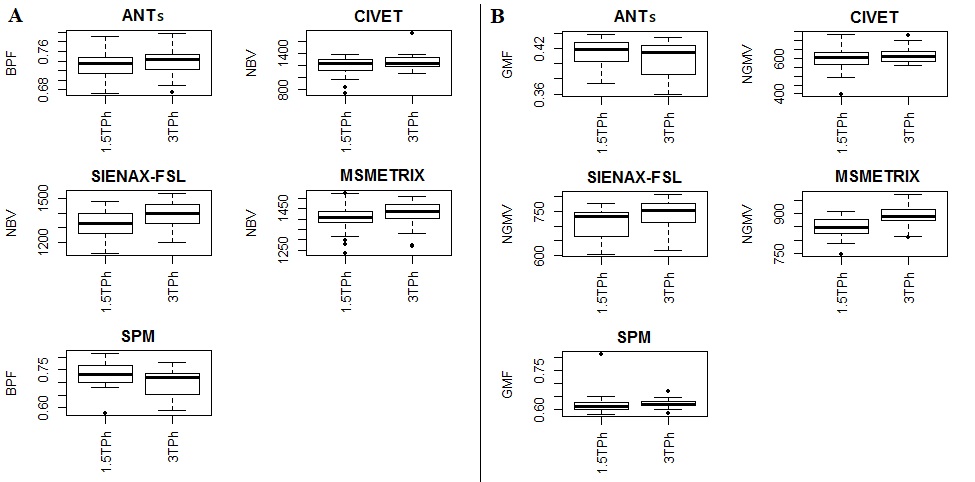
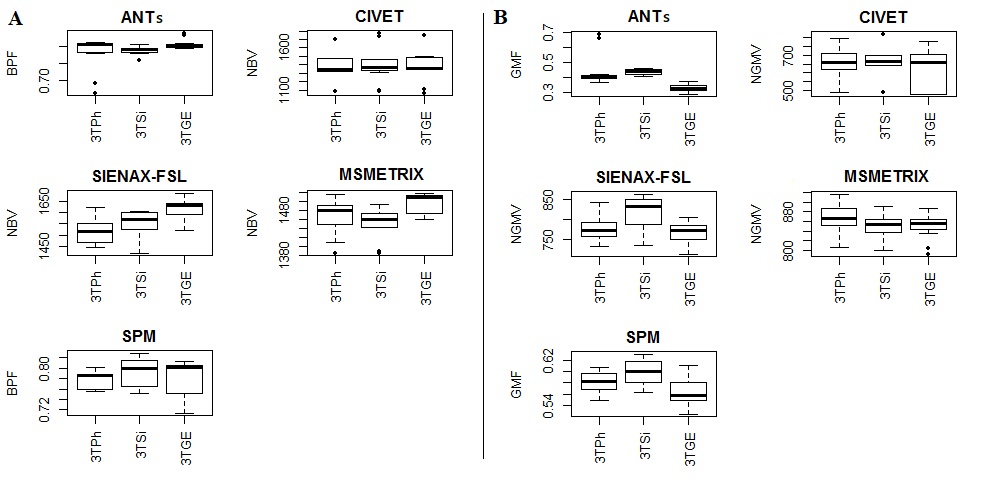
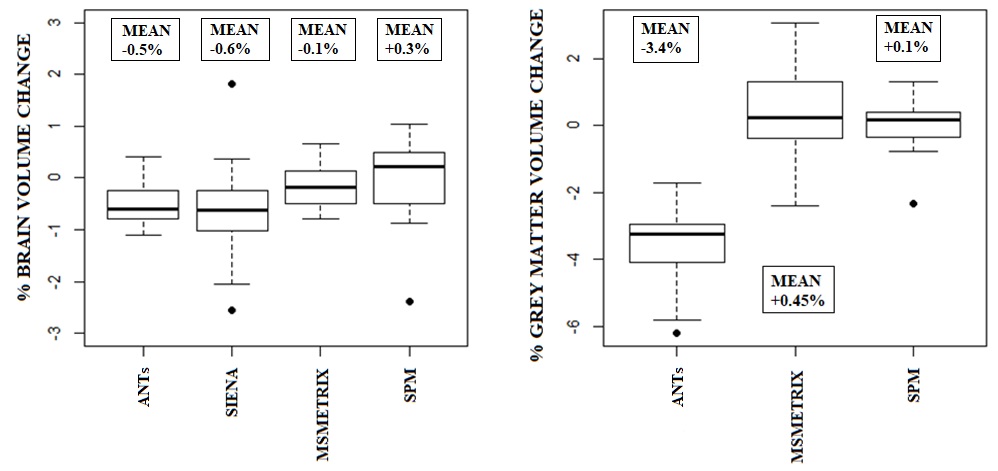
High values of accuracy (0.87-0.97) on simulated dataset for whole-brain and GM volume measures were found, with the lowest values for MSmetrix (0.87-0.88). ANTs showed the smallest mean error in estimating percentage of whole-brain volume changes on HC (0.02%) with a coefficient of variation (CoV) of 0.5% (Figure 1). SPM showed the smallest mean error (0.07%) and CoV (0.08%) in estimating percentage of GM volume changes. Good repeatability was found on average for whole-brain and GM volume measures for all software (Figure 2), but a poor reproducibility between the results from different MR field strengths (Figure 3) and manufacturers (Figure 4) was found. Regarding the sensitivity to detect atrophy changes in MS patients with one year of follow-up, a significant ICC was found between SIENA and SPM whole-brain longitudinal atrophy results, while no significant agreement was found between GM atrophy results for the different methods (Figure 5). From image registration assessment, comparable values of normalized mutual information (NMI) were found for the different pipelines (NMI>1), for image registration between subject to atlas and between two time points of the same subject. The WM lesion filling technique mainly affected longitudinal atrophy results for ANTs, MSmetrix and SPM packages.Discussion
All pipelines showed comparable repeatability of whole-brain and GM volume quantification when the input data were carefully controlled (consistent patient positioning and pulse sequence in a single scanner). However, changes of MR scanner should be avoided and an improved reproducibility is required to all pipelines. Moreover, the coefficients of variation estimated from repeated measures showed that the variability was too high to allow individualized patient studies and clinical application.Conclusion
This study may help in the selection of a suitable pipeline from among those available, depending on the requirements of the analysis framework (research center, clinical setting or clinical trial), and whether the goal is high accuracy and repeatability or high reproducibility. These results may also be helpful to directing further improvements to atrophy processing pipelines for future clinical use in MS.Acknowledgements
No acknowledgement found.References
1. Evangelou N, Esiri MM, Smith S, et al. Quantitative pathological evidence for axonal loss in normal appearing white matter in multiple sclerosis. Ann Neurol 2000; 47: 391-395. 2. Popescu BF, Pirko I, Lucchinetti CF. Pathology of multiple sclerosis: where do we stand? Continuum (Minneap Minn) 2013; 19: 901-921. 3. Filippi M, Preziosa P, Copetti M, et al. Gray matter damage predicts the accumulation of disability 13 years later in MS. Neurology 2013; 81: 1759-1767. 4. Miller DH, Barkhof F, Frank JA, et al. Measurement of atrophy in multiple sclerosis: pathological basis, methodological aspects and clinical relevance. Brain 2002; 125: 1676-1695. 5. Pravatà E, Rocca MA, Valsasina P, et al. Gray matter trophism, cognitive impairment, and depression in patients with multiple sclerosis. Mult Scler 2017 doi: 10.1177/1352458517692886. 6. van Munster CE, Jonkman LE, Weinstein HC, et al. Gray matter damage in multiple sclerosis: Impact on clinical symptoms. Neuroscience 2015; 303: 446-461. 7. Sormani MP, Arnold DL, De Stefano N. Treatment effect on brain atrophy correlates with treatment effect on disability in multiple sclerosis. Ann Neurol 2014; 75: 43-49. 8. Branger P, Parienti JJ, Sormani MP, Defer G. The Effect of Disease-Modifying Drugs on Brain Atrophy in Relapsing-Remitting Multiple Sclerosis: A Meta-Analysis. PLoS One 2016; 11: e0149685. 9. Avants BB, Tustison NJ, Wu J, et al. An open source multivariate framework for n-tissue segmentation with evaluation on public data. Neuroinformatics 2011; 9: 381-400. 10. Smith SM, Zhang Y, Jenkinson M, et al. Accurate, robust, and automated longitudinal and cross-sectional brain change analysis. Neuroimage 2002; 17: 479-489. 11. Smeets D, Ribbens A, Sima DM, et al. Reliable measurements of brain atrophy in individual patients with multiple sclerosis. Brain Behav 2016; 6: e00518. 12. Zijdenbos AP, Forghani R, Evans AC. Automatic "pipeline" analysis of 3-D MRI data for clinical trials: application to multiple sclerosis. IEEE Trans Med Imaging 2002; 21: 1280-1291. 13. BrainWeb: Simulated Brain Database. www.bic.mni.mcgill.ca/brainweb/. 14. Nakamura K, Guizard N, Fonov VS, et al. Jacobian integration method increases the statistical power to measure gray matter atrophy in multiple sclerosis. Neuroimage Clin 2014; 4: 10-17.Figures