5276
Inconsistency in Grey Matter Volume Estimation of MS Patients: A Multi-Vendor Study at 3 TeslaHoushang Amiri1, Stephanie Bosschaert1, Iman Brouwer1, Joost P.A. Kuijer1, Jan C. de Munck1, Marloes Hagens2, Joep Killestein2, Frederik Barkhof1,3, and Hugo Vrenken1
1Radiology & Nuclear Medicine, VU University Medical Center, Amsterdam, Netherlands, 2Department of Neurology, MS Center Amsterdam, VU University Medical Center, Amsterdam, Netherlands, 3Institutes of Neurology and Healthcare Engineering, UCL, London, United Kingdom
Synopsis
MR images are widely used to measure brain atrophy is neurodegenerative diseases. However, reliable evaluation of atrophy is hampered by between- and within-scanner variability and inconsistency. We investigated this in 21 multiple sclerosis patients scanned at three different scanners (twice at each scanner). Volumes of GM, WM and whole brain, as well as deep grey matter structures were assessed using SIENAX and FSL-FIRST, respectively. Voxel-based morphometry was used to localise variabilities in the brain. Our findings suggests that scanner-related factors, and especially between-scanner variability, play a role in inconstancy of brain volume measurements.
INTRODUCTION
Multiple sclerosis (MS) is a progressive neurodegenerative disease in which loss of brain volume, so-called atrophy, occurs 1. MRI measures of brain atrophy can help in understanding this neurodegenerative component of MS. However, accurate and reliable evaluation of atrophy is hampered by variability and inconsistency of these measurements, partly due to within-scanner and between-scanner differences 2-5. In healthy control subjects, various studies have shown significant differences in brain tissue volumes between different scanners 6, 7. Variability was especially large in deep grey matter (DGM) structures and cerebral cortex 2, 4, 5. The present study aimed to quantify these within- and between-scanner variability of brain volume measures in MS patients.METHODS
21 MS patients were included in this study and written informed consent was obtained from all participants. On the same day, each patient was scanned twice (scan and re-scan) at three different 3-Tesla MR scanners: GE MR750, Philips Ingenuity, and Toshiba Titan. The scanning protocol included a standard 3D T1-weighted sequence for all scanners and a standard MS protocol including FLAIR sequence on one scanner only. Lesions were segmented on FLAIR images by Lesion Segmentation Toolbox (LST 2.0.15, www.statistical-modelling.de/lst.html) and lesion-filled on 3DT1 by LEAP 8. Volumes of GM, WM and whole brain, both normalized and unnormalized for head size, were estimated from lesion-filled 3D T1-weighted images by SIENAX and DGM volumes by FSL-FIRST 9. Absolute within-scanner agreement was calculated using intra-class correlation coefficients (ICC). To investigate between-scanner differences, ICC for consistency was calculated. Systematic differences between scanners were estimated using the repeated measures ANOVA with Greenhouse-Geisser correction. To localize the between-scanner variability across the brain, we performed voxel-based morphometry (VBM) using FSL. Statistical analyses for FSL-VBM were performed in FSL using permutation based non-parametric testing with Randomise, correcting for multiple comparisons across space using the threshold-free cluster enhancement (TFCE) approach10 and applying a subsequent voxel-wise threshold of p=0.001. SPSS version 22 (IBM) was used.RESULTS
Within-scanner agreement between sessions was very high for all scanners (ICC>0.8). For DGM volumes, ICC>0.9 was observed for most structures except nucleus accumbens, amygdala and hippocampus (Fig. 1). Between-scanner variability analysis also showed a high consistency (ICC>0.8) for most combination of scanners and most structures; although amygdala, hippocampus, nucleus accumbens, and normalized WM volumes were less consistent (Figs. 2a-b). Systematic volume differences between scanners were observed for both global (Fig. 3) and DGM volumes (Fig. 4). Fig. 5 displays significant differences between scanners in local GM content from VBM analysis. At the whole brain level, both unnormalized and normalized GM volume were generally higher in GE than Philips. For GE and Toshiba, differences are widespread in both directions. At the whole brain level, unnormalized and normalized GM volume are generally higher in Toshiba compared to Philips. However, Philips gives higher GM content in the frontal cortex.DISCUSSION
We found that mean GM and whole brain volumes were significantly higher in GE than both Philips and Toshiba. Additionally, nucleus accumbens, caudate nucleus, putamen and thalamus volumes were shown to be higher in Toshiba than in Philips. These findings thus confirm the hypothesis of the presence of systematic biases between scanners, likely a result of different image contrast. Nucleus accumbens, amygdala and hippocampus volumes were least consistent between scanners. This could indicate a lower reproducibility for these areas in all scanners, which could be due to volume measurement method. Notably, our results show that between-scanner differences in brain tissue volumes previously demonstrated in healthy controls 6, 7, can also be found in MS patients. According to the present study, similar differences can be found in MS patients. Both within and between scanners, nucleus accumbens, amygdala and hippocampus volumes showed a lower agreement, which partly confirms that differences were mainly present in DGM structures 2, 4, 5. In this way, the influence of both scanner and method on variability could be examined. VBM analyses revealed that between-scanner differences in local GM content may be negative in one anatomical location and positive in another.CONCLUSION
This study suggests that scanner-related factors, and especially between-scanner variability, play a role in variability of brain volume measurements. A systematic bias between scanners was found, but not all structures are equally affected, suggesting influence of regional image properties. Further research is needed to reduce impact of differences in image properties between scanners on volume measurements.Acknowledgements
No acknowledgement found.References
1. De Stefano N, Airas L, Grigoriadis N, Mattle HP, O'Riordan J, Oreja-Guevara C, Sellebjerg F, Stankoff B, Walczak A, Wiendl H and Kieseier BC. Clinical relevance of brain volume measures in multiple sclerosis. CNS Drugs. 2014;28:147-56. 2. Droby A, Lukas C, Schanzer A, Spiwoks-Becker I, Giorgio A, Gold R, De Stefano N, Kugel H, Deppe M, Wiendl H, Meuth SG, Acker T, Zipp F and Deichmann R. A human post-mortem brain model for the standardization of multi-centre MRI studies. Neuroimage. 2015;110:11-21. 3. Han X, Jovicich J, Salat D, van der Kouwe A, Quinn B, Czanner S, Busa E, Pacheco J, Albert M, Killiany R, Maguire P, Rosas D, Makris N, Dale A, Dickerson B and Fischl B. Reliability of MRI-derived measurements of human cerebral cortical thickness: the effects of field strength, scanner upgrade and manufacturer. Neuroimage. 2006;32:180-94. 4. Huppertz HJ, Kroll-Seger J, Kloppel S, Ganz RE and Kassubek J. Intra- and interscanner variability of automated voxel-based volumetry based on a 3D probabilistic atlas of human cerebral structures. Neuroimage. 2010;49:2216-24. 5. Jovicich J, Czanner S, Han X, Salat D, van der Kouwe A, Quinn B, Pacheco J, Albert M, Killiany R, Blacker D, Maguire P, Rosas D, Makris N, Gollub R, Dale A, Dickerson BC and Fischl B. MRI-derived measurements of human subcortical, ventricular and intracranial brain volumes: Reliability effects of scan sessions, acquisition sequences, data analyses, scanner upgrade, scanner vendors and field strengths. Neuroimage. 2009;46:177-92. 6. Moorhead TW, Gountouna VE, Job DE, McIntosh AM, Romaniuk L, Lymer GK, Whalley HC, Waiter GD, Brennan D, Ahearn TS, Cavanagh J, Condon B, Steele JD, Wardlaw JM and Lawrie SM. Prospective multi-centre Voxel Based Morphometry study employing scanner specific segmentations: procedure development using CaliBrain structural MRI data. BMC Med Imaging. 2009;9:8. 7. Shokouhi M, Barnes A, Suckling J, Moorhead TW, Brennan D, Job D, Lymer K, Dazzan P, Reis Marques T, Mackay C, McKie S, Williams SC, Lawrie SM, Deakin B, Williams SR and Condon B. Assessment of the impact of the scanner-related factors on brain morphometry analysis with Brainvisa. BMC Med Imaging. 2011;11:23. 8. Chard DT, Jackson JS, Miller DH and Wheeler-Kingshott CA. Reducing the impact of white matter lesions on automated measures of brain gray and white matter volumes. J Magn Reson Imaging. 2010;32:223-8. 9. Patenaude B, Smith SM, Kennedy DN and Jenkinson M. A Bayesian model of shape and appearance for subcortical brain segmentation. Neuroimage. 2011;56:907-22. 10. Douaud G, Smith S, Jenkinson M, Behrens T, Johansen-Berg H, Vickers J, James S, Voets N, Watkins K, Matthews PM and James A. Anatomically related grey and white matter abnormalities in adolescent-onset schizophrenia. Brain. 2007;130:2375-86.Figures
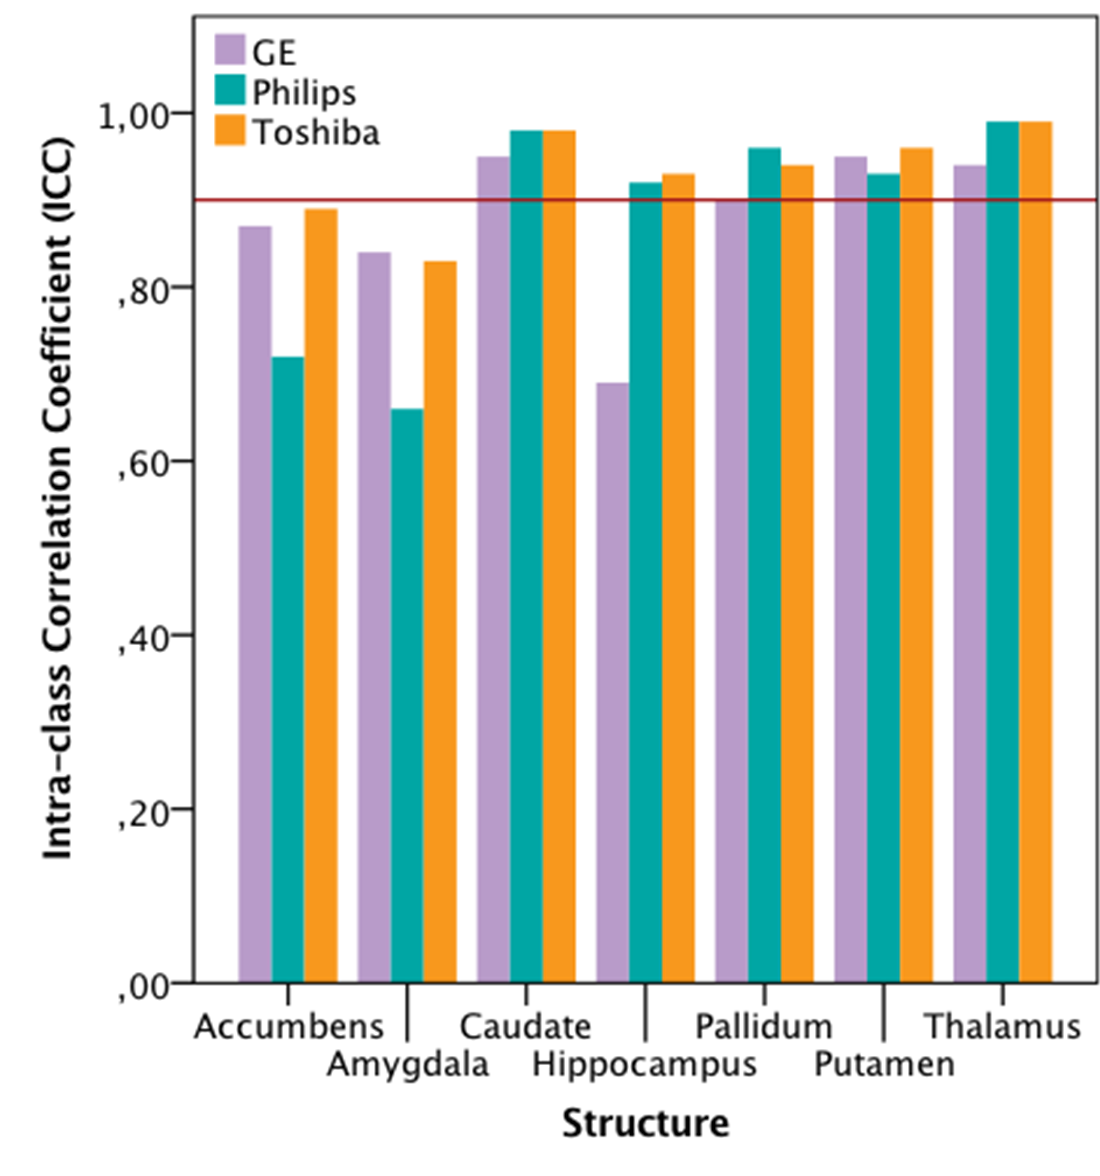
FIG 1. Within-scanner agreement for deep grey matter structures imaged at
different scanners. A high agreement (ICC>0.9, the solid line) is seen for
most structures except for nucleus accumbens, amygdala and hippocampus.
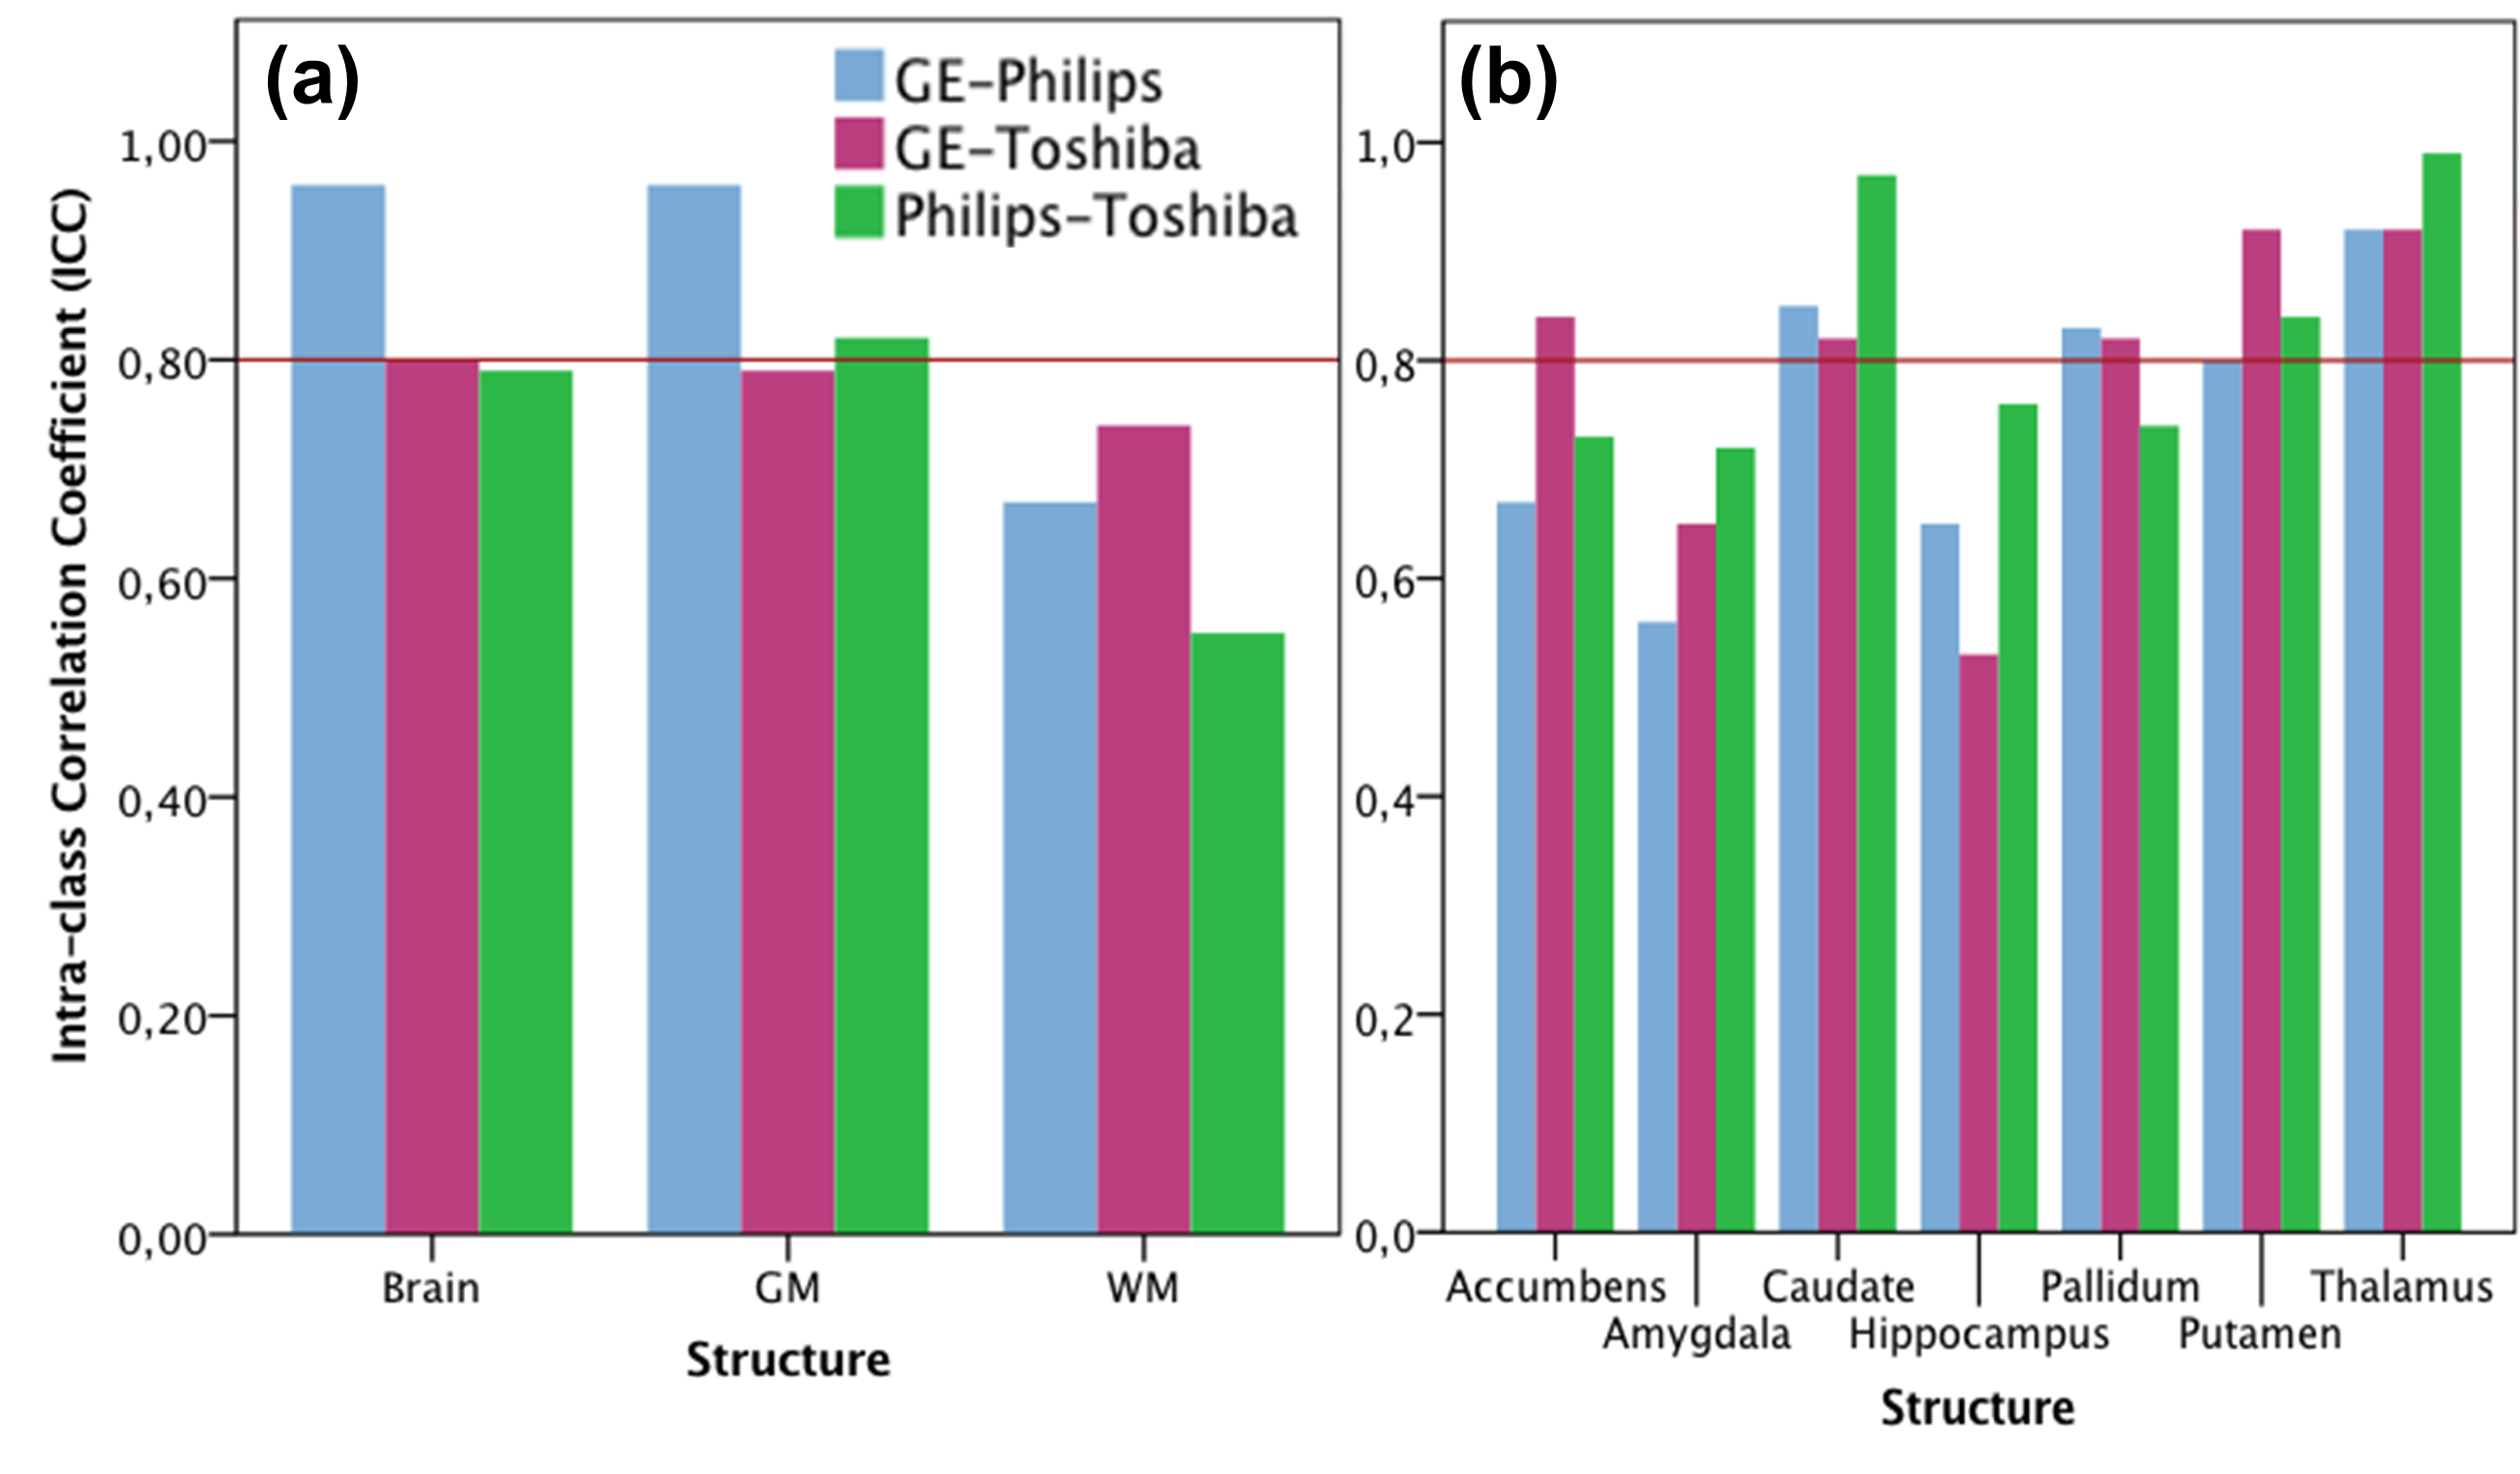
FIG 2. Between-scanner consistency for (a) the whole brain, GM, and WM and (b) deep
grey matter structures. High consistency (ICC>0.8, the solid line) is
observed for most structures; although this consistence is less for amygdala,
hippocampus, nucleus accumbens, and normalized WM.
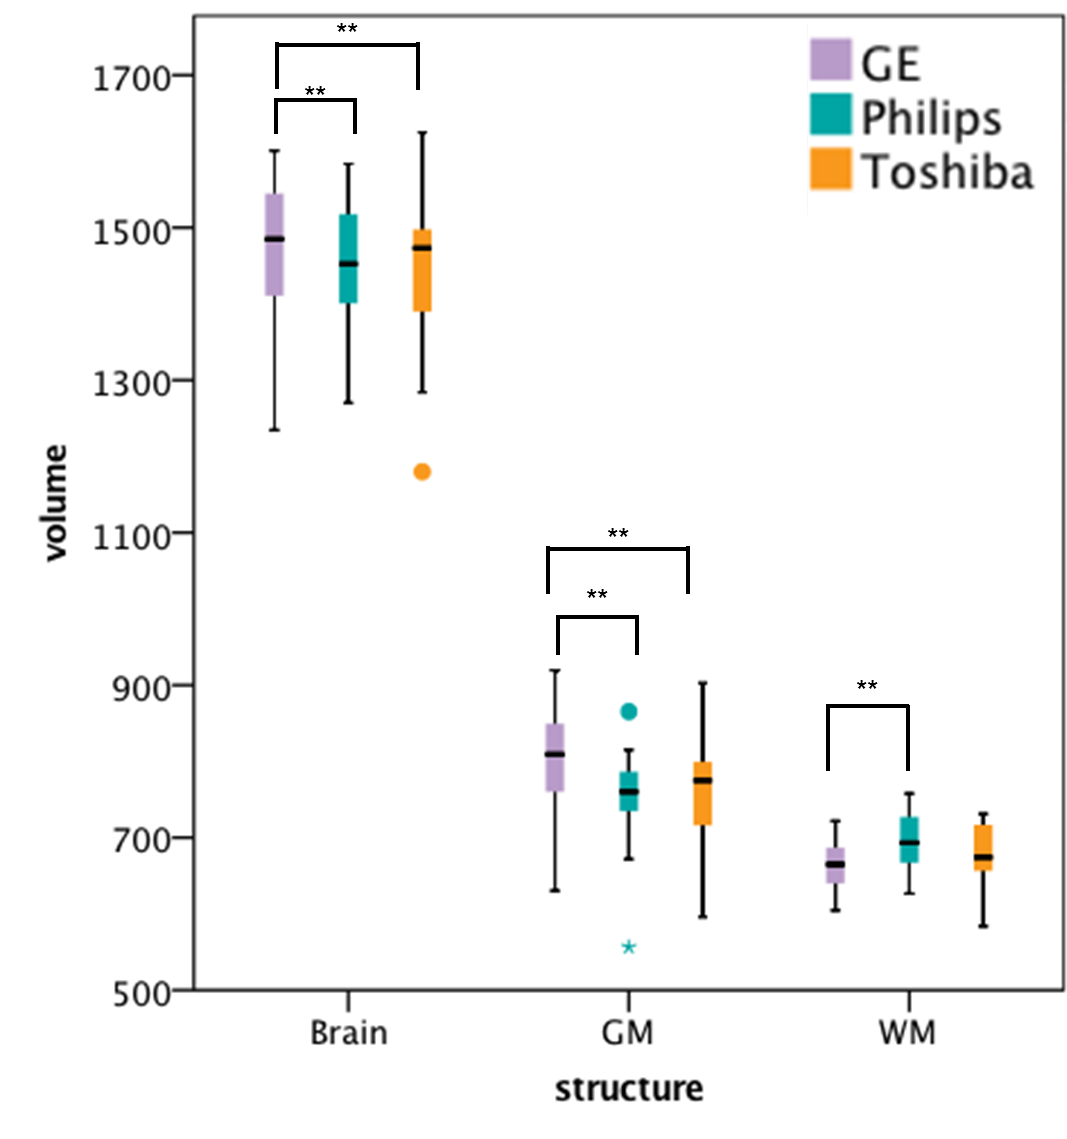
FIG 3. Volumes (in ml) of whole brain, GM and WM measured on the three scanners,
with significant paired differences indicated.
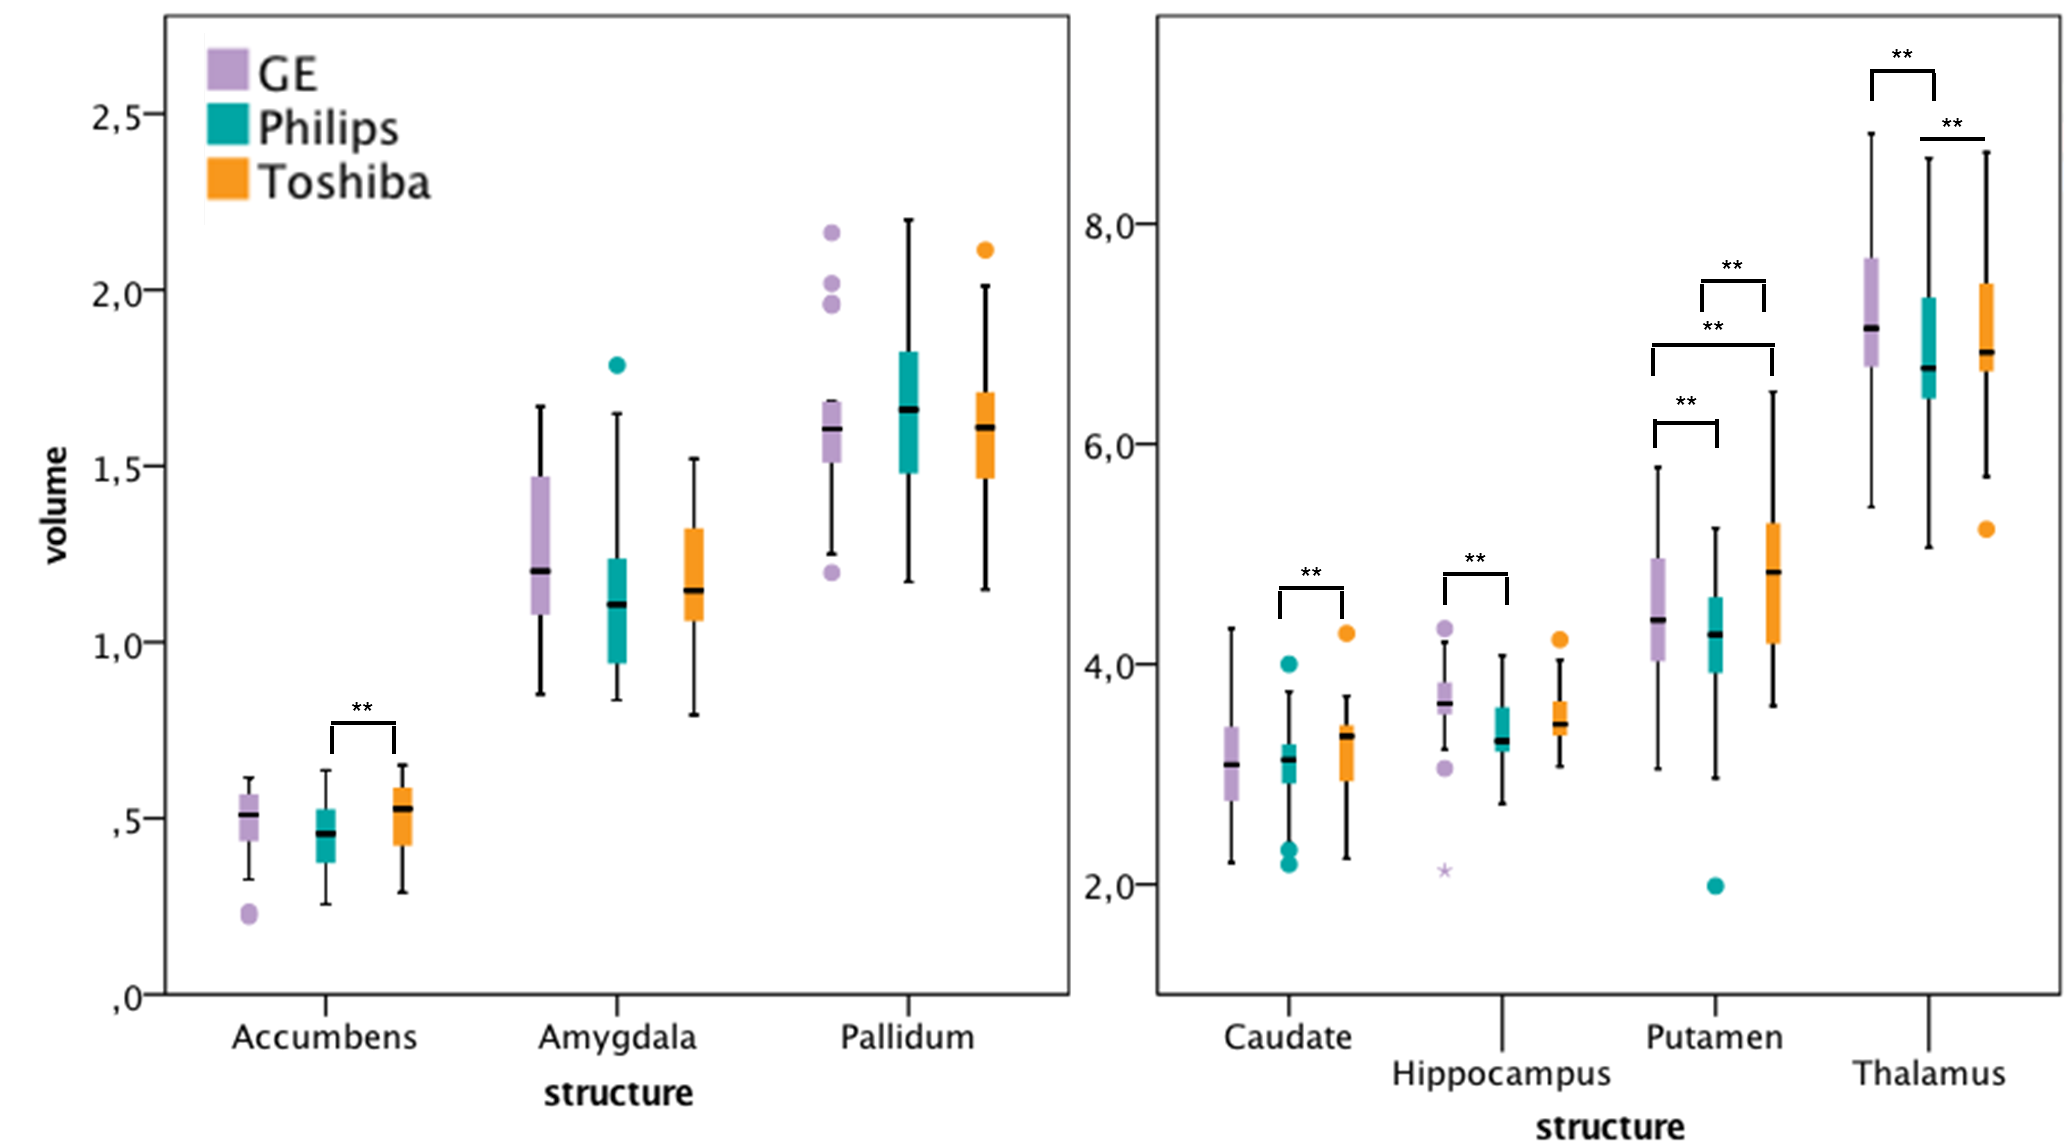
FIG 4. Volumes (in ml) of deep grey matter structures
on the three scanners, with significant paired differences indicated.
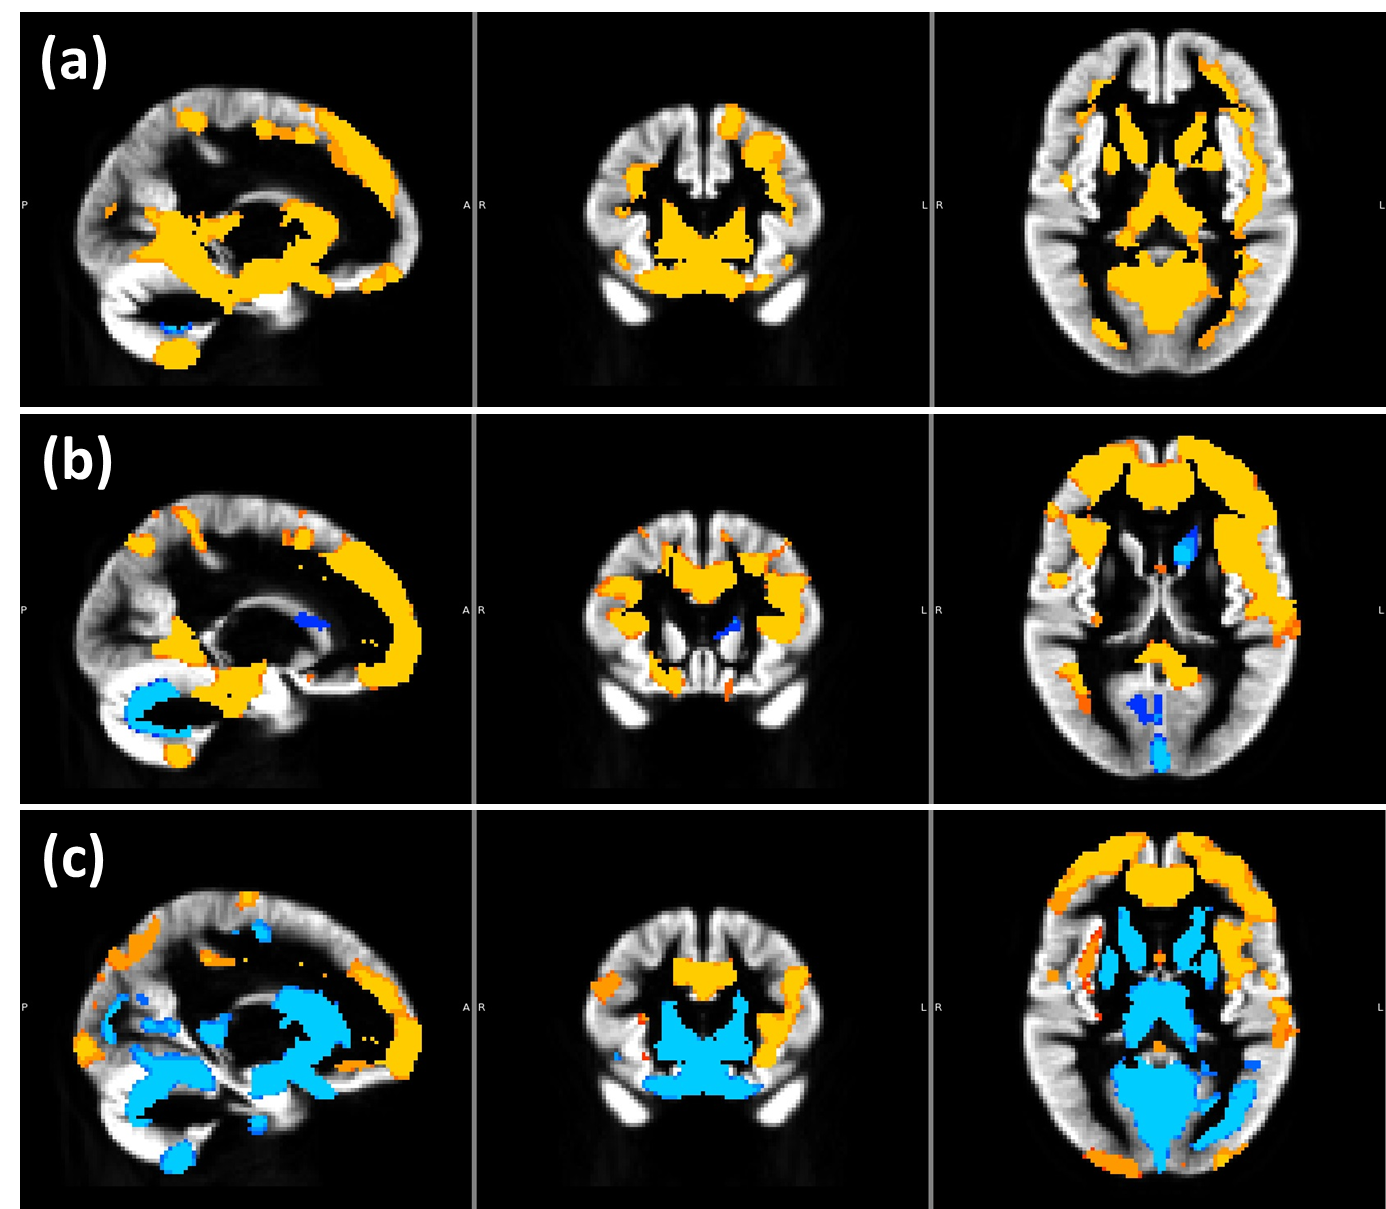
FIG 5. Voxel-based
morphometry results highlighting differences between scanners in local GM content.
Sagittal, coronal, and axial views of the grey
matter (GM) template with (a) yellow contrast where GE > Philips, and blue
contrast where Philips > GE, (b) yellow: GE > Toshiba; blue: Toshiba >
GE, c) yellow: Philips > Toshiba; blue: Toshiba > Philips.