5275
MR Microscopy of Cortical Lesions Reveal Iron Loss in Individual Oligodendrocytes1Laboratory of Functional and Molecular Imaging, NINDS, National Institutes of Health, Bethesda, MD, United States, 2Neuroimmunology Clinic, NINDS, National Institutes of Health, Bethesda, MD, United States, 3Translational Neuroradiology Section, NINDS, National Institutes of Health, Bethesda, MD, United States
Synopsis
Imaging of cortical demyelination in chronic multiple sclerosis, has been challenging. Previous MRI studies have detecting signal changes in cortical lesions have been attributed to myelin loss and the presence of iron-laden microglia. Here we demonstrate, in a case study, that MR microscopy may readily identify individual iron-rich cells (primarily oligodendrocytes) and regions. In addition, MR microscopy is shown to allow detailed examination of the central vein signal in white matter lesions.
Introduction
In vivo imaging of the cortical demyelination, thought
to be extensive in chronic MS, has been challenging. Prior ex vivo MRI studies
have detected signal changes in cortical lesions (CL) and attributed them to loss
of myelin and the presence of iron-laden microglia1-2. Here we demonstrate that MR
microscopy may readily identify individual iron-rich cells and regions, and so
provide a bridge between histochemical staining and in vivo imaging, shedding
light on ways to improve CL imaging in vivo.
In addition, MR microscopy provides a unique opportunity to study
central vein signal3-4 in white matter lesions (WML).Methods
Three blocks of formalin-fixed tissue,
approximately 250 mm3 (5 x 5 x 10 mm) in size one including a CL,
one with normal appearing cortex (CN) and one with a white matter lesion, were
removed postmortem from 77 y.o. male MS patient with 50-year disease duration. The
blocks were imaged on a 11.7T MRI (Bruker Avance III console, equipped with 100
G/cm 12-cm diameter gradients (Resonance Research))with home built 6-mm
diameter solenoid coil and T/R switch. Image
were acquired using a T2*-weighted 3D GRE sequence (TR/TE=30/10 ms,
FA=12 deg, isotropic resolution of 18 microns (nominal), matrix size = 512 x 256 x 256, scan time=17.5 hours).
Blocks were then embedded in paraffin, and histochemical and immunological staining
done for iron (3,3'-Diaminobenzidine Turnbull), myelin (Luxol fast
blue-Periodic acid schiff or LFB-PAS), oligodendrocytes (olg) (using Aspartoacylase
or Aspa), neurons (neuronal nuclear antigen or NeuN), macrophages (CD68), activated
macrophages and microglia (IBA-1), and astrocytes (glial fibrillary acidic
protein (GFAP)). MR images were manually aligned with histology using MIPAV to identify
source of MR signal.Results and Discussion
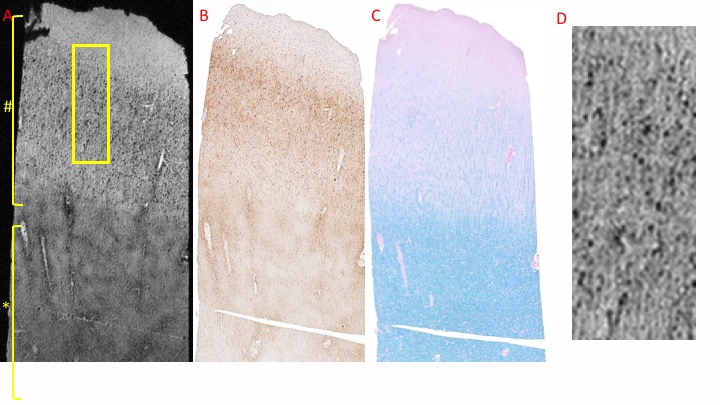
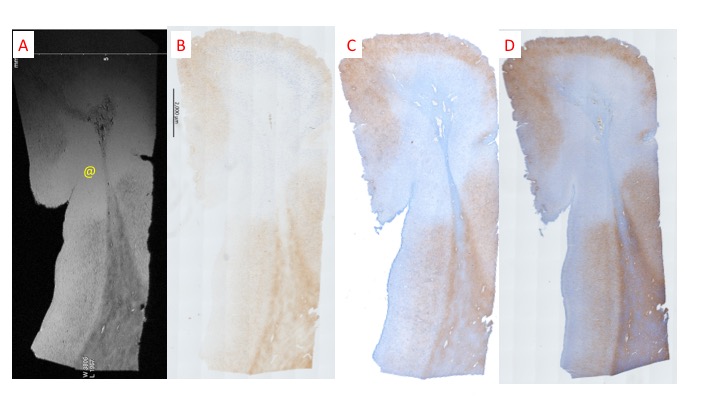
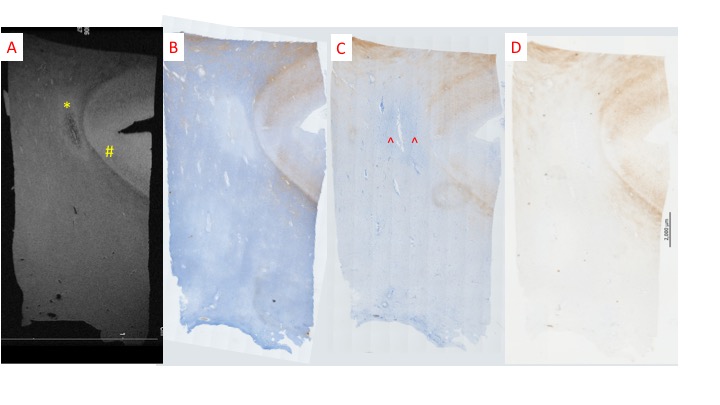
MRI of CN revealed regions of punctate and linear hypo-intensities in the cortex that were identified as iron-laden olg and iron in myelinated axons respectively using histological correlation (Figure 1). In addition, patchy regions of hypointensities were observed in the white matter near the grey-white junction, which corresponded histologically to iron laden olg near blood vessels (Figure 2). The region corresponding to the cortical lesion was clearly identified as hyperintense on the MRI primarily due to the lack of hypo-intensities (Figure 3). Histological evaluation of the tissue confirmed the loss of iron within olg, without a commensurate loss of olg. or neurons in the affected region. Some iron-laden macrophages could also be seen in the white matter using MRI (Figure 4). It is noted that it was difficult to get an exact registration of the MRI to the stained slides, possibly due to warping during slide preparation. This could possibly be remedied by directly imaging the slide preparation next to a thin layer of water. We are currently working on methods to quantify the distribution of spots5.Conclusion
MR microscopy could identify individual iron-laden olg and some myelinated fibers/fiber bundles with high sensitivity. Loss of iron in olg and myelin appears to correlate with the increased MRI signal within the cortical lesion. Iron laden cells and collagen cause the central vein signal. These results suggest the reason for visibility of cortical lesions in a high-resolution T2*-weighted scan2.Acknowledgements
Research supported by the intramural research program at NINDS, NIH.References
1. Nielsen AS et al, Focal cortical lesion detection in multiple sclerosis: 3 Tesla DIR versus 7 Tesla FLASH-T2. J Magn Reson Imaging. 2012 Mar 35(3):537
2. Duyn J et al, Study of brain anatomy with high-field MRI: recent progress. Magn Reson Imaging. 2010 Oct 28(8):1210
3. Tallantyre EC et al, Ultra-high-field imaging distinguishes MS lesions from asymptomatic white matter lesions. Neurology 76, 534
4. Sati et al, The central vein sign and its clinical evaluation for the diagnosis of multiple sclerosis: a consensus statement from the North American Imaging in Multiple Sclerosis Cooperative. Nature Reviews Neurology. 2016. 12, 714
5. Bennett KM et al. MRI of the basement membrane using charged nanoparticles as contrast agents. Magn Reson Med. 2008 Sep; 60(3): 564–574
Figures