5274
Optimization of CEST MRI at 7 Tesla for Detection of Cortical Gray Matter Pathology in Multiple Sclerosis1Department of Radiology and Radiological Sciences, Vanderbilt University Medical Center, Nashville, TN, United States, 2Vanderbilt University Institute of Imaging Science, Vanderbilt University Medical Center, Nashville, TN, United States, 3Philips Healthcare, Baltimore, MD, United States, 4Department of Neurology, Vanderbilt University Medical Center, Nashville, TN, United States, 5Department of Biomedical Engineering, Vanderbilt University, Nashville, TN, United States
Synopsis
Glutamate-sensitive chemical exchange saturation transfer (CEST) MRI has been applied in the human brain and shows promise for detecting pathology related to dysfunctional glutamate regulation. Glutamate abnormalities are linked to cortical gray matter (GM) pathology and cognitive impairment in multiple sclerosis (MS), but quantitative assessment techniques are lacking. We optimized and applied CEST MRI at 7.0T in phantoms and in vivo to evaluate sensitivity to glutamate and the effect of saturation pulse duration. Our results show increased CEST contrast in cortical GM of MS patients relative to controls and demonstrate the potential of CEST in characterizing GM damage in MS.
Purpose
Gray matter (GM) pathology has a predominant impact on physical and cognitive disability of patients with multiple sclerosis (MS). However, GM pathology is difficult to detect using conventional MRI.1 MR spectroscopy has shown neurochemical changes (i.e. dysfunctional regulation of glutamate) relate to cognitive impairment (CI), but is sub-optimal for surveying multiple eloquent GM regions simultaneously.2,3 MRI techniques sensitive to molecular changes in GM that precede macroscopic lesions and atrophy may facilitate earlier detection and treatment of CI in MS. Chemical exchange saturation transfer (CEST) MRI harnesses solute-to-water proton exchange to enhance detection sensitivity of low-concentration, mobile metabolites and can be implemented at higher resolution with large coverage.4 In theory, sensitivity to exchange is driven by the applied field (γB1), while specificity for the moiety of interest is driven by saturation bandwidth. Glutamate amine protons have exchange rates in the intermediate to fast exchange regime and resonate near water,5 so measurement of the CEST effect is challenging. Our work seeks to optimize CEST sequences for improved glutamate contrast in the cortical GM at 7T for detection of CI-related damage. To this end, we investigated the effect of increased saturation pulse duration for a given applied field.Methods
A 2D multi-shot TFE sequence (2x2x10mm3 resolution, TR/TE/α=3.9ms/2.7ms/10°) was applied in glutamate phantoms using a 7T MR scanner (Philips Achieva) and a volume transmit, 32-ch receive head coil (Nova Medical). CEST data were acquired using a 4.25μT pulse train of 10 60ms RF pulses (90% duty cycle, 600ms total saturation duration) at 43 frequency offsets sampled asymmetrically between +/-5.0ppm and 13 interspersed, non-saturated reference images (S0) to correct for signal drift.6 A WAter Saturation Shift Referencing (WASSR) scan7 and a B1 map (dual-TR actual flip angle method,8 TR1/TR2/TE/α=35ms/160ms/2.0ms/60°) were acquired for B0 and B1 correction of CEST data, respectively.
In vivo CEST imaging was performed in 3 healthy volunteers (22-30yr, 1F/2M) and 3 patients with MS (35-45yr, 2F/1M, Expanded Disability Status Scale (EDSS) scores 2-6) after signed, informed consent. The same CEST sequence used for phantoms was applied except for 1.5x1.5x10mm3 resolution and TR/TE/α=4.1ms/2.7ms/10°.
Tissue maps were segmented from a 3D MP-RAGE using SPM12. CEST dynamics were co-registered and normalized to a spline fit of the S0 data.6 CEST contrast was calculated as [S(-Δω)-S(+Δω)]/S(-Δω). For glutamate amine protons, a CEST effect is observed at Δω=2-3ppm.5 In order to investigate the trade-off between shorter saturation time and increased specificity, CEST data were compared to an unoptimized sequence consisting of 10 10-ms pulses at 4.25µT (100ms total saturation, TR/TE/α=5.6ms/2.7ms/10°) previously implemented in control (n=20) and MS patient (n=11) cohorts.
Results
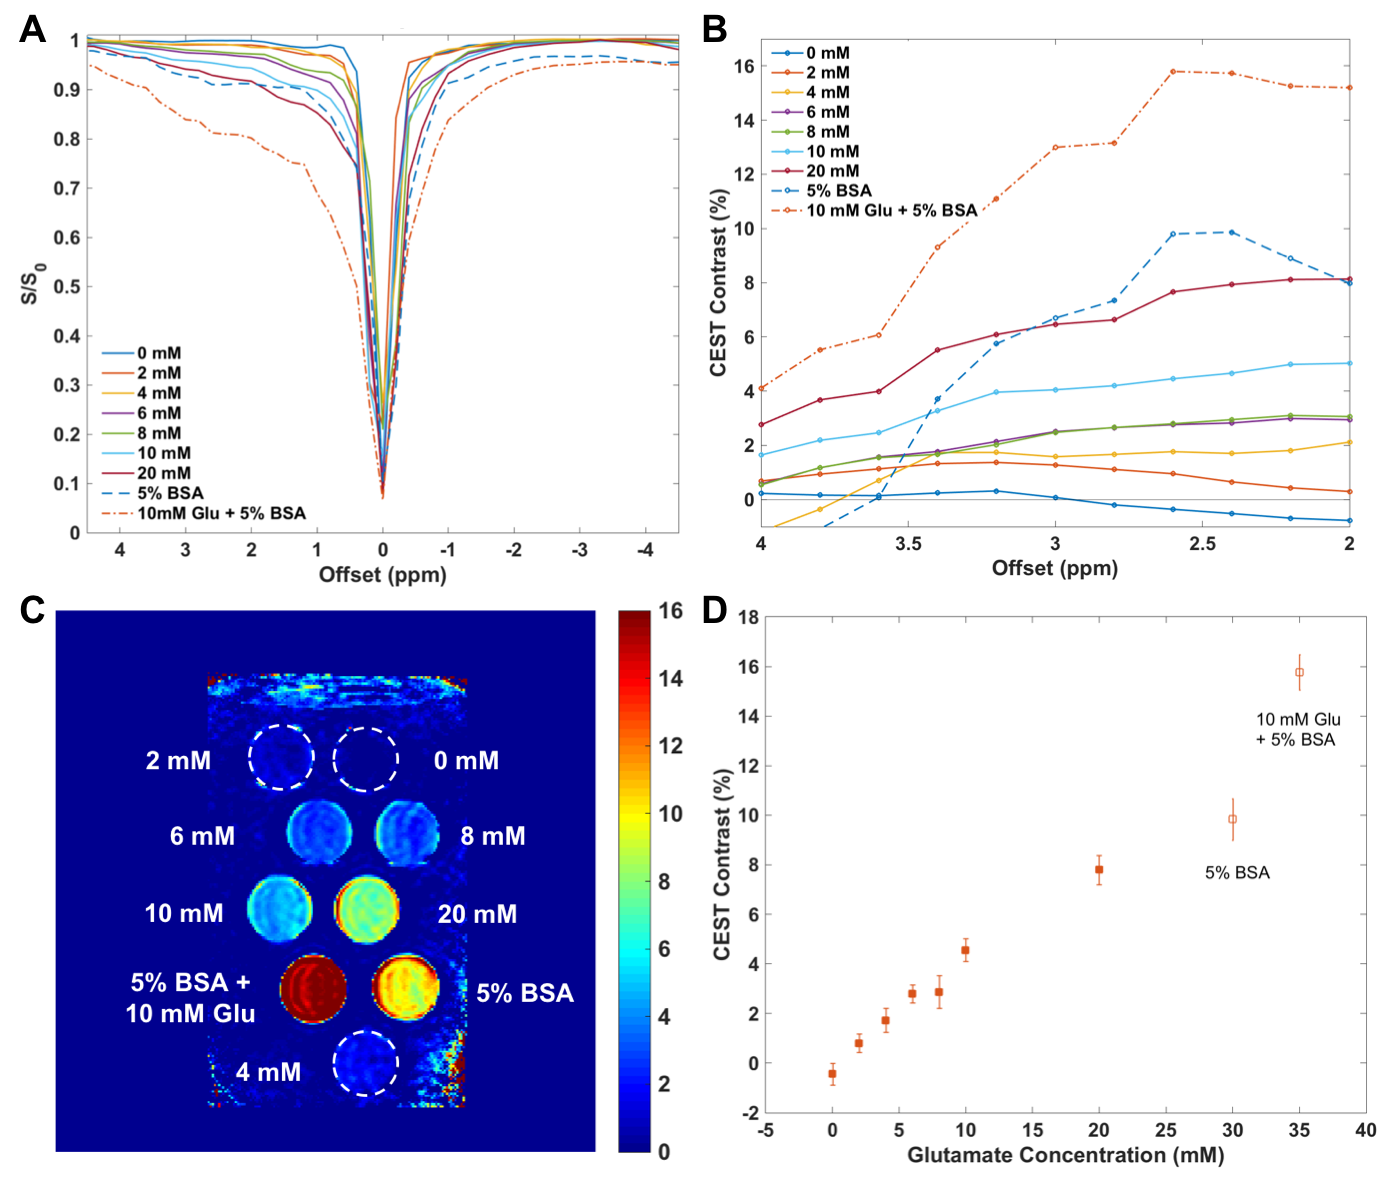
In phantoms containing glutamate and/or bovine serum albumin, z-spectra show CEST effects from 2-4ppm due to amine and amide protons (Fig.1A). CEST contrast was linearly correlated with glutamate concentration and was detectable for physiologically-relevant concentrations (~6-10mM) (Fig.1B-D).9,10
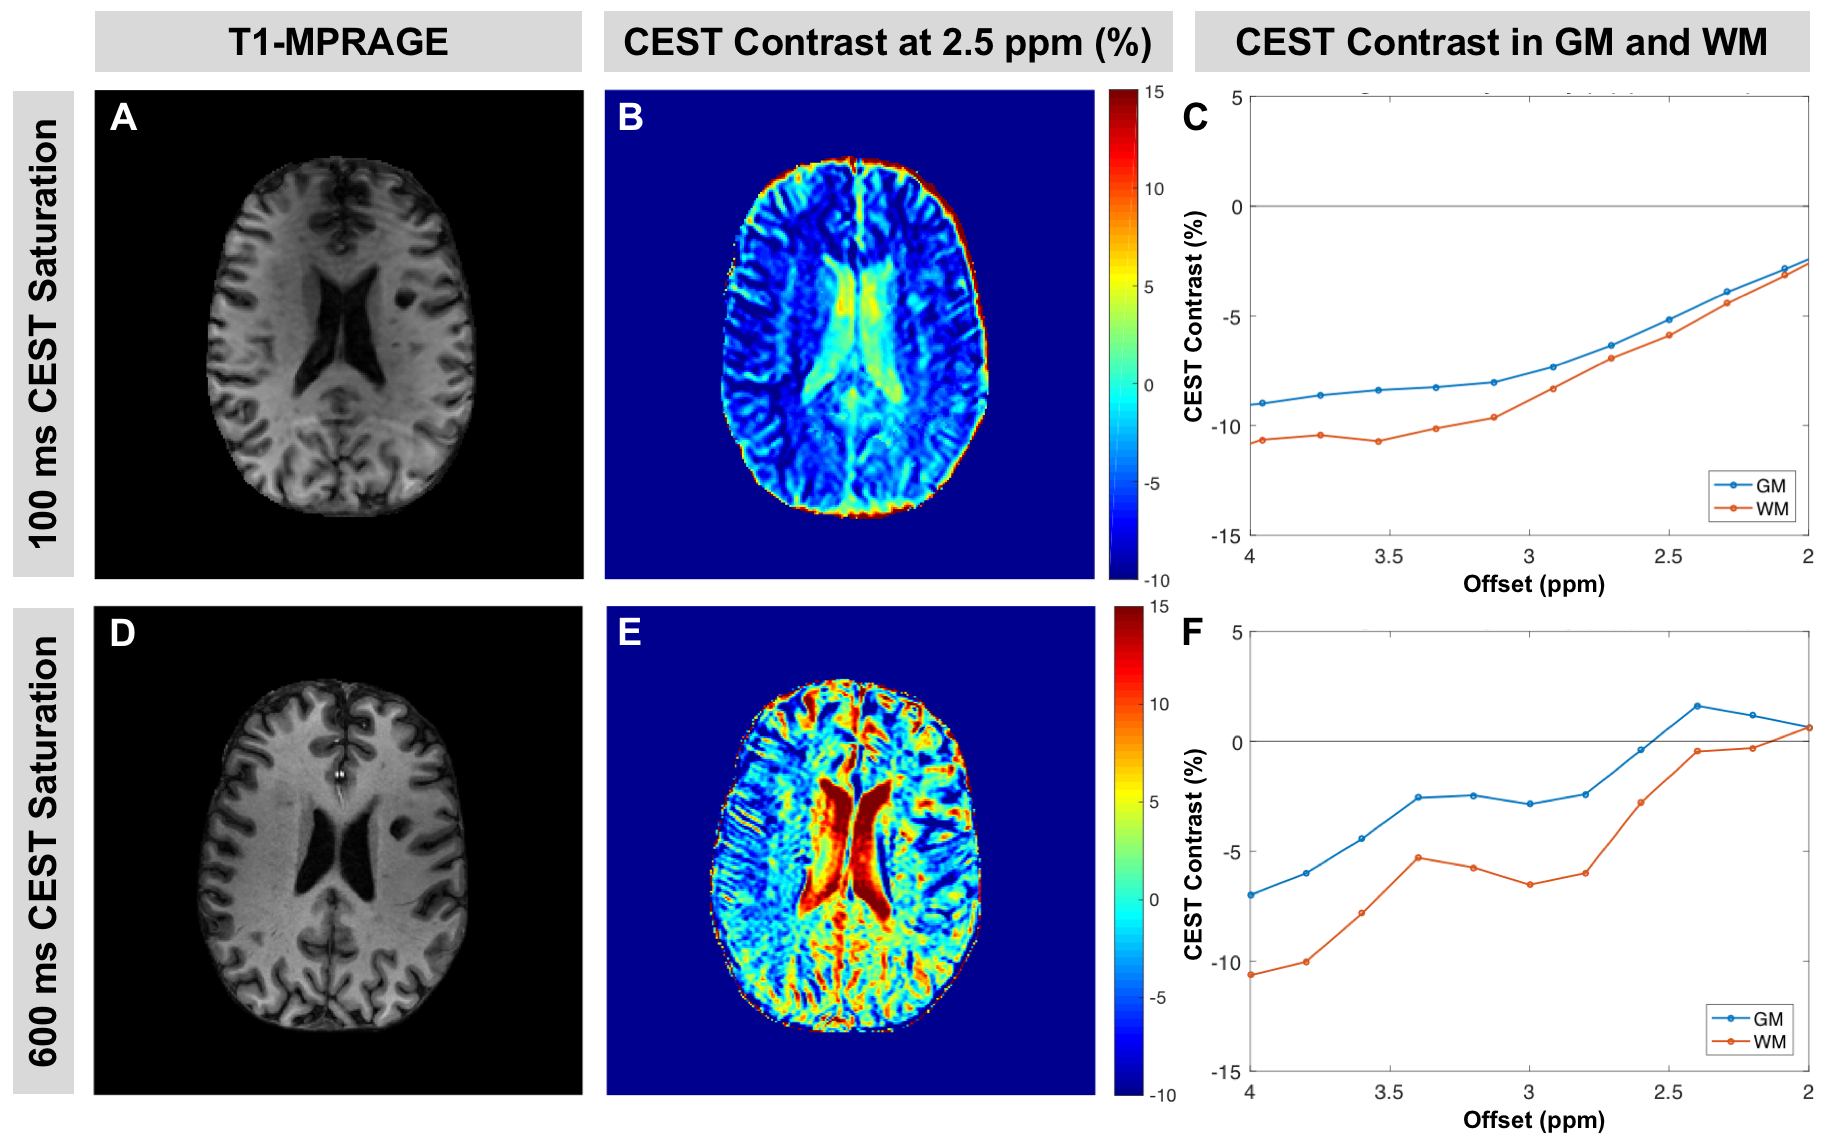
Figure 2 shows a comparison between a previously-implemented CEST sequence (100ms saturation, Fig.2A-C) and the sequence with 600ms saturation (Fig.2D-F) in a patient with MS (F, 45yrs, EDSS=2). With the longer saturation duration, CEST contrast is increased in the offset frequency range of 2-3.5ppm, which corresponds with glutamate amine proton resonance (Fig.2C,F). Additionally, glutamate-associated contrast is greater in GM than in WM as expected for both sequences, and the difference between GM and WM is increased with longer saturation.
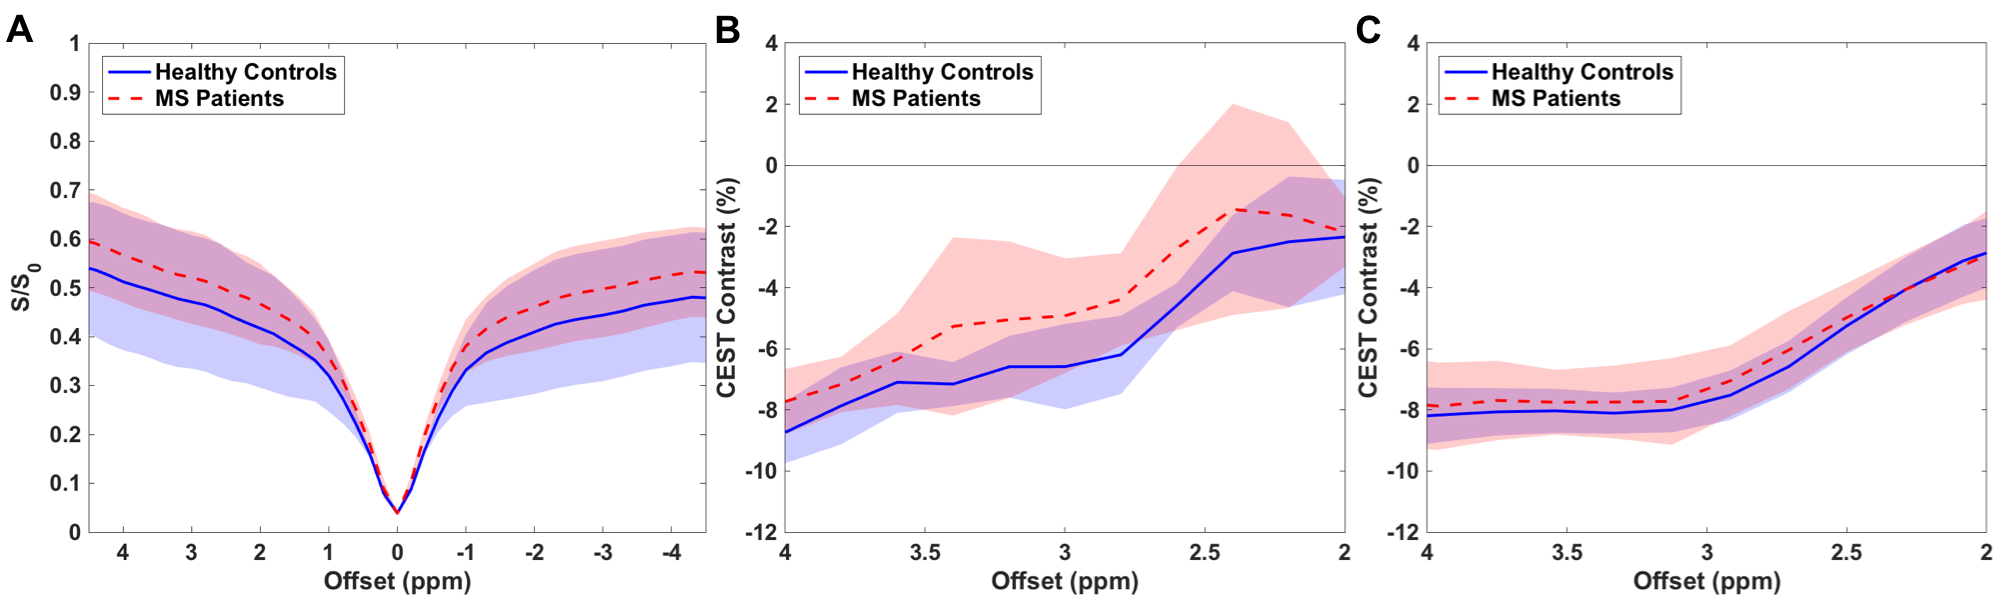
Preliminary results for the 600ms saturation sequence show differences between healthy controls and patients with MS in the z-spectra and CEST contrast for cortical GM (Fig.3A-B). There is a trend toward increased CEST contrast for both groups as well as an increase in the contrast difference between healthy controls and MS patients in comparison to the sequence with shorter saturation implemented previously (Fig.3B-C). Peaks in contrast near 2.5 and 3.5ppm are suggestive of increased sensitivity to amine (i.e. glutamate) and amide (i.e. protein and peptide) proton resonance (Fig.3B).
Discussion and Conclusions
Thus far, phantom experiments and preliminary in vivo data suggest that the CEST sequence with increased saturation duration may be more sensitive and specific to changes in glutamate levels in cortical GM, which is important to investigating pathology related to cognitive function and physical integrity. In ongoing work, the CEST sequence is being applied in a larger cohort of healthy controls and MS patients alongside administration of a battery of cognitive tests in order to investigate correlations between glutamate-sensitive CEST and CI. Our results demonstrate the potential of this MRI technique to meet a need for detecting cortical GM pathology in MS prior to the appearance of GM atrophy and lesions, which is critical to early intervention and treatment evaluation.Acknowledgements
The authors would like to acknowledge all of the patients and control subjects who volunteered for our study, Dr. Paul Newhouse for help with design of cognitive testing methods, and our MRI technologists: Kristen George-Durrett, Leslie McIntosh, Clair Jones, and Chris Thompson. Dr. O’Grady is supported by NIH/NINDS 1F32NS101788-01. This work was supported in part by funding from National MS Society, DoD W81XWH-13-1-0073, and Vanderbilt CTSA Grant UL1TR000445 from the National Center for Advancing Translational Sciences.References
1. Rocca MA, et al., Clinical and imaging assessment of cognitive dysfunction in multiple sclerosis. Lancet Neurol. 2015; 14(3): 302-17.
2. Srinivasan R, et al. Evidence of elevated glutamate in multiple sclerosis using magnetic resonance spectroscopy at 3 T. Brain. 2005; 128(Pt 5): 1016-25.
3. Muhlert N, et al. Memory in multiple sclerosis is linked to glutamate concentration in grey matter regions. J Neurol Neurosurg Psychiatry. 2014; 85(8): 833-9.
4. van Zijl PC, et al. Mechanism of magnetization transfer during on-resonance water saturation. A new approach to detect mobile proteins, peptides, and lipids. Magn Reson Med. 2003; 49(3): 440-9.
5. Cai K, et al. Magnetic resonance imaging of glutamate. Nat Med. 2012; 18(2): 302-6.
6. Jones CK, Huang A, Xu J, et al. Nuclear Overhauser enhancement (NOE) imaging in the human brain at 7T. Neuroimage. 2013; 77: 114-124.
7. Kim M.; et al. Water saturation shift referencing (WASSR) for chemical exchange saturation transfer (CEST) experiments. Magn Reson Med. 2009; 61(6): 1441-50.
8. Yarnykh VL. Actual flip-angle imaging in the pulsed steady state: a method for rapid three-dimensional mapping of the transmitted radiofrequency field. Magn Reson Med. 2007; 57: 192-200.
9. McKenna MC. The glutamate-glutamine cycle is not stoichiometric: fates of glutamate in brain. J. Neurosci. Res. 2007; 85: 3347-3358.
10. Geurts JJ, et al. Measurement and clinical effect of grey matter pathology in multiple sclerosis. Lancet Neurol. 2012; 11(12): 1082-92.
Figures