5273
Surface-based Quantitative Susceptibility Mapping of Cortical Pathology in Multiple Sclerosis1Department of Information Engineering, University of Padova, Padova, Italy, 2Department of Neurological, Biomedical and Movement Sciences, University of Verona, Verona, Italy, 3Faculty of Medicine, Imperial College London, London, United Kingdom, 4University of Verona, Verona, Italy
Synopsis
Multiple Sclerosis has been showed to be characterized by extent cortical sub-pial demyelination and iron alterations. Moreover, a “surface-in” gradient of pathology has been showed to be present in MS. In this study, we used QSM to investigate iron and/or myelin changes in the whole cortex. Moreover, we exploit surface-based methods to clarify the presence of a laminar specific changes in cortical susceptibility of Relapsing-Remitting MS patients.
Purpose
Histopathological examinations of multiple sclerosis MS
brains indicate that sub-pial demyelinating lesions appeared topographically
related to focal meningeal inflammation1. It has been hypothesized
that cortical demyelination in multiple sclerosis may be driven by meningeal
inflammation, accompanied by a decreasing gradient of demyelination from the
pial surface. This fact has also been linked to alterations in iron content. The
hypothesis that we want to test is the possible presence of changes in cortical
iron/myelin content. Quantitative Susceptibility Mapping (QSM) has been used to
study mainly the iron dis-regulation in Deep Grey Matter of MS patients. In
this study, we extend the study of the susceptibility to the whole cortex of MS
patient exploiting a high-resolution 3D Echo Planar Imaging sequence2,3, a surface-mapping method based on the Human Connectome Pipeline4 and non-parametric permutation testing5.
Methods
Subjects: A group of 30 RRMS patients (40.5±10.3 years mean±std; m:f 10:20; EDSS median 2, average disease duration 9.2±6.3 years) and 40 age- and sex-matched healthy controls (HC; 39.5±10.5 years; m:f 16:24) was examined in the current study.
Data acquisition: Participants were imaged at 3T (Philips Achieva TX R3.2.3.2) using a 3D single-echo segmented echo-planar-imaging (EPI) sequence1 (0.55x0x0.55x0.55 mm, TE/TR=29ms/51ms, FA=20°) 3D T1-weighted Turbo Field Echo sequence (1x1x1 mm, TE/TR=4.2ms/8.3ms, FA=8°) 3D FLAIR (1x1x1 mm, TE/TR=268/5500ms, TI=1850ms).
Analysis: We reconstructed quantitative susceptibility
maps (χ) from the single-echo 3D-EPI using a Total Generalized Variation (TGV)
algorithm which incorporates individual steps of phase unwrapping, background
field removal and dipole inversion in a single iteration3,6. 3D FLAIR was used to semi-automatically segment MS lesions that were
then used to perform lesion filling on the 3D T1. Filled images were then analysed
with Freesurfer to reconstruct WM/GM and pial surface boundaries. Surfaces were
manually checked and corrected for topological defects. These surfaces were
used to compute equi-volume cortical surface layers by sampling the surface
vertices in steps of 25% of cortical volume (0%: depth 1 - WM/GM, 100%: depth 5
- pial surface) across the entire cortex (Figure 1 and 2). The resulting
surfaces were re-sampled on the original 3D-EPI space to extract χ values for
each vertex and each layer depth.
To perform group comparison, we registered individual subject’s native-mesh
surfaces to Conte69 population-average surfaces with L-R correspondence7. Group-wise χ differences in the cortex were analysed,
layer-by-layer, using a permutation-based test with PALM5 employing threshold-free cluster enhancement
and differences were considered statistically significant with p-value<0.05
family-wise corrected to address multiple comparisons. We excluded both the
WM/GM surface and the pial surface from the statistical analysis due to the low
reliability of the QSM map in those areas. The cortex was parcellated in ROI
(Braincolor8 http://braincolor.mindboggle.info/protocols/index.html) and the percentage of the statistically significant vertices was
calculated as a measure of extension of χ changes.
Results
A “surface-in” gradient, driven from the pial surface,
of increased susceptibility can be seen in several regions of the cortex of the
RRMS group (Figure 3 – left). Moreover, we observed an increased extent of
changes in χ over the cortex depending on the considered layer (Figure 4).
Permutation tests revealed significant differences
between the two groups in extent regions of the cortex (p-value reported in Figure
3 - right). Most of the differences showed an increased χ in the RRMS group
compared to the HC group (χ changes - Figure 3 - left). Figure 4 reports the
maximum p-value associated with each ROI and the percentage of the extension of
the area associated to a change in χ.
Discussion
This study reveals the presence of an extended change in χ of cortical RRMS patients compared to HC. Remarkably, the RRMS group showed always an increased χ, which could be linked to iron accumulation, since iron is the more abundant paramagnetic compound in the GM tissue. However, we cannot exclude that the presence of demyelinated tissue or atrophy9,10 could have contributed to this increase. The most interesting finding is that this change is depth-dependent, showing more spread differences in the more superficial layers of the cortex compared to the inner ones. Further studies are necessary to better disentangle the contribution of cortical demyelination and/or cell alterations8 that requires the estimation of χ, R2*, R1 and atrophy.
Conclusion
The presence of a depth-mediated change of χ in the cortex of RRMS patients is reported. The differences are more extended in the more superficial layers of the cortical ribbon than the inner ones, providing a support for the hypothesis of a possible gradient “surface-in” of iron alterations accompanied with cortical demyelination in cortical areas of RRMS patients.Acknowledgements
No acknowledgement found.References
1. Magliozzi, R., Howell, O. W., Reeves, C., Roncaroli, F., Nicholas, R., Serafini, B., ... & Reynolds, R. (2010). A gradient of neuronal loss and meningeal inflammation in multiple sclerosis. Annals of neurology, 68(4), 477-493.
2. Sati, P., Thomasson, D. M., Li, N., Pham, D. L., Biassou, N. M., Reich, D. S., & Butman, J. A. (2014). Rapid, high-resolution, whole-brain, susceptibility-based MRI of multiple sclerosis. Multiple Sclerosis Journal, 20(11), 1464-1470.
3. Langkammer, C., Bredies, K., Poser, B. A., Barth, M., Reishofer, G., Fan, A. P., ... & Ropele, S. (2015). Fast quantitative susceptibility mapping using 3D EPI and total generalized variation. Neuroimage, 111, 622-630.
4. Glasser, M. F., Sotiropoulos, S. N., Wilson, J. A., Coalson, T. S., Fischl, B., Andersson, J. L., ... & Van Essen, D. C. (2013). The minimal preprocessing pipelines for the Human Connectome Project. Neuroimage, 80, 105-124.
5. Winkler, A. M., Ridgway, G. R., Webster, M. A., Smith, S. M., & Nichols, T. E. (2014). Permutation inference for the general linear model. Neuroimage, 92, 381-397.
6. Castellaro, M., Magliozzi, R., Palombit, A., Pitteri, M., Silvestri, E., Camera, V., ... & Calabrese, M. (2017). Heterogeneity of Cortical Lesion Susceptibility Mapping in Multiple Sclerosis. AJNR. American journal of neuroradiology. In press.
7. Van Essen, David C. "Cortical cartography and Caret software." Neuroimage 62.2 (2012): 757-764.
8. Klein, A., & Tourville, J. (2012). 101 labeled brain images and a consistent human cortical labeling protocol. Frontiers in neuroscience, 6.
9. Marques, J. P., Khabipova, D., & Gruetter, R. (2017). Studying cyto and myeloarchitecture of the human cortex at ultra-high field with quantitative imaging: R 1, R 2* and magnetic susceptibility. NeuroImage, 147, 152-163.
10. Schweser, F., Martins, A. L. R. D., Hagemeier, J., Lin, F., Hanspach, J., Weinstock-Guttman, B., ... & Zivadinov, R. (2017). Mapping of thalamic magnetic susceptibility in multiple sclerosis indicates decreasing iron with disease duration: A proposed mechanistic relationship between inflammation and oligodendrocyte vitality. NeuroImage, In press.
Figures
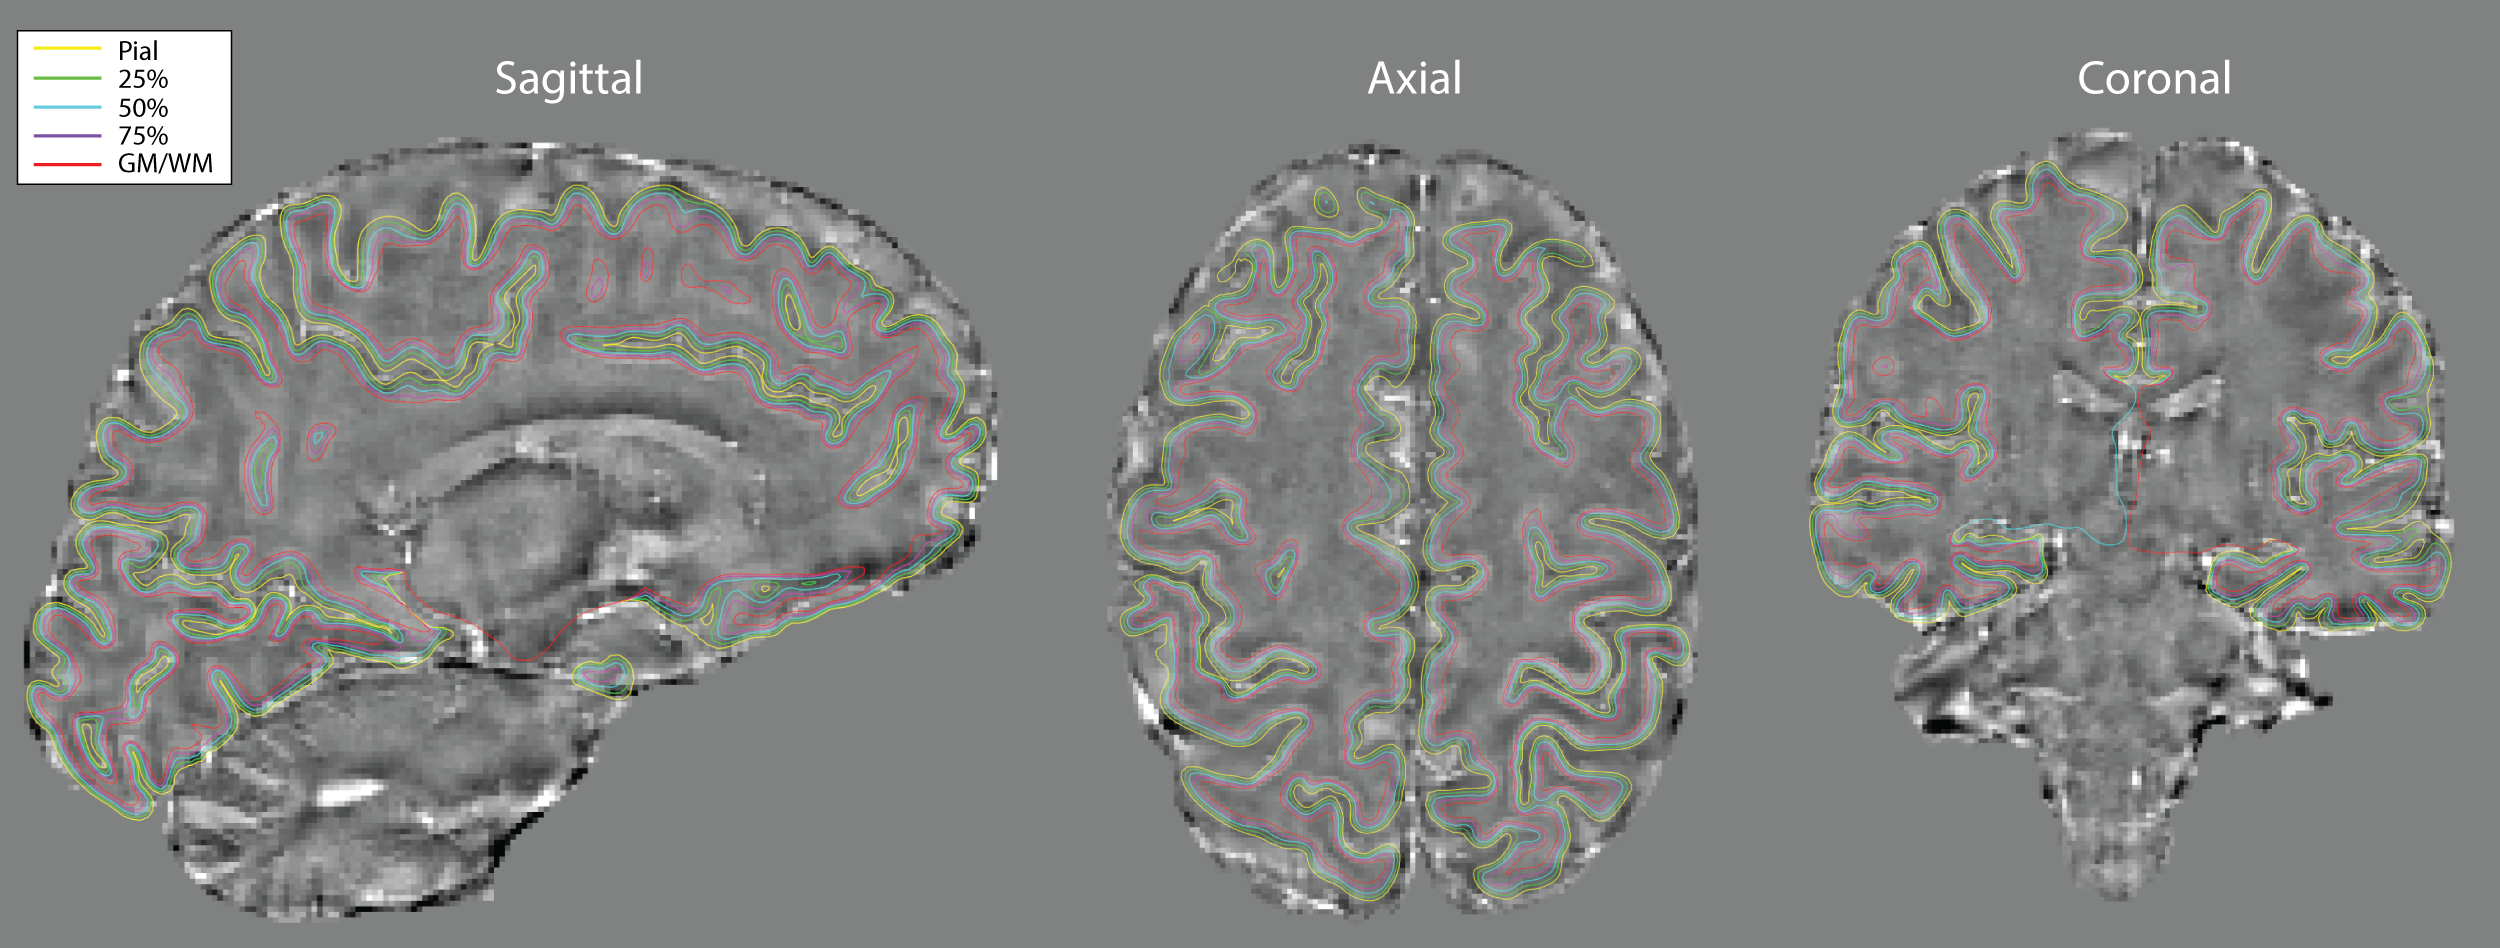
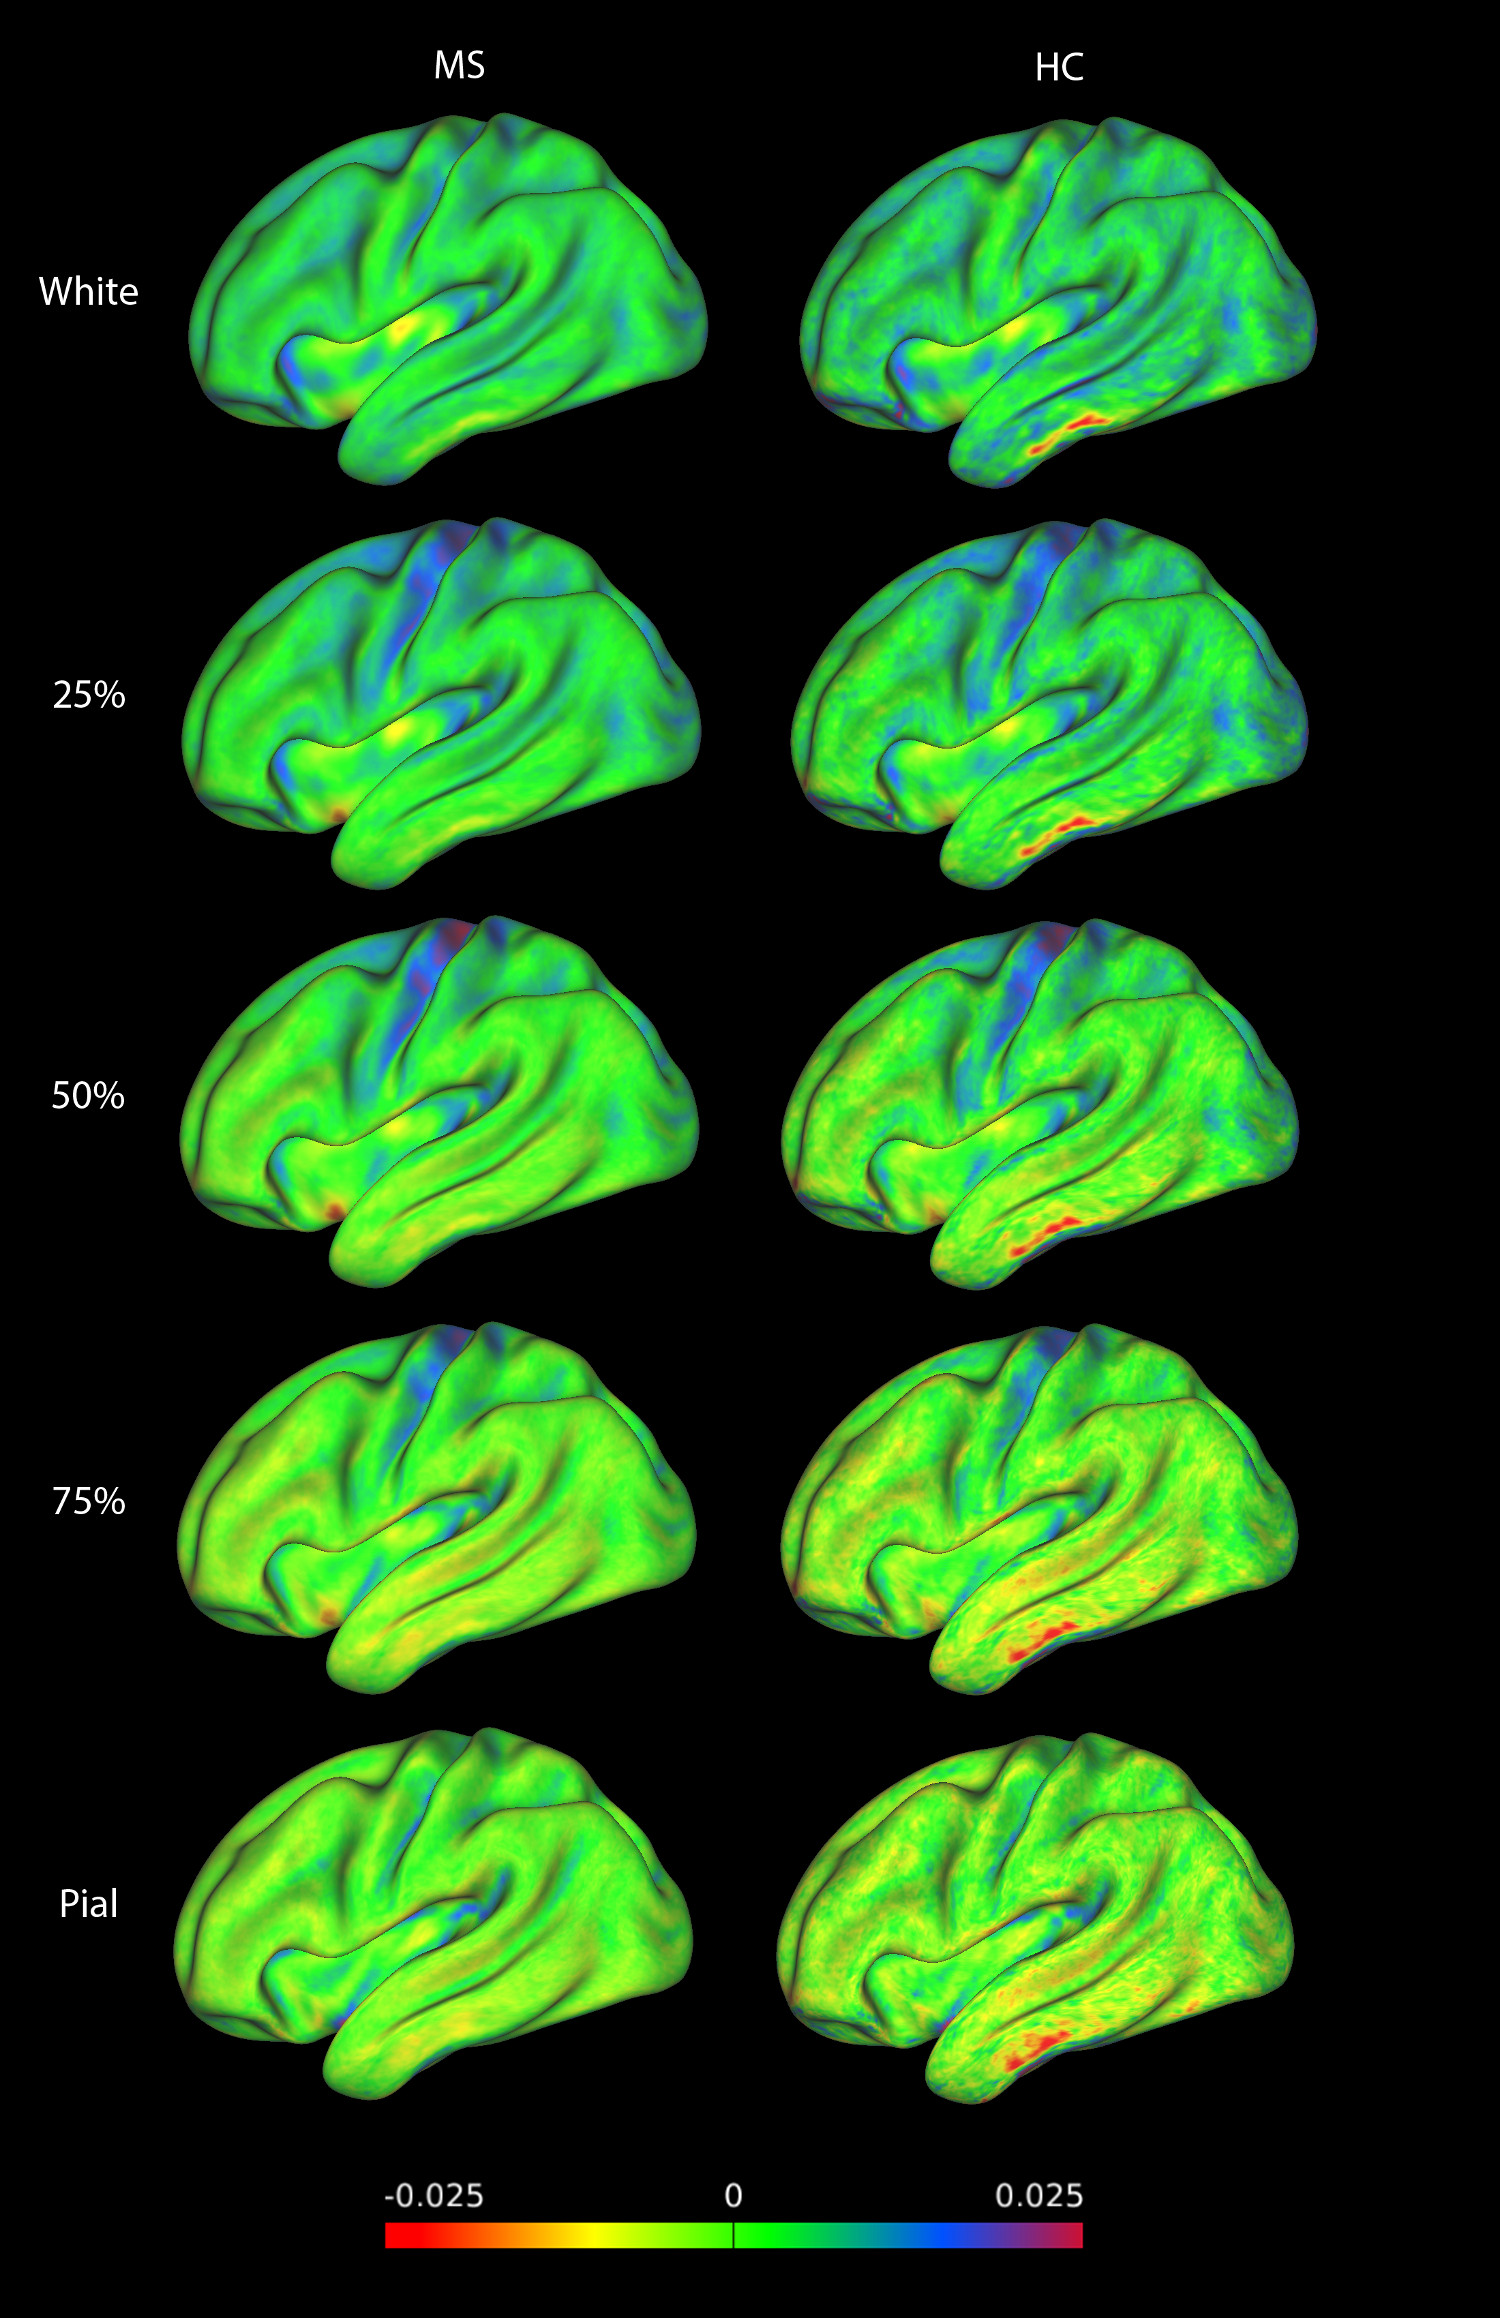
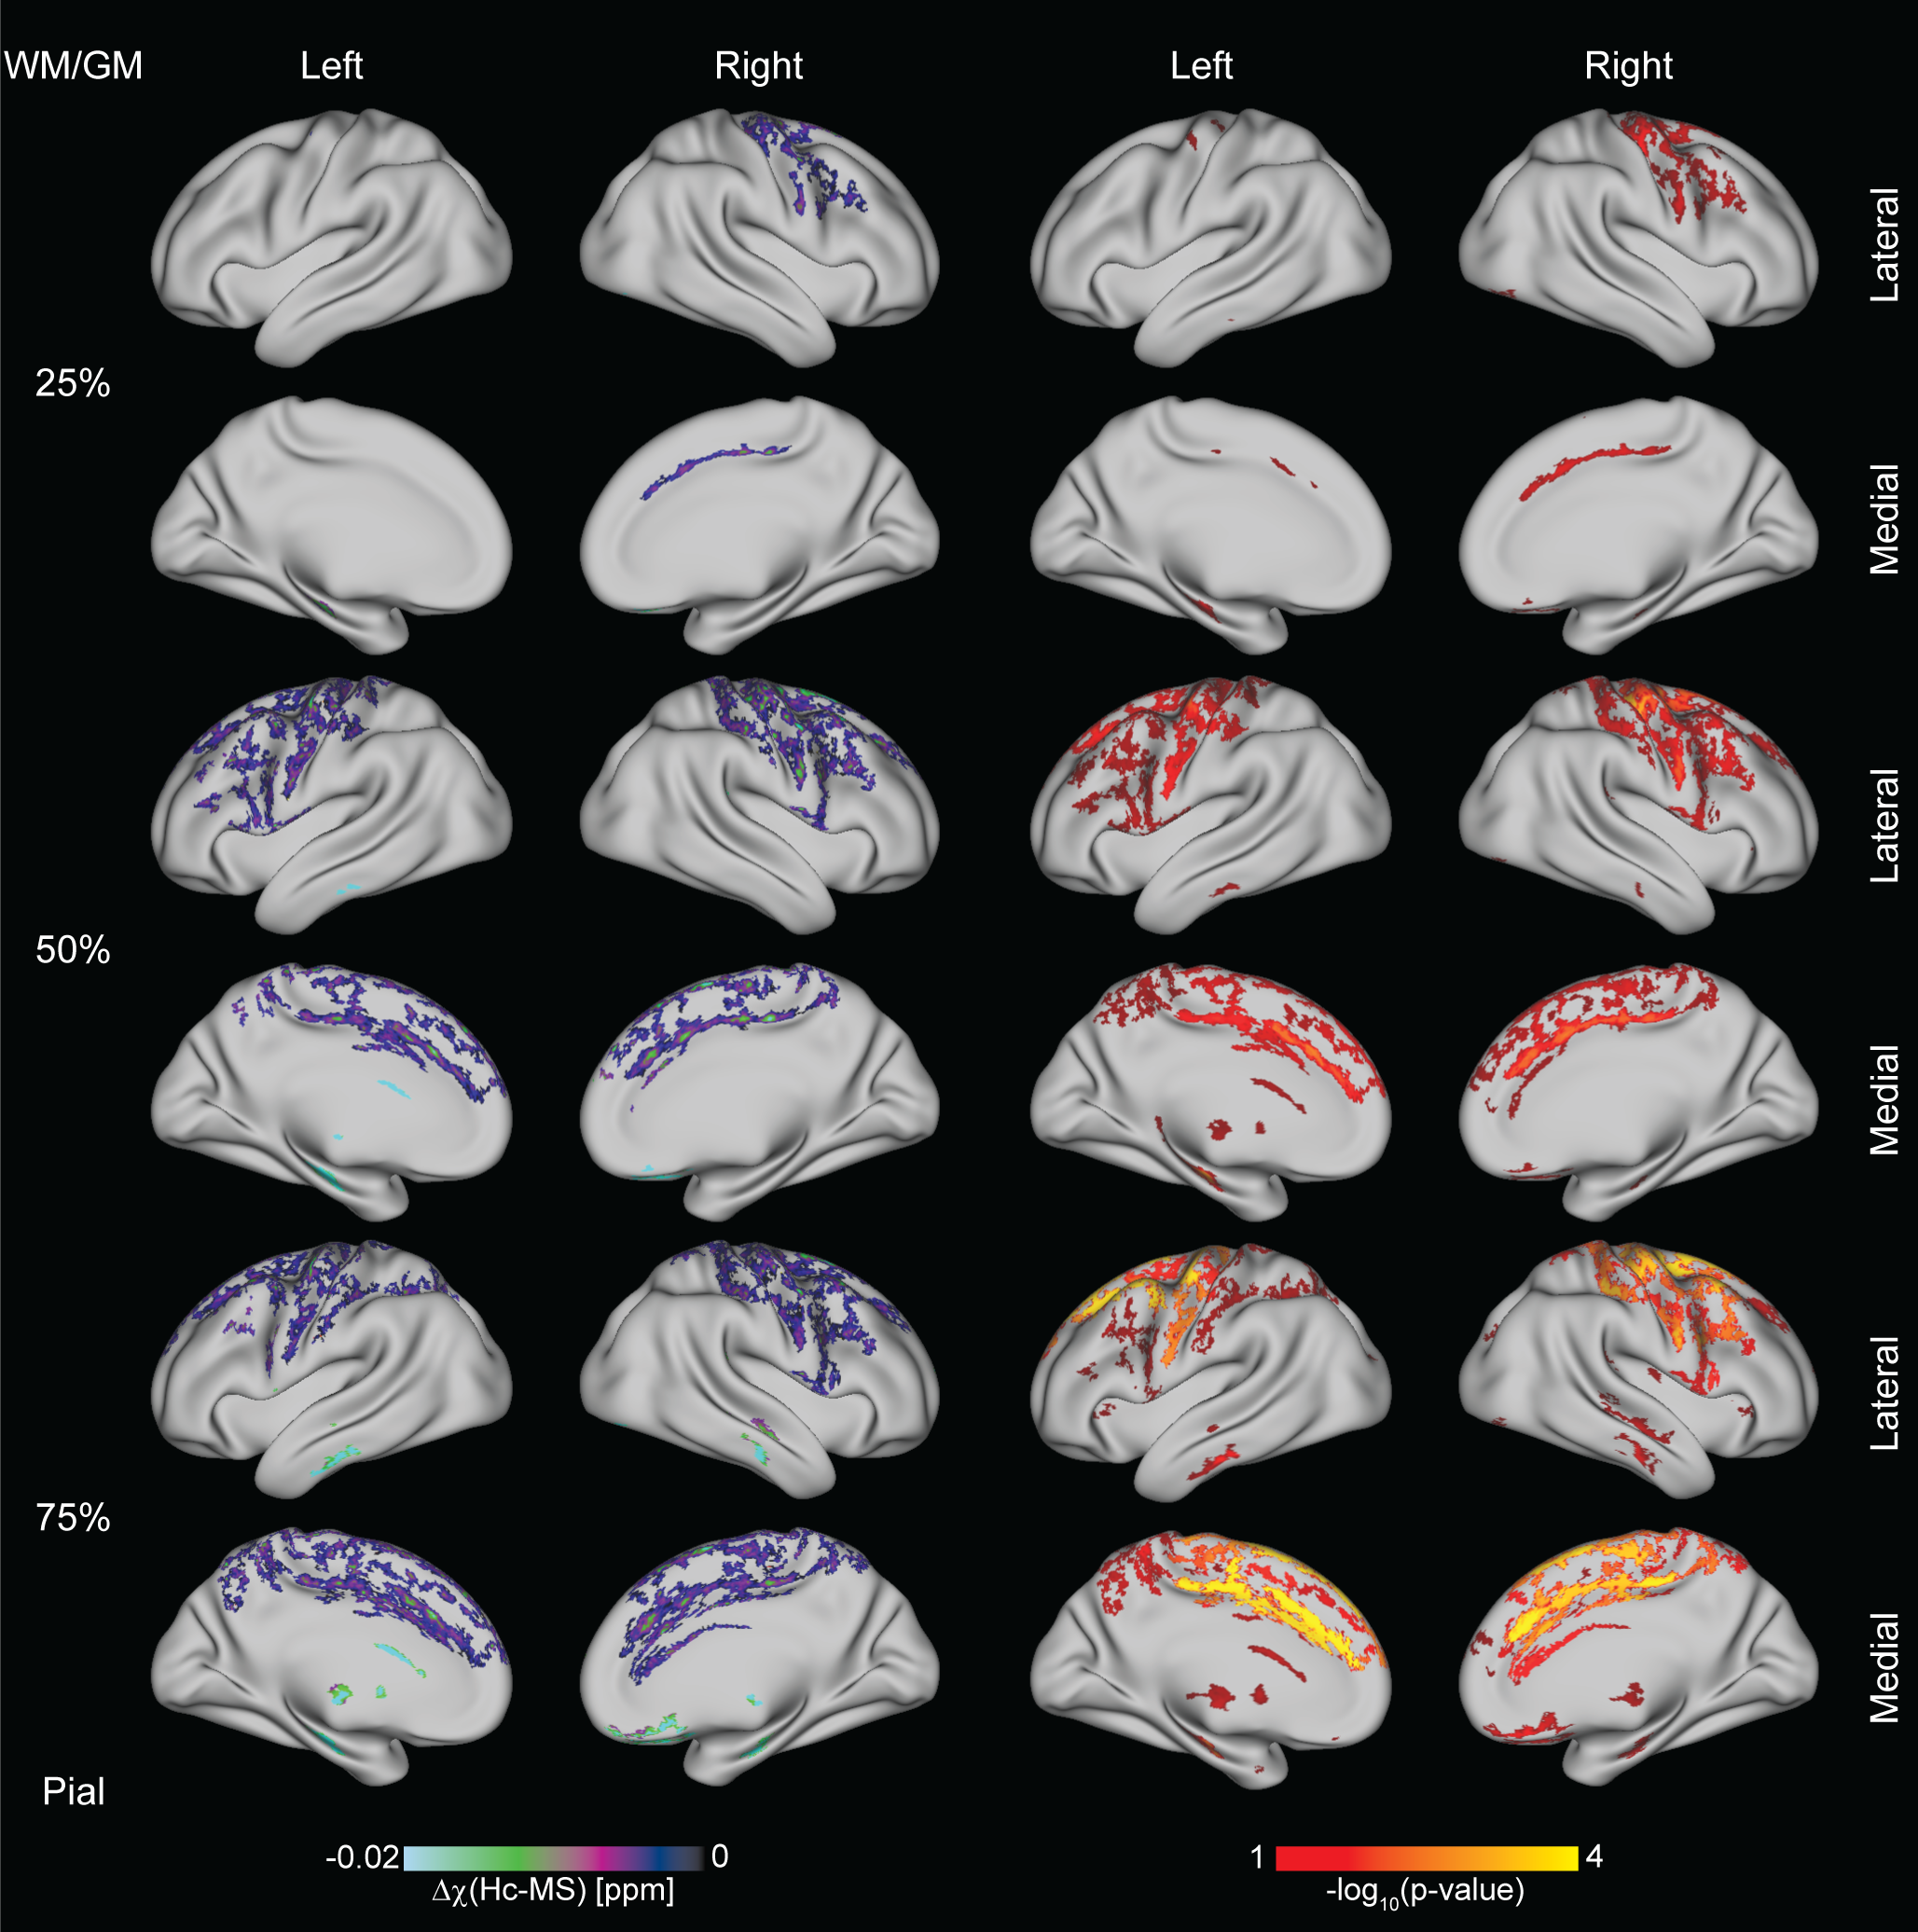
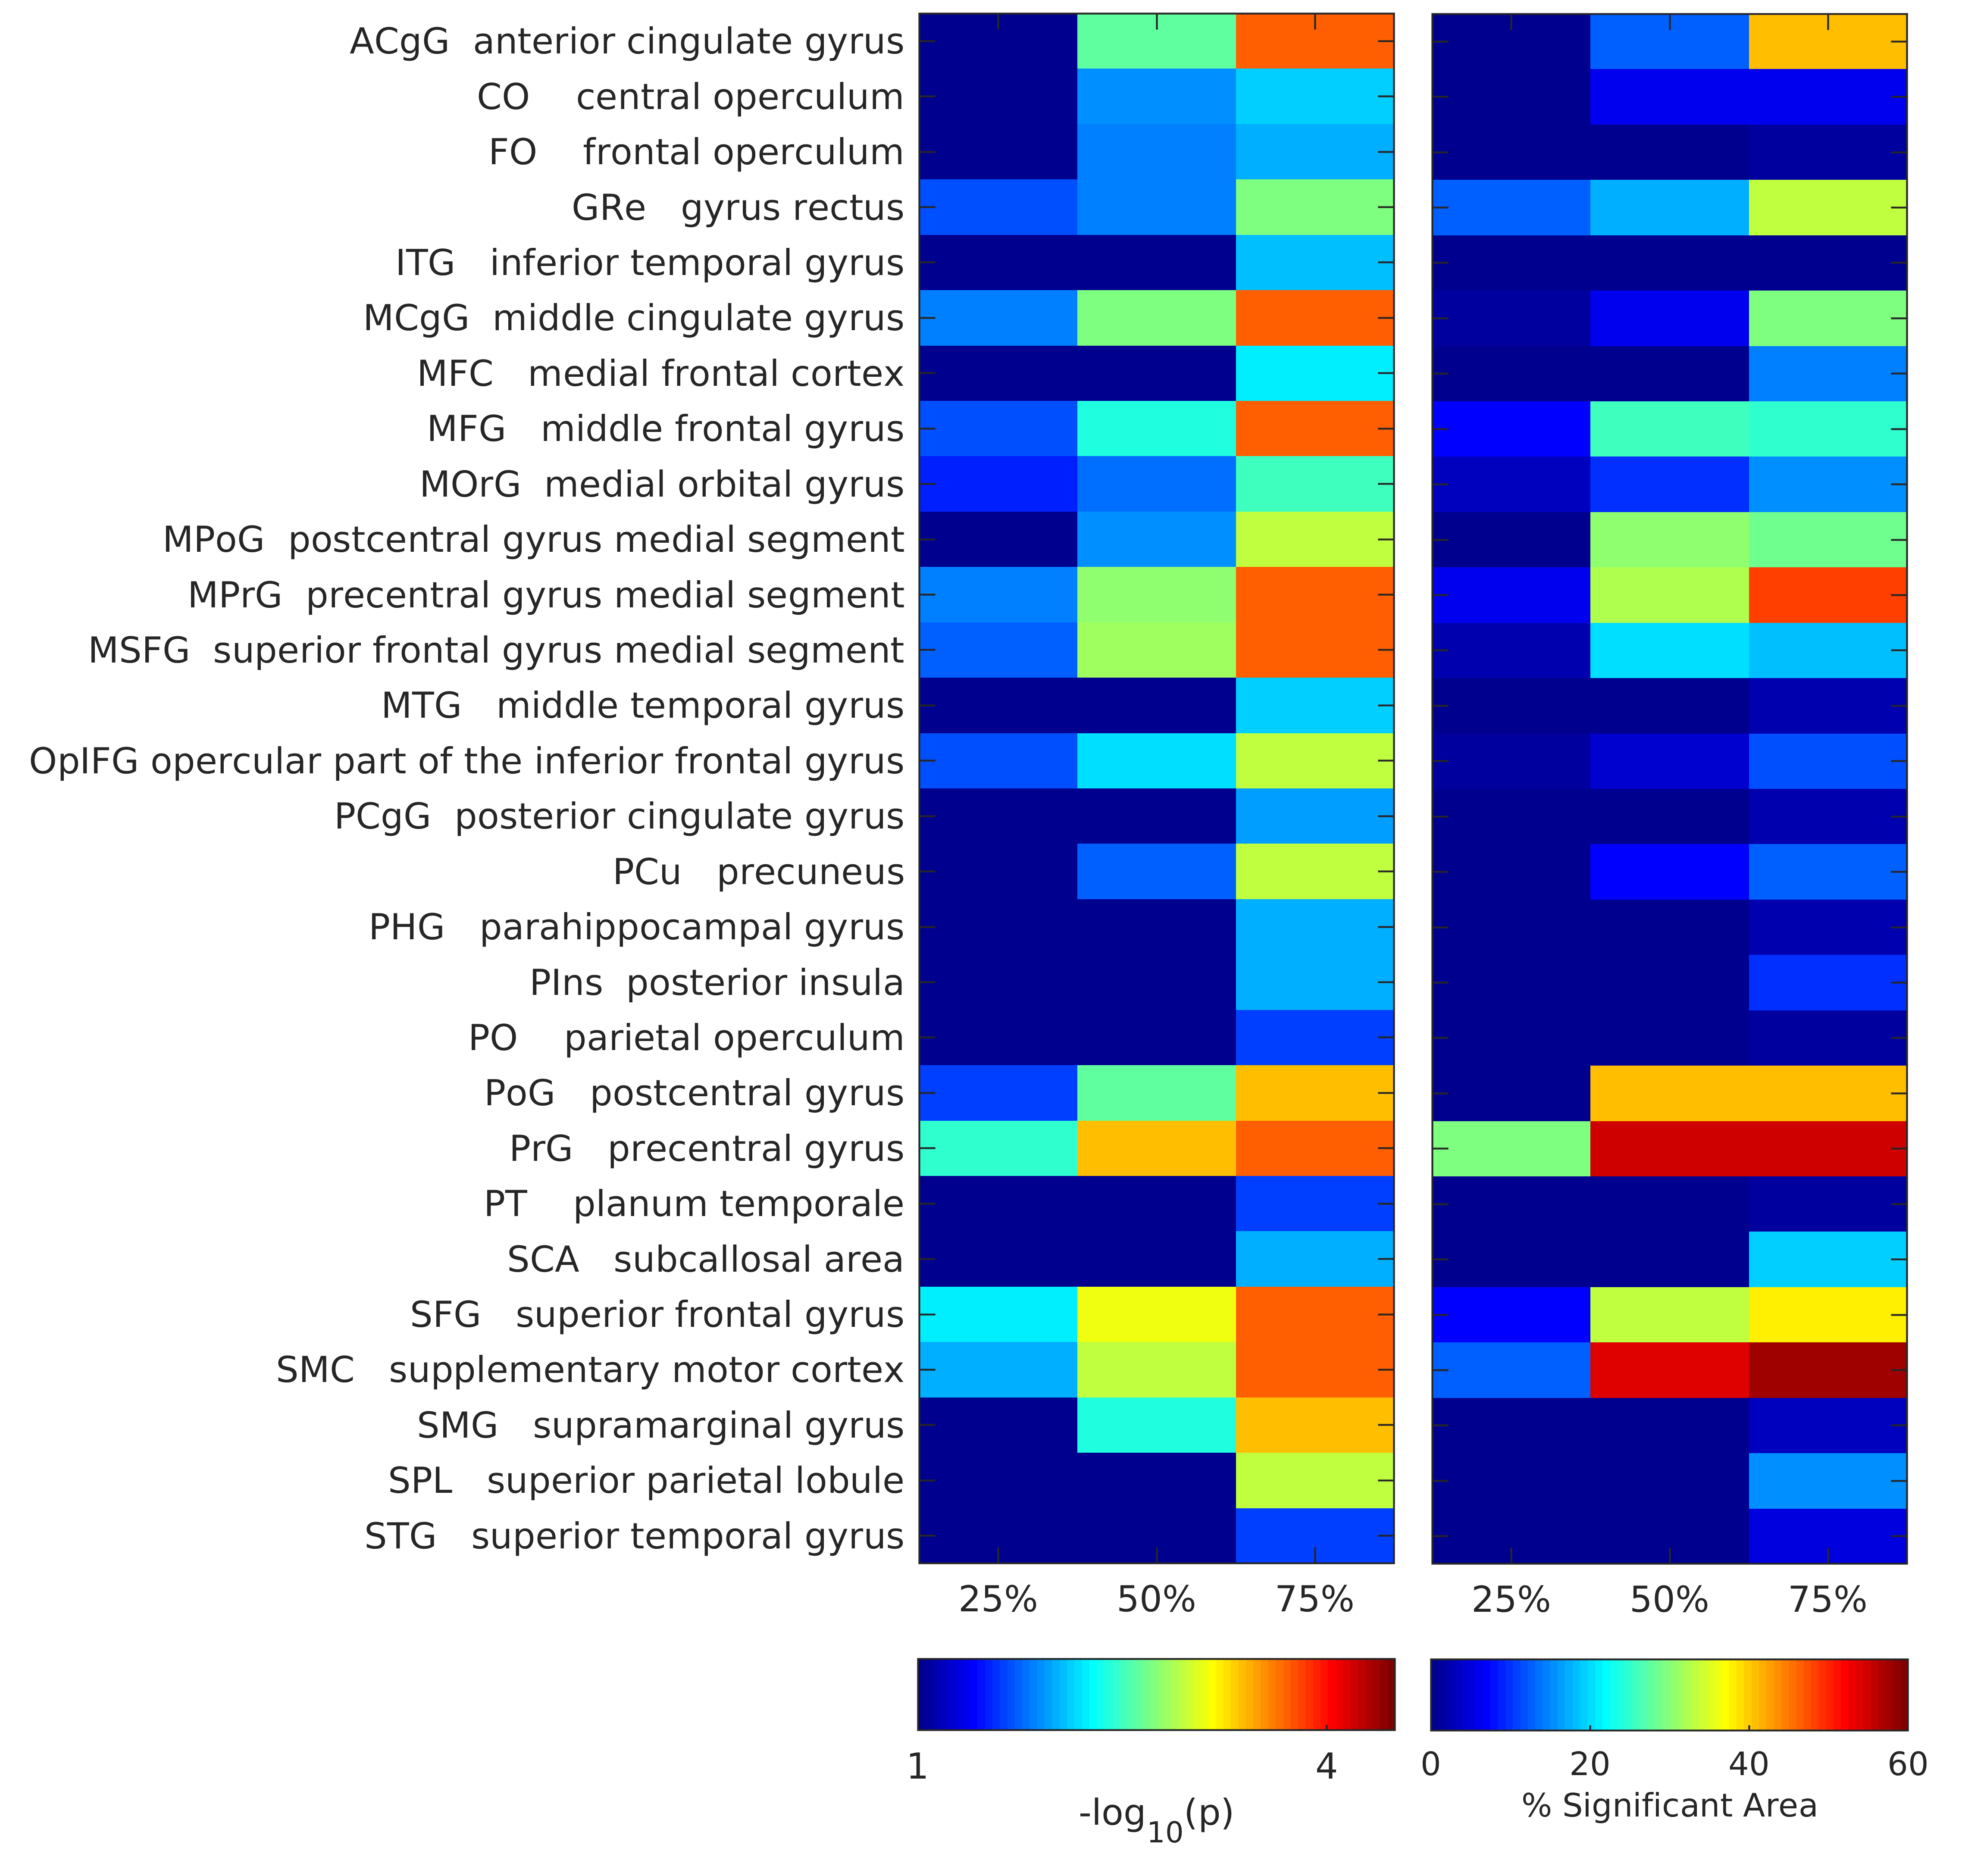
Figure 4. Regions of interest (ROI) that showed a change in susceptibility, for each ROI and each layer depth is reported the maximum p-value and the percentage of vertices that showed different magnetic susceptibility values between HC and RRMS subjects.