5272
Discriminative Analysis of Regional Evolution of Iron and Myelin/Calcium in Deep Gray Matter of Multiple Sclerosis and Healthy Subjects1Biomedical Engineering, University of Alberta, Edmonton, AB, Canada, 2Division of Neurology, University of Alberta, Edmonton, AB, Canada
Synopsis
We introduce Discriminative Analysis of Regional Evolution (DARE) of iron and myelin/calcium to assess specific changes in Deep Gray Matter (DGM) of Relapsing-Remitting Multiple Sclerosis (RRMS), Progressive MS (PMS) and corresponding age-matched healthy subjects, which we regress with disease severity. DARE enabled discriminative assessment of longitudinal changes in MS, and demonstrated superior performance compared to conventional bulk analysis. Iron decrease and myelin/calcium increase, and myelin/calcium changes, were the primary drivers of observed MRI longitudinal changes in RRMS and PMS DGM, respectively. Specific DARE measures of MS DGM can be used to predict MS Severity Score, and may reflect complex disease pathology.
Introduction
Combined R2* and Quantitative Susceptibility (QS) has been previously used in cross-sectional Multiple Sclerosis (MS) studies to distinguish Deep Gray Matter (DGM) iron accumulation and demyelination.1 We introduce Discriminative Analysis of Regional Evolution (DARE) of iron and myelin/calcium, which is used to define specific changes in DGM of MS and healthy subjects and were shown to correlate with disease severity.Materials and Methods
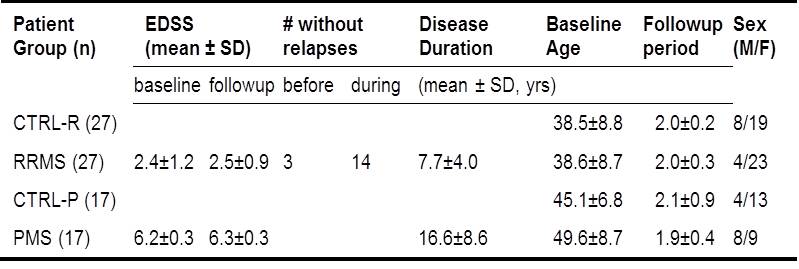
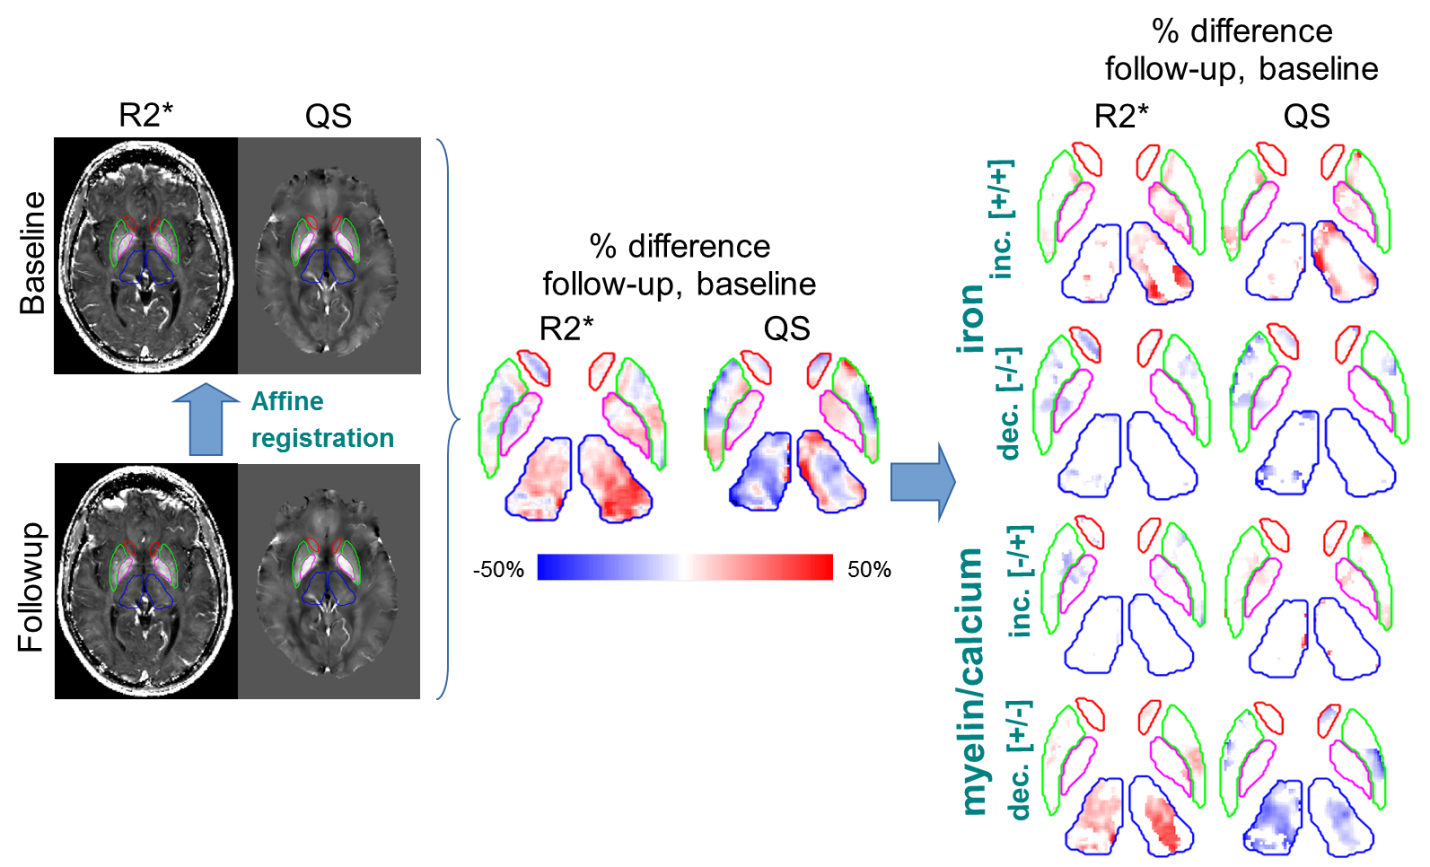
A 10-echo gradient-echo acquisition was used to compute R2* 2 and QS 3, 4, 5, 6 maps at baseline and 2-year followup in 27 relapsing-remitting MS (RRMS) and age-matched (P=0.98) healthy subjects, and 17 progressive MS (PMS) and age-matched (P=0.3) healthy subjects (Table 1). Automatic segmentation 7 of the Caudate Nucleus (CN), Thalamus (TH), Putamen (PU), Globus Pallidus (GP), Red Nucleus (RN), Substantia Nigra (SN), and Dentate Nucleus (DN) were used for quantification of regional volumes, bulk mean R2* and QS. DARE (Figure 1) utilized combined R2* & QS changes to compute spatial extent (size of DARE regions), mean intensity (of R2* and QS in DARE regions), and total longitudinal changes (sum of R2* and QS in DARE regions) of DGM iron and myelin/calcium over 2 years. Statistical examination using false detection rate correction at α=0.05 was employed using appropriate t-tests and non-parametric tests. For effect sizes, η was used for bulk analysis, while rank biserial correlation was used for DARE to account for non-normality.8 Multiple regression analysis using backward elimination of DGM structures (α=0.05, P=0.1) was used to regress bulk and DARE measures with followup Multiple Sclerosis Severity Scale (MSSS).Results
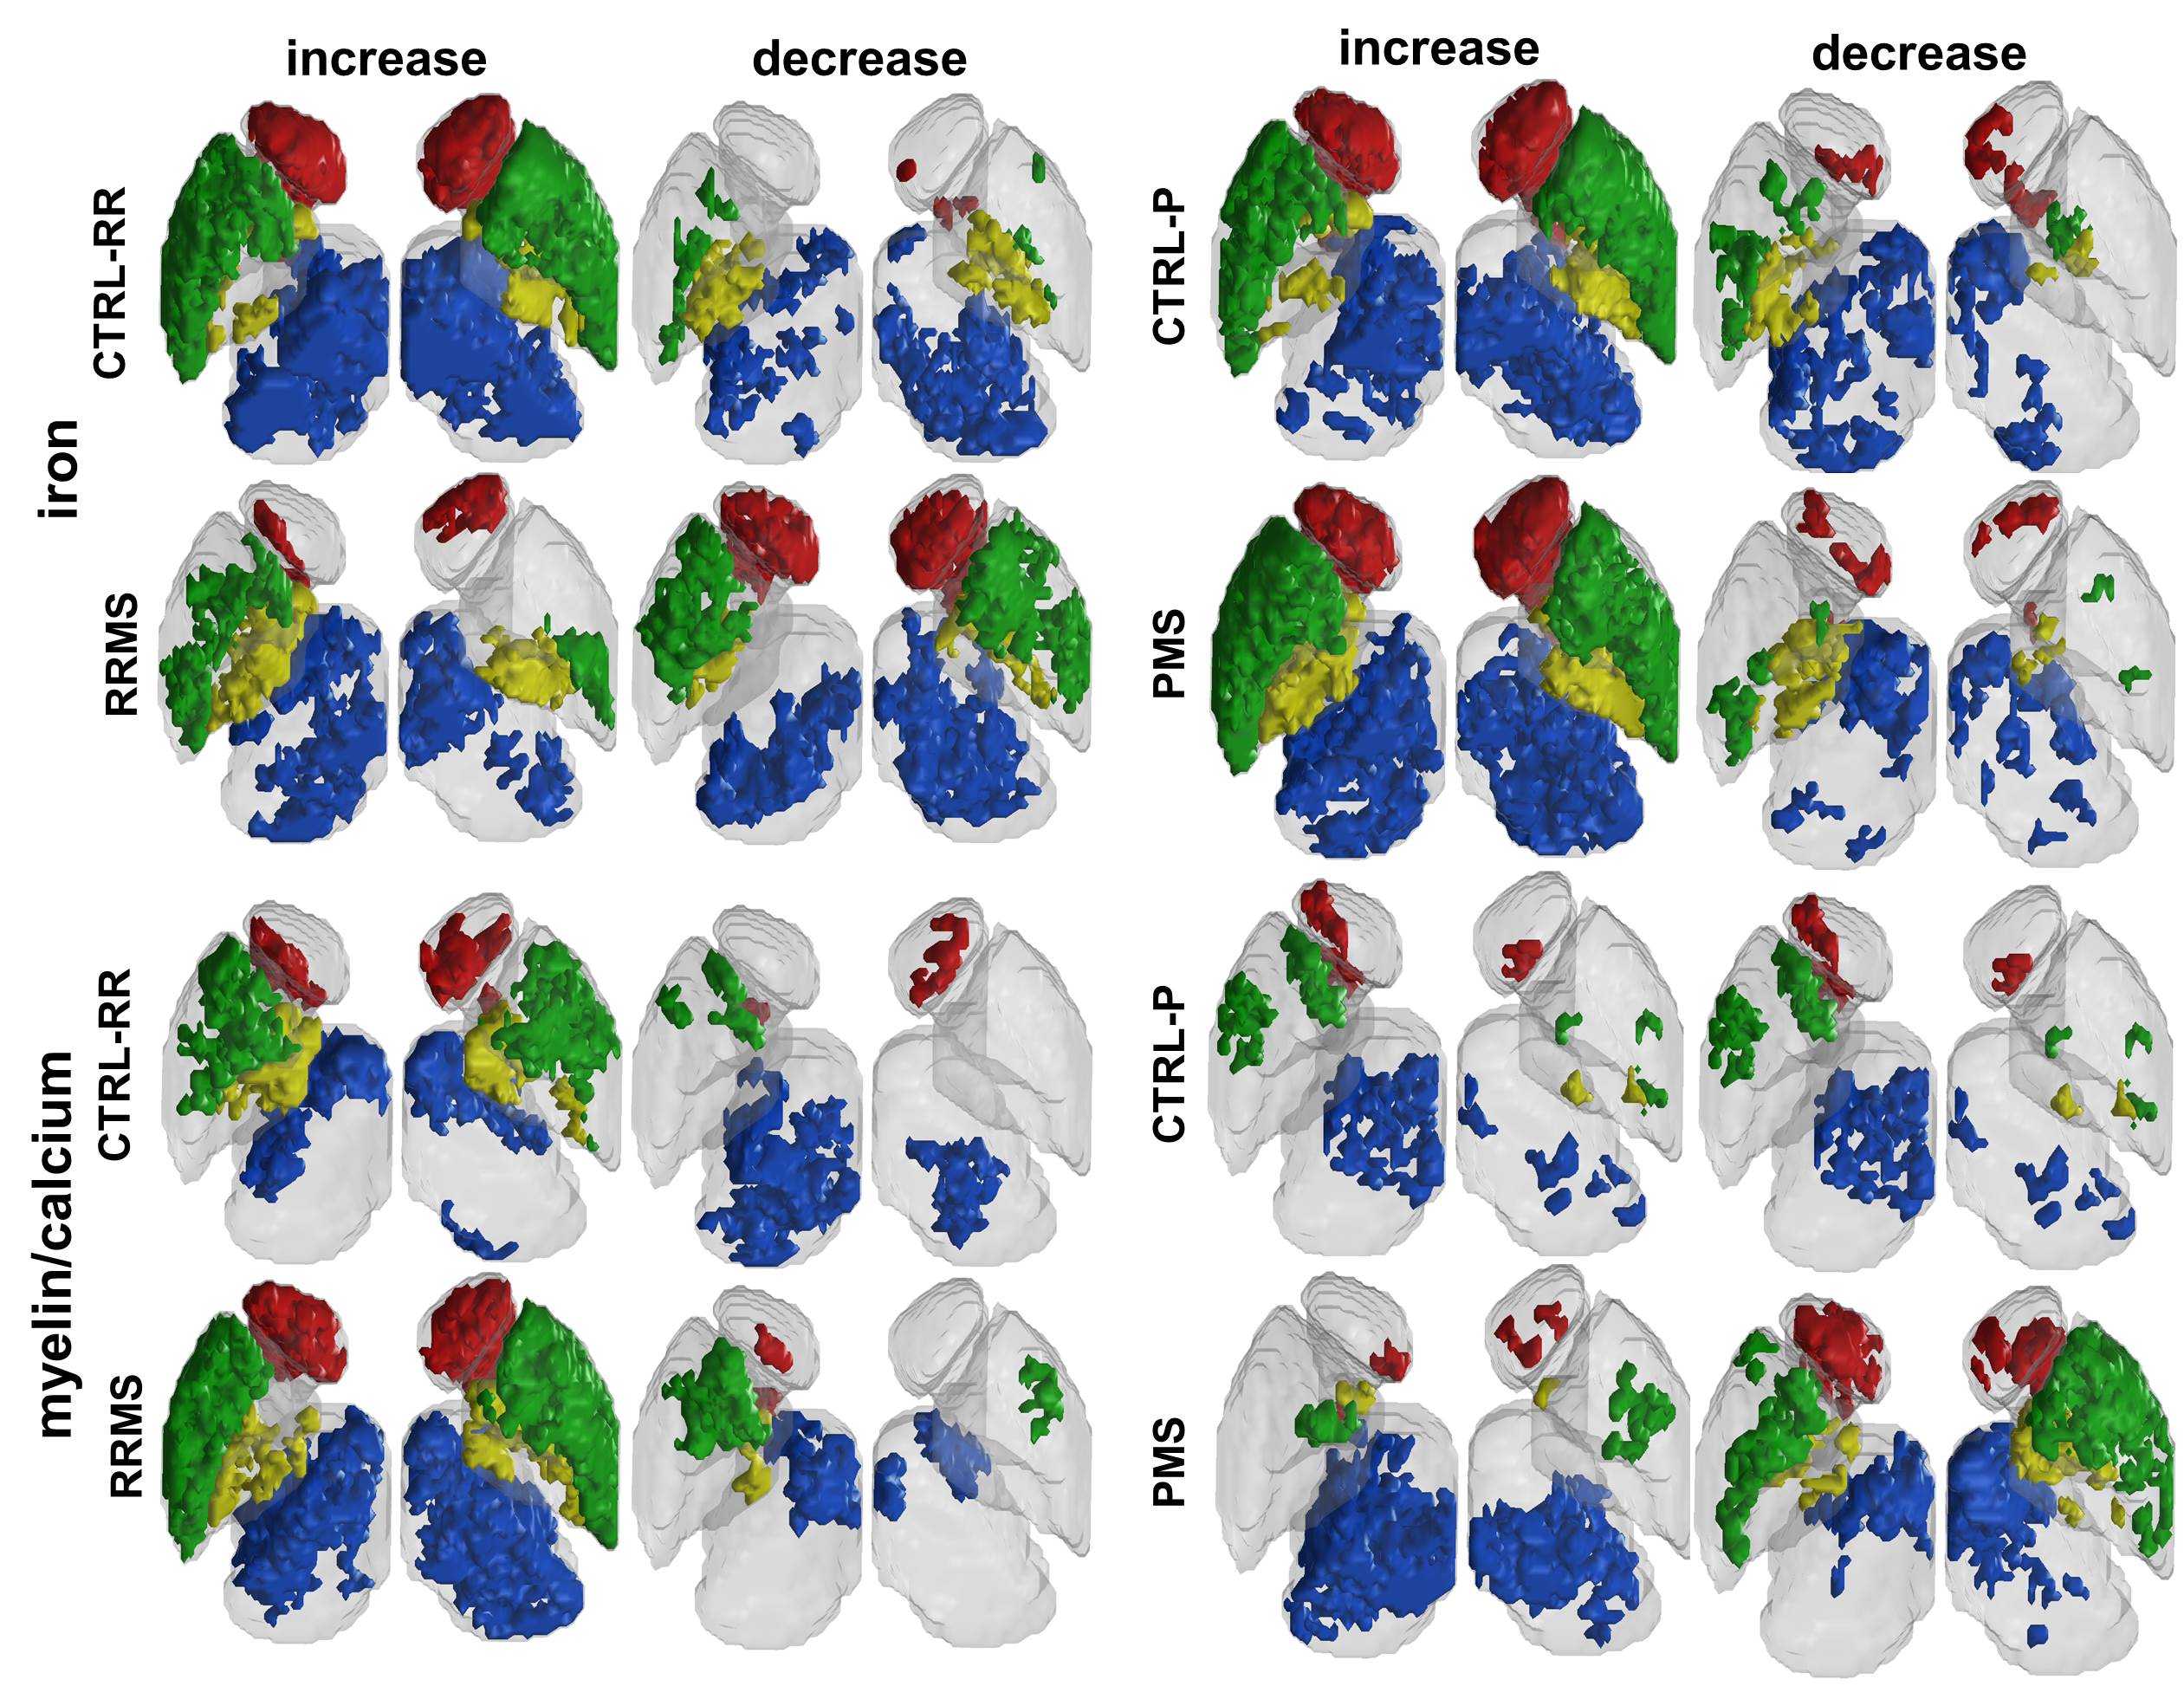
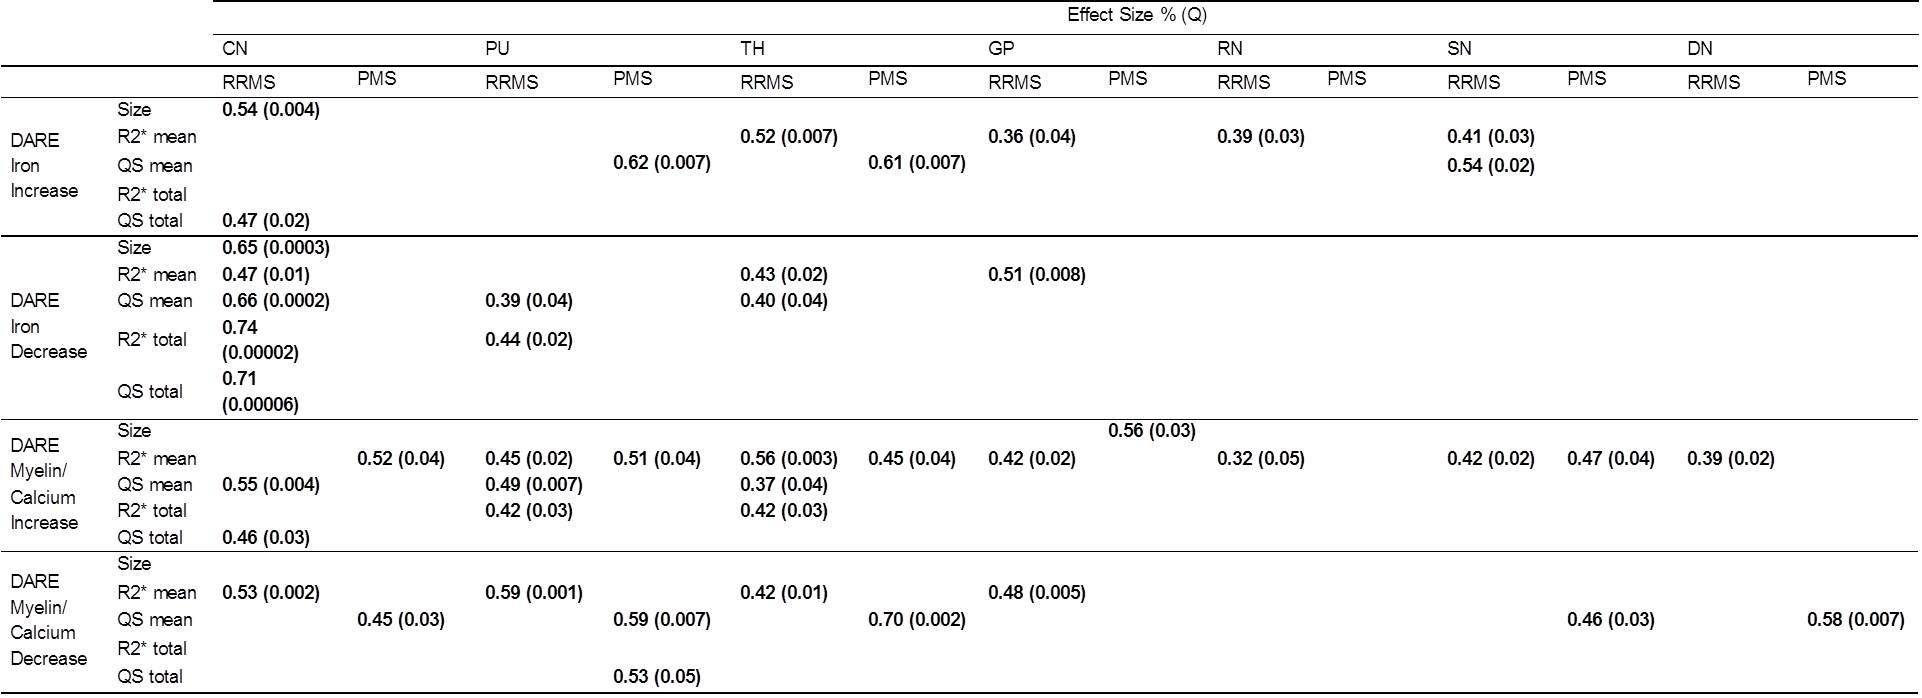
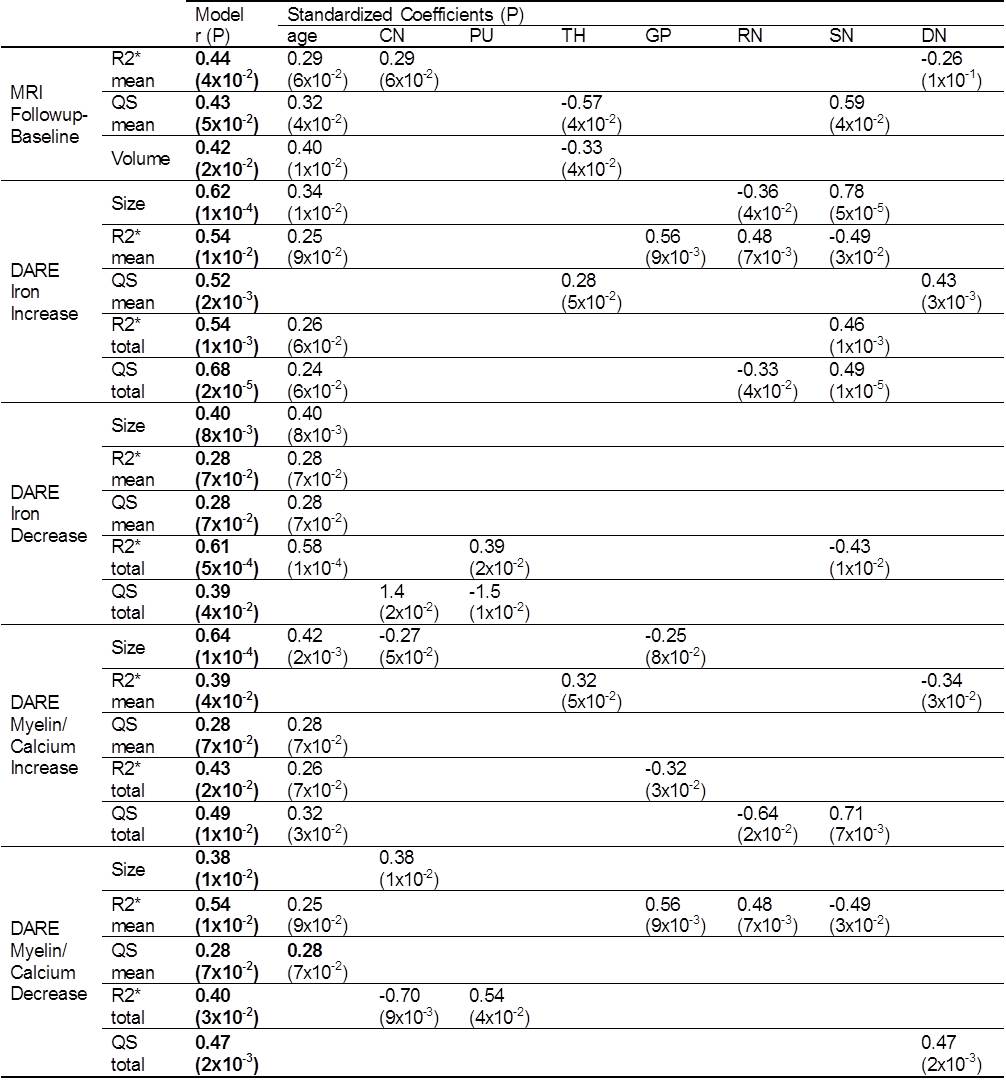
Bulk analysis only detected significant group differences of followup-baseline R2*/QS in RRMS CN QS (η=0.4; Q=0.004) and PU volume (η=0.4; Q=0.03), while it did not detect significant differences in any PMS DGM structure. DARE demonstrated significant group differences of iron and myelin/calcium increase and/or decrease over 2 years in all RRMS structures, while PMS DARE demonstrated significant group differences in all structures except the RN (Figure 2). The largest RRMS effect size was demonstrated for CN total R2* iron decrease (r=0.74; Q=0.00001), while the largest PMS effect size was TH total QS myelin/calcium decrease (r=0.70; Q=0.002) (Table 2). DARE clearly demonstrated improved correlation with MSSS compared to followup-baseline R2*, QS, and volume bulk analysis, after accounting for the effect of age. Mean QS of SN DARE regions was the strongest bulk analysis predictor (β=0.59; P=0.04), while iron increase region size of the SN was the strongest DARE predictor (β=0.78; P=0.00005) (Table 3).Discussion
DARE was compared to bulk analysis of followup-baseline R2* or QS. Using its enhanced specificity, DARE was able to identify more significantly different regions between patients and controls, compared to bulk analysis in both RRMS and PMS. Furthermore, bulk analysis only indicates the increased mean bulk intensity of R2* and QS of MS compared to controls, which has been previously interpreted as RRMS iron accumulation.9 However, both iron and myelin changes have been shown to occur in MS DGM.10 On the other hand, DARE has allowed identification of regional longitudinal changes in size, mean and total R2* intensities of iron and myelin/calcium within DGM structures. DARE results agree with a previous longitudinal MS study using QS mapping that found significant MS DGM longitudinal*group interaction only after normalizing to structure volume, 11 which is similar to the regional volume normalization step in DARE. TH DARE results indicating heterogeneous longitudinal changes also agree with a recent study that found reduced QS in TH subregions over 2 years, 12 while cross-sectional studies reported an increase in bulk TH QS. 1 Further, DARE revealed that calcium/myelin increase and decrease are the primary drivers of R2* and QS DGM longitudinal changes in PMS DARE, compared to iron decrease and calcium/myelin increase as the primary drivers in RRMS. This suggests that later progressive stages of the disease are dominated by demyelination and, to a lesser extent, remyelination, 13 while remyelination 14 and iron-associated oligodendrocyte destruction 15 dominates the earlier relapsing-remitting stages of the disease. DARE correlation results agree with previous DGM correlations of longitudinal R2* changes with MSSS, where SN was found to be the strongest MSSS predictor.16 DARE thalamic correlations also agree with a recent study correlating disease duration with susceptibility reduction in focal thalamic nuclei. 12Conclusion
DARE enabled discriminative assessment of specific iron and myelin/calcium longitudinal changes in MS over 2 years. Iron decrease and myelin/calcium increase, and myelin/calcium changes, were the primary drivers of observed MRI longitudinal changes in RRMS and PMS DGM, respectively. Specific DARE measures of MS DGM can be used to predict MSSS, and may reflect complex disease pathology.Acknowledgements
The authors acknowledge funding support from the Canadian Institutes of Health Research and the Multiple Sclerosis Society of Canada.References
1. Elkady et al (2017). J Magn Reson Imaging 46: 1464–1473.
2. Du et al (2009). J Magn Reson Imaging 30:449-454.
3. Smith (2002). Hum Brain Mapp 17:143-155.
4. Jenkinson (2003). Magn Reson Med 49:193-197.
5. Sun & Wilman (2013). Magn Reson Med 71:1151-7.
6. Bilgic et al (2012). Neuroimage 59:2625-2635.
7. Cobzas et al (2015). J Magn Reson Imaging 42:1601-10.
8. Glass. (1966). Educ Psychol Meas 26:623-631.
9. Khalil et al. (2015), Neurology 84:2396-2402.
10. Haider et al (2014), J Neurol Neurosurg Psychiatry 85:1386-1395.
11. Hagemeier et al. (2017). NeuroImage: Clinical.
12. Schweser (in press), doi.org/10.1016/j.neuroimage.2017.10.063.
13. Bramow et al. (2010), Brain 133:10:2983–2998.
14. Patrikios et al. (2006), Brain 129 12:3165–3172.
15. Barnett (2004), Ann Neurol. 55:4::458-68.
16. Walsh et al. (2014). Rad. 2014:270:186-196.
Figures