5271
Gray Matter Myelin Alterations in Early and Late Relapsing-Remitting Multiple Sclerosis Evaluated with Quantitative Synthetic Magnetic Resonance Imaging: A Gray-Matter Based Spatial Statistics Analysis1Department of Radiology, Juntendo University Graduate School of Medicine, Tokyo, Japan, 2Department of Radiology, Graduate School of Medicine, The University of Tokyo, Tokyo, Japan, 3Department of Radiology, Tokyo Metropolitan Geriatric Hospital and Institute of Gerontology, Tokyo, Japan, 4Department of Radiological Sciences, Graduate School of Human Health Sciences, Tokyo Metropolitan University, Tokyo, Japan, 5Department of Neurology, Juntendo University School of Medicine, Tokyo, Japan
Synopsis
Our study demonstrated that myelin volume fraction (MVF) and myelin volume (MyV) obtained by a multi-parametric quantitative synthetic MRI might be useful for evaluating gray matter (GM) myelin alterations and for monitoring disease progression in relapsing-remitting multiple sclerosis (RRMS) patients. GM-based spatial statistics analysis demonstrated decreased MVF in limbic, paralimbic, and deep GM areas in the early-RRMS, and in extensive areas of GM in the late-RRMS. In the meanwhile, MyV was found to be decreased in both RRMS groups compared to healthy subjects, with late-RRMS showing the lowest value, and significantly correlated with disease duration.
Purpose
Although mainly known as an inflammatory, demyelinating white matter (WM) disease, extensive gray matter (GM) involvement has also been widely demonstrated in multiple sclerosis (MS).1 Histopathology studies have shown that GM damage occurs at early stages of the diseases, and evolve faster than WM pathology.1 However, conventional magnetic resonance imaging (MRI) methods have limitations when it comes to visualization of GM pathology.2 A recently developed, quantitative MRI (qMRI) method with QRAPMASTER (quantification of relaxation times and proton density by multiecho acquisition of a saturation-recovery using turbo spin-echo readout) pulse sequence, or well known as quantitative synthetic MRI, enables simultaneous quantification of R1 and R2 relaxation rates, and proton density (PD) within only 6 minutes.3 Based on the quantitative values and by using the post-processing software it is possible to evaluate the myelin volume fraction (MVF) of a voxel and whole brain myelin volume (MyV).3 So far, this method has shown a good repeatability4 and a good correlation with histopathology5 and other myelin imaging techniques.6 It has also revealed WM damage in MS.7, 8 In this study, we aimed to identify GM myelin alterations in early and late relapsing-remitting MS (RRMS) patients by analyzing quantitative synthetic MRI data using GM-based spatial statistics (GBSS).Methods
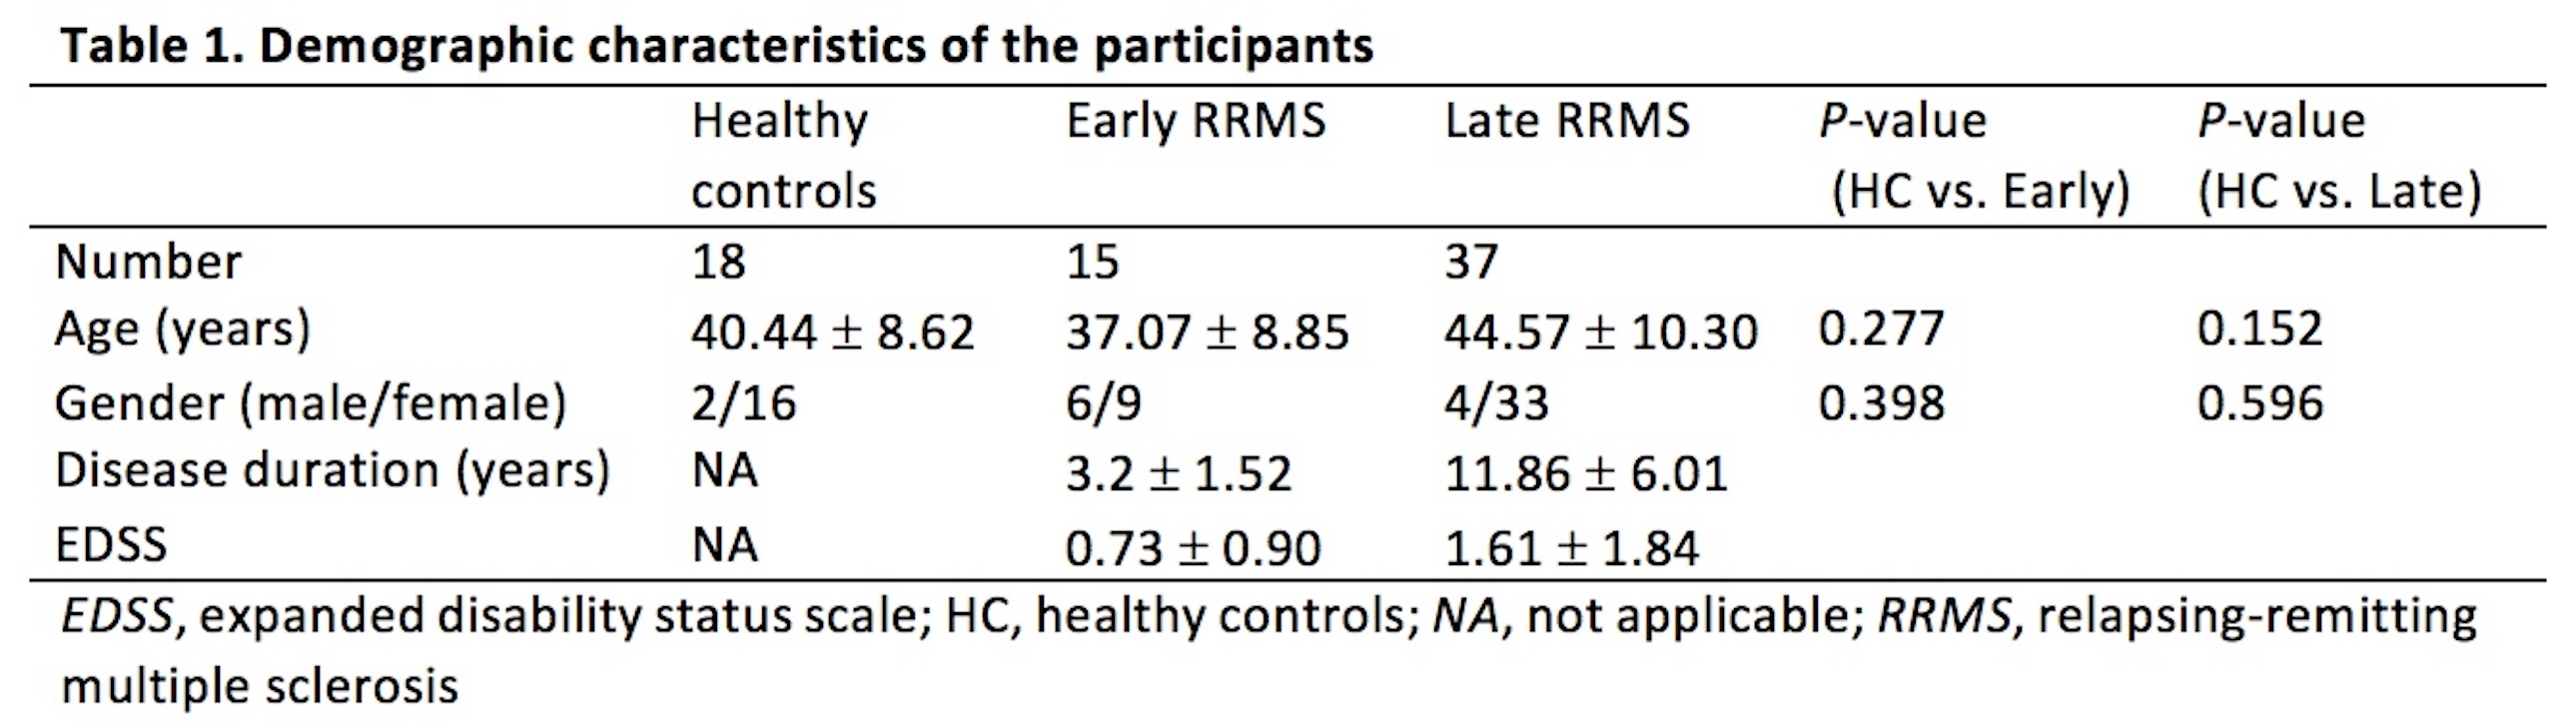
This study included 52 RRMS patients and 18 healthy controls (HC). We categorized the patients to early and late stage, ≤5 years and > 5 years from first clinical onset, respectively (Table 1).9 All participants underwent 2D axial qMRI and conventional 3D T1WI on a 3.0-T MR scanner with a 19-channel head coil. qMRI was performed with the QRAPMASTER pulse sequence, which is a multi-slice, multi-echo and multi-saturation delay acquisition. Combination of 2 TEs (16.9 and 84.5 ms) and 4 delay times (146, 546, 1879, and 3879 ms) was used to generate 8 complex images that were then used to quantify R1, R2, and PD. MVF map was acquired within 1 minute on SyMRI software 8.0 (SyntheticMR, Linköping, Sweden). Then, GBSS was used to compare MVF between groups (HC and early RRMS, and HC and late RRMS) and to perform correlation analysis between MVF and clinical scores (disease duration and expanded disability status scale [EDSS]). A family-wise error corrected P-value of < 0.05 was considered significant for GBSS. Although SyMRI software provides automatic MyV calculation, the interest of this study was in GM. Therefore, we obtained MyV of GM by using FMRIB software library. Mann-Whitney test was used to compare GM-MyV between HC and early RRMS and between HC and late RRMS. Finally, linear regression analysis was used to compare GM-MyV with disease duration or EDSS in RRMS group with age as the covariate. A 2-sided P value .05 was considered significant.
Results
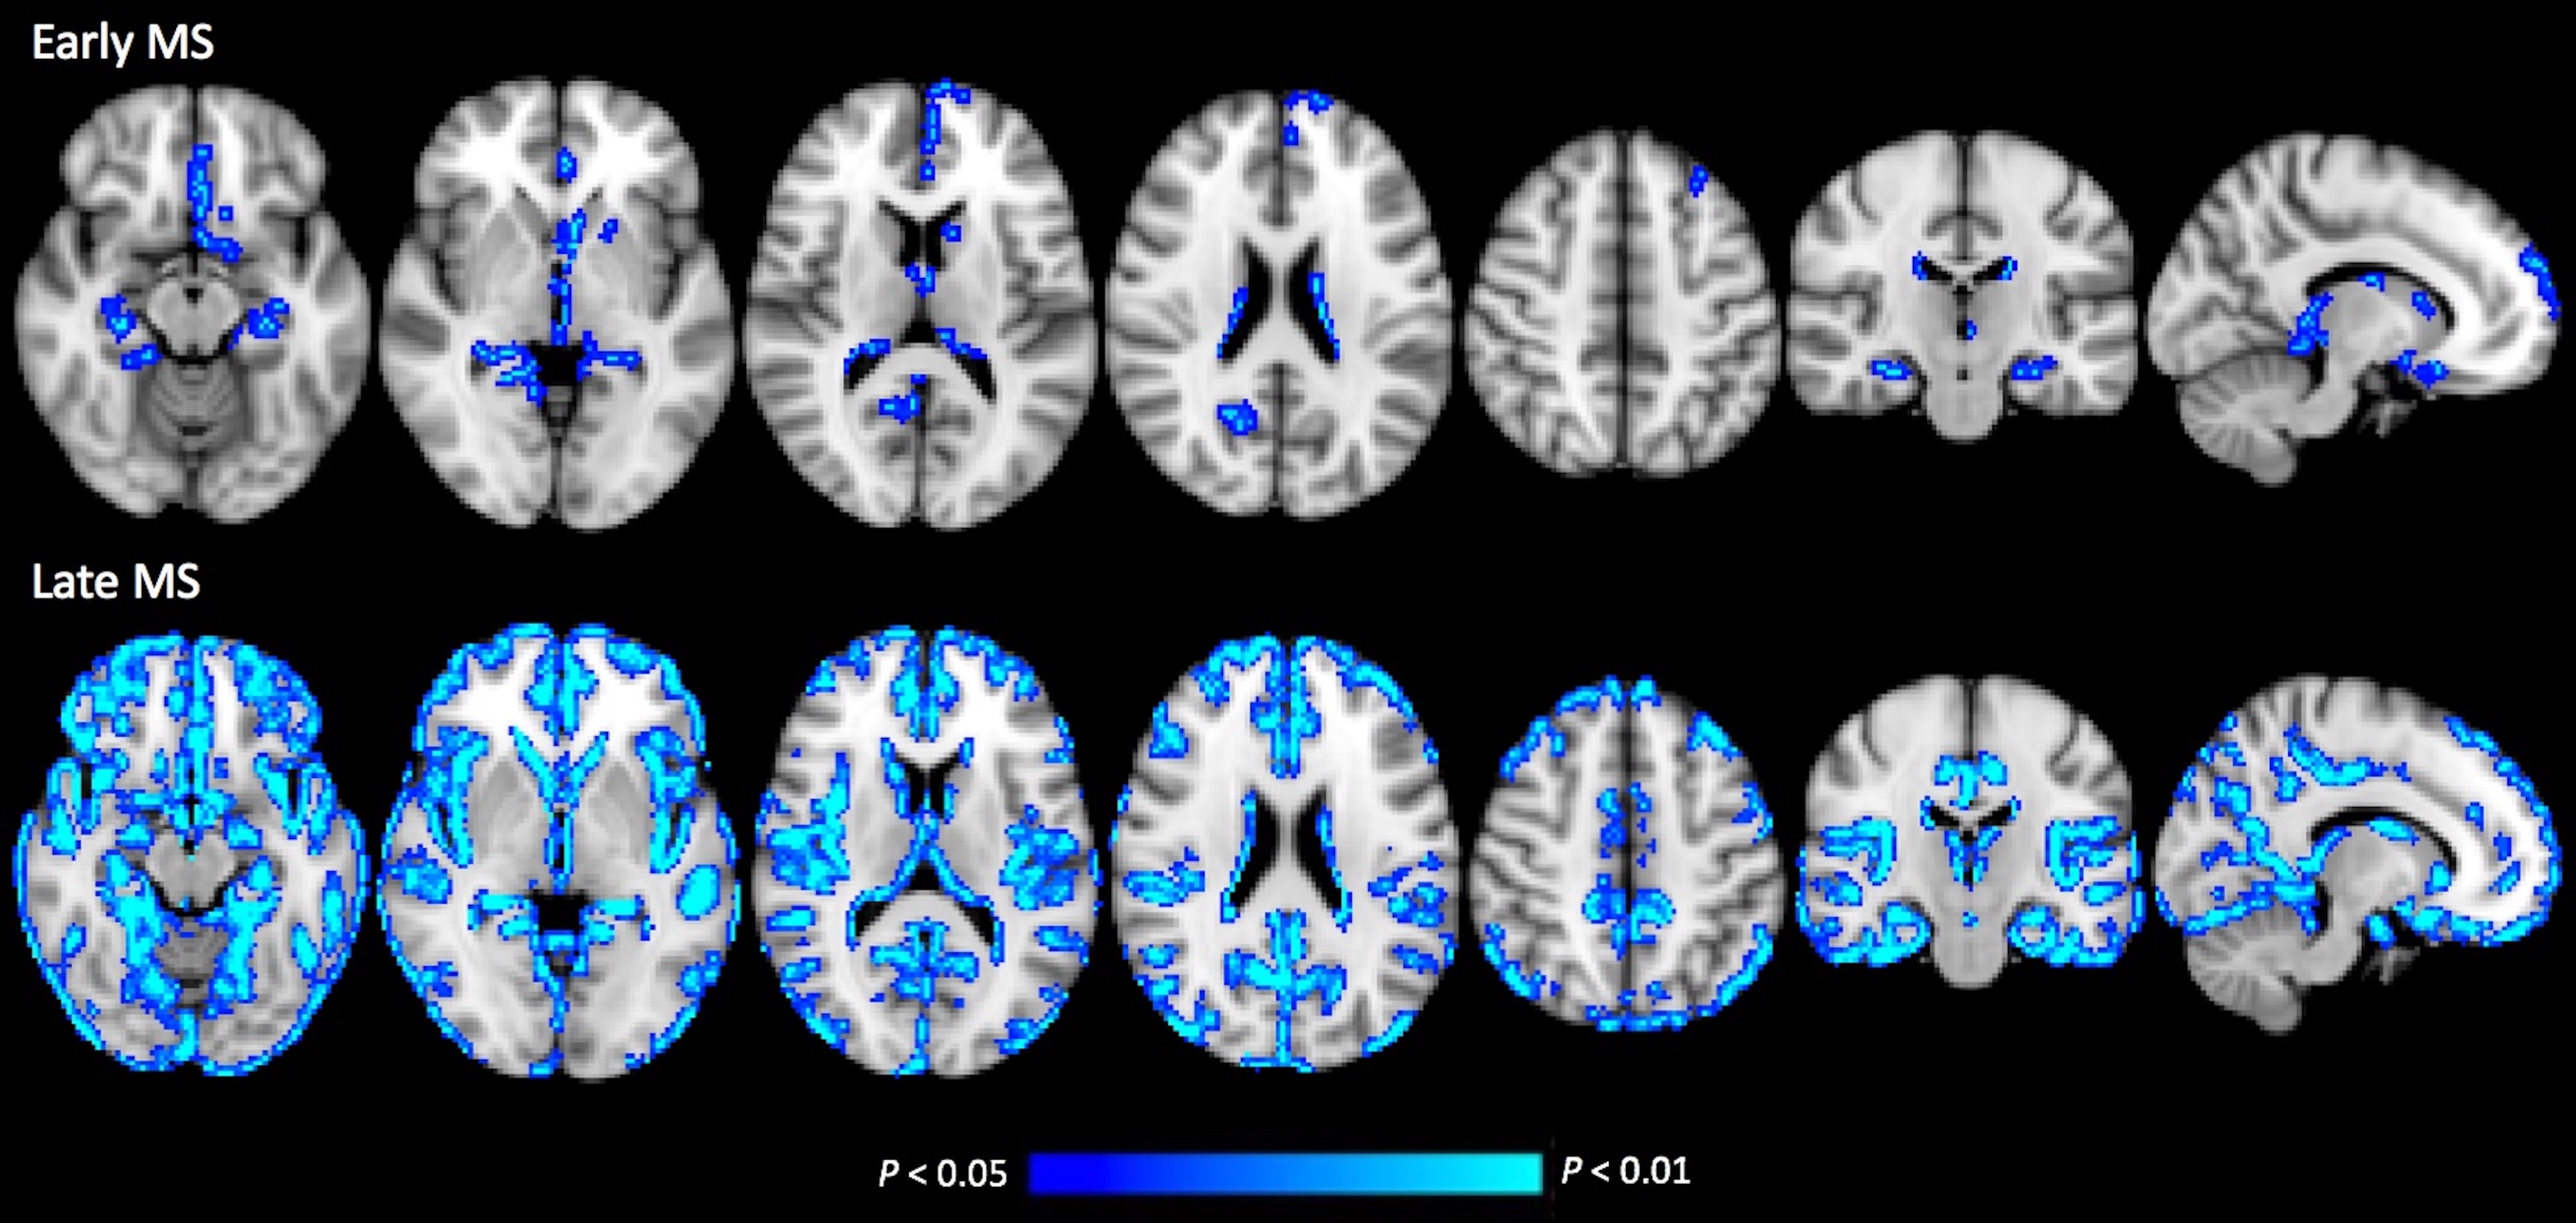
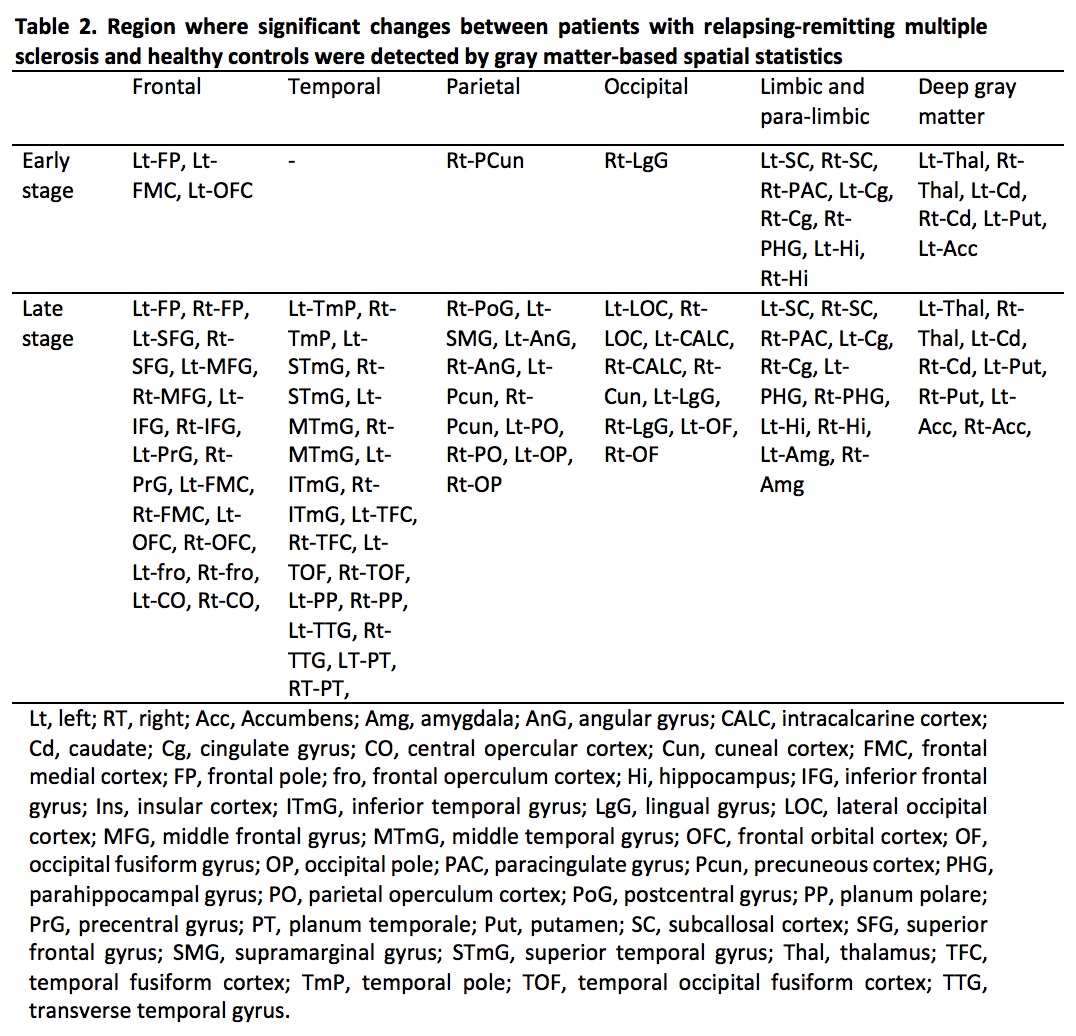
In the GBSS analysis, early and late RRMS groups showed significantly reduced MVF when compared to healthy controls (Fig. 1, Table 2). Early MS group showed reduced MVF predominantly in the limbic and paralimbic areas, and deep GM. Meanwhile, in the late RRMS group, reduced MVF was seen in an extensive area of GM. No correlations have been detected between the MVF and disease duration or EDSS. The GM-MyV of HC, early-RRMS, and late-RRMS groups were 23.36 mL, 22.77 mL, 20.44 mL, respectively. Significantly decreased (P = 0.03) GM-MyV was found in late-RRMS compared to HC groups. The GM-MyV in RRMS group was significantly correlated (R = 0.380, P = 0.026) with disease duration.Discussion
Our study shows that decreased MVF, which reflects demyelination, is evidenced in limbic and paralimbic areas, and deep GM, in the early-RRMS. This finding corresponds to the results of previous imaging and histopathology studies showing that GM atrophy and demyelination is more frequently seen in the limbic system, and the deep GM structures in the early stage of MS.1, 10, 11 Wallerian degeneration along specific white matter pathways that traverse the limbic and deep GM areas has been proposed as one of the causes of this observed pattern.12 Meanwhile, in the late RRMS group, decreased MVF was found in an extensive area of GM, showing that GM damage in RRMS progresses to the other area over time.13 Accordingly, decreased GM-MyV was also found in RRMS patients compared to controls, with late-RRMS showing the lowest value.Conclusion
This present study demonstrated that MVF and MyV obtained by synthetic MRI might be useful to show GM demyelination and for monitoring disease progression in RRMS. In the early stage, GM demyelination prominently appeared in the limbic system and deep GM and progressed over time, involving an extensive area of GM in the late stage.Acknowledgements
All authors have no conflict of interest to disclose.References
- Calabrese M, Favaretto A, Martini V, et al. Grey matter lesions in MS: from histology to clinical implications. Prion 2013;7:20-7
- Jacobsen CO, Farbu E. MRI evaluation of grey matter atrophy and disease course in multiple sclerosis: an overview of current knowledge. Acta Neurol Scand Suppl 2014:32-6
- Hagiwara A, Warntjes M, Hori M, et al. SyMRI of the Brain: Rapid Quantification of Relaxation Rates and Proton Density, With Synthetic MRI, Automatic Brain Segmentation, and Myelin Measurement. Invest Radiol 2017
- Andica C, Hagiwara A, Hori M, et al. Automated Brain Tissue and Myelin Volumetry Based on Quantitative MR Imaging with Various In-plane Resolutions. Journal of Neuroradiology (In press) 2017
- Warntjes JBM, Persson A, Berge J, et al. Myelin Detection Using Rapid Quantitative MR Imaging Correlated to Macroscopically Registered Luxol Fast Blue-Stained Brain Specimens. AJNR Am J Neuroradiol 2017
- Hagiwara A, Hori M, Warntjes M, et al. Comparison study of three rapid myelin measurement techniques: SyMRI (simultaneous tissue relaxometry), magnetization transfer saturation index, and T1w/T2w ratio. In submission 2017
- Hagiwara A, Hori M, Yokoyama K, et al. Analysis of White Matter Damage in Patients with Multiple Sclerosis via a Novel In Vivo MR Method for Measuring Myelin, Axons, and G-Ratio. AJNR Am J Neuroradiol 2017
- Hagiwara A, Hori M, Yokoyama K, et al. Utility of a Multiparametric Quantitative MRI Model That Assesses Myelin and Edema for Evaluating Plaques, Periplaque White Matter, and Normal-Appearing White Matter in Patients with Multiple Sclerosis: A Feasibility Study. AJNR Am J Neuroradiol 2017;38:237-42
- Chard D, Miller D. Grey matter pathology in clinically early multiple sclerosis: evidence from magnetic resonance imaging. J Neurol Sci 2009;282:5-11
- Audoin B, Zaaraoui W, Reuter F, et al. Atrophy mainly affects the limbic system and the deep grey matter at the first stage of multiple sclerosis. J Neurol Neurosurg Psychiatry 2010;81:690-5
- Crespy L, Zaaraoui W, Lemaire M, et al. Prevalence of grey matter pathology in early multiple sclerosis assessed by magnetization transfer ratio imaging. PLoS One 2011;6:e24969
- Calabrese M, Magliozzi R, Ciccarelli O, et al. Exploring the origins of grey matter damage in multiple sclerosis. Nat Rev Neurosci 2015;16:147-58
- Honce JM. Gray Matter Pathology in MS: Neuroimaging and Clinical Correlations. Mult Scler Int 2013;2013:627870
Figures