5268
Early Apparent Diffusion Coefficient Deficit Correlates to Final Outcome in Experimental Neonatal Hypoxic Ischemia1Research Center of Translational Image, Teipei Medical University, Taipei, Taiwan, 2Department of Radiology, School of Medicine, College of Medicine, Taipei Medical University, Taipei, Taiwan, 3Department of Anatomy and Cell Biology, School of Medicine, College of Medicine, Taipei Medical University, Taipei, Taiwan, 4Department of Pediatrics, School of Medicine, College of Medicine, Taipei Medical University, Taipei, Taiwan, 5Department of Pediatrics, College of Medicine, National Cheng Kung University, Tainan, Taiwan
Synopsis
Changes in apparent diffusion coefficient (ADC) at 2 h after hypoxic ischemia (HI) in neonatal rats showed the significant correlation to the final lesion severity. The early ADC deficit appeared within 6 h after HI injury may serve as an index for outcome prediction and the translational evidence to stratify neonates for hypothermia treatment.
Introduction
Neonatal hypoxic ischemia (HI) encephalopathy is the major cause of brain injury in newborns.1 While total-body hypothermia within 6 h of age is the only clinical practice for all the newborns with moderate to severe HI encephalopathy1, 2, up to 40 % of treated neonates still suffered neurological disorder later due to the induction of hypothermia injury.3 Thus, an early biomarker indicating the severity of HI before hypothermia practice is emerging to stratify the neonates for the treatment. While the dynamic tissue fate depicted using MRI during acute ischemia in adult animal brains has been well-documented, the evolution of brain deficit from the early to late stages after HI in neonatal animals was not well explored yet. In addition, the dynamics in the developing brains accentuated the disease progression of HI, which also complicated the interpretation of the neuroimage. By using the Rice-Vannucci model with different severity of HI4 and the examination aided by the experienced neuro-pediatricians, we demonstrated that the early changes in apparent diffusion coefficient (ADC) within 6 h after HI insult were highly correlated to the final neurodevelopmental outcomes.Methods
Fourteen Sprague-Dawley rat pups on postnatal day 10 (P 10) were anesthetized with 1-2% isoflurane, following by permanent ligation of the right common carotid artery with 5-0 surgical silk to induce HI injury with Rice-Vannucci model. After surgery, the pups returned to their dams for 1-hour recovery before 2.5 hours of hypoxia. During hypoxia, the pups were placed in air-tight 500-ml containers with 37°C humidified 8% oxygen (balance, nitrogen). Animal MR Imaging data were acquired at 2 h after hypoxia on a Brucker 7T PharmaScan scanner. Animals were anesthetized under 0.75 % isoflurane, and the stereotaxic headpiece and holder consisting of ear and tooth bars will be used to immobilize the head. Diffusion data were acquired with the same geometry using the four-shot spin-echo EPI with TR/TE = 3000/30 ms, δ/Δ = 4/12 ms, number of b0 = 1, number of directions = 30, b-value = 1000 s/mm2 and number of averages = 4. Rats were sacrificed after the acquisition of T2-weighted images at 7 days after HI insult. The gross neuropathological examination was performed to categorize the brain injury based on the atrophy with cystic cavitation in the ipsi-lesional hemisphere.5 Image data were processed similarly as described previously.6,7 The ADC-deficit area was identified as regions showing ADC < 70% of the contralateral homologous brain. The ratio of acute deficit was defined as the ADC-deficit volumes divided by the volume of the ipsi-lesional hemisphere in the acute phase. The reduction rate in the acute and final stage was defined as the volume of the ipsi-lesional hemisphere divided by that of the contra-lesional hemisphere at 2 h and 7 days post HI injury, respectively. Parametric correlation tests were performed to detect significant correlations between ADC changes in the acute phase and the final hemispheric reduction. Significant level was set at P<0.05. Error bars were STD.Results & Discussion
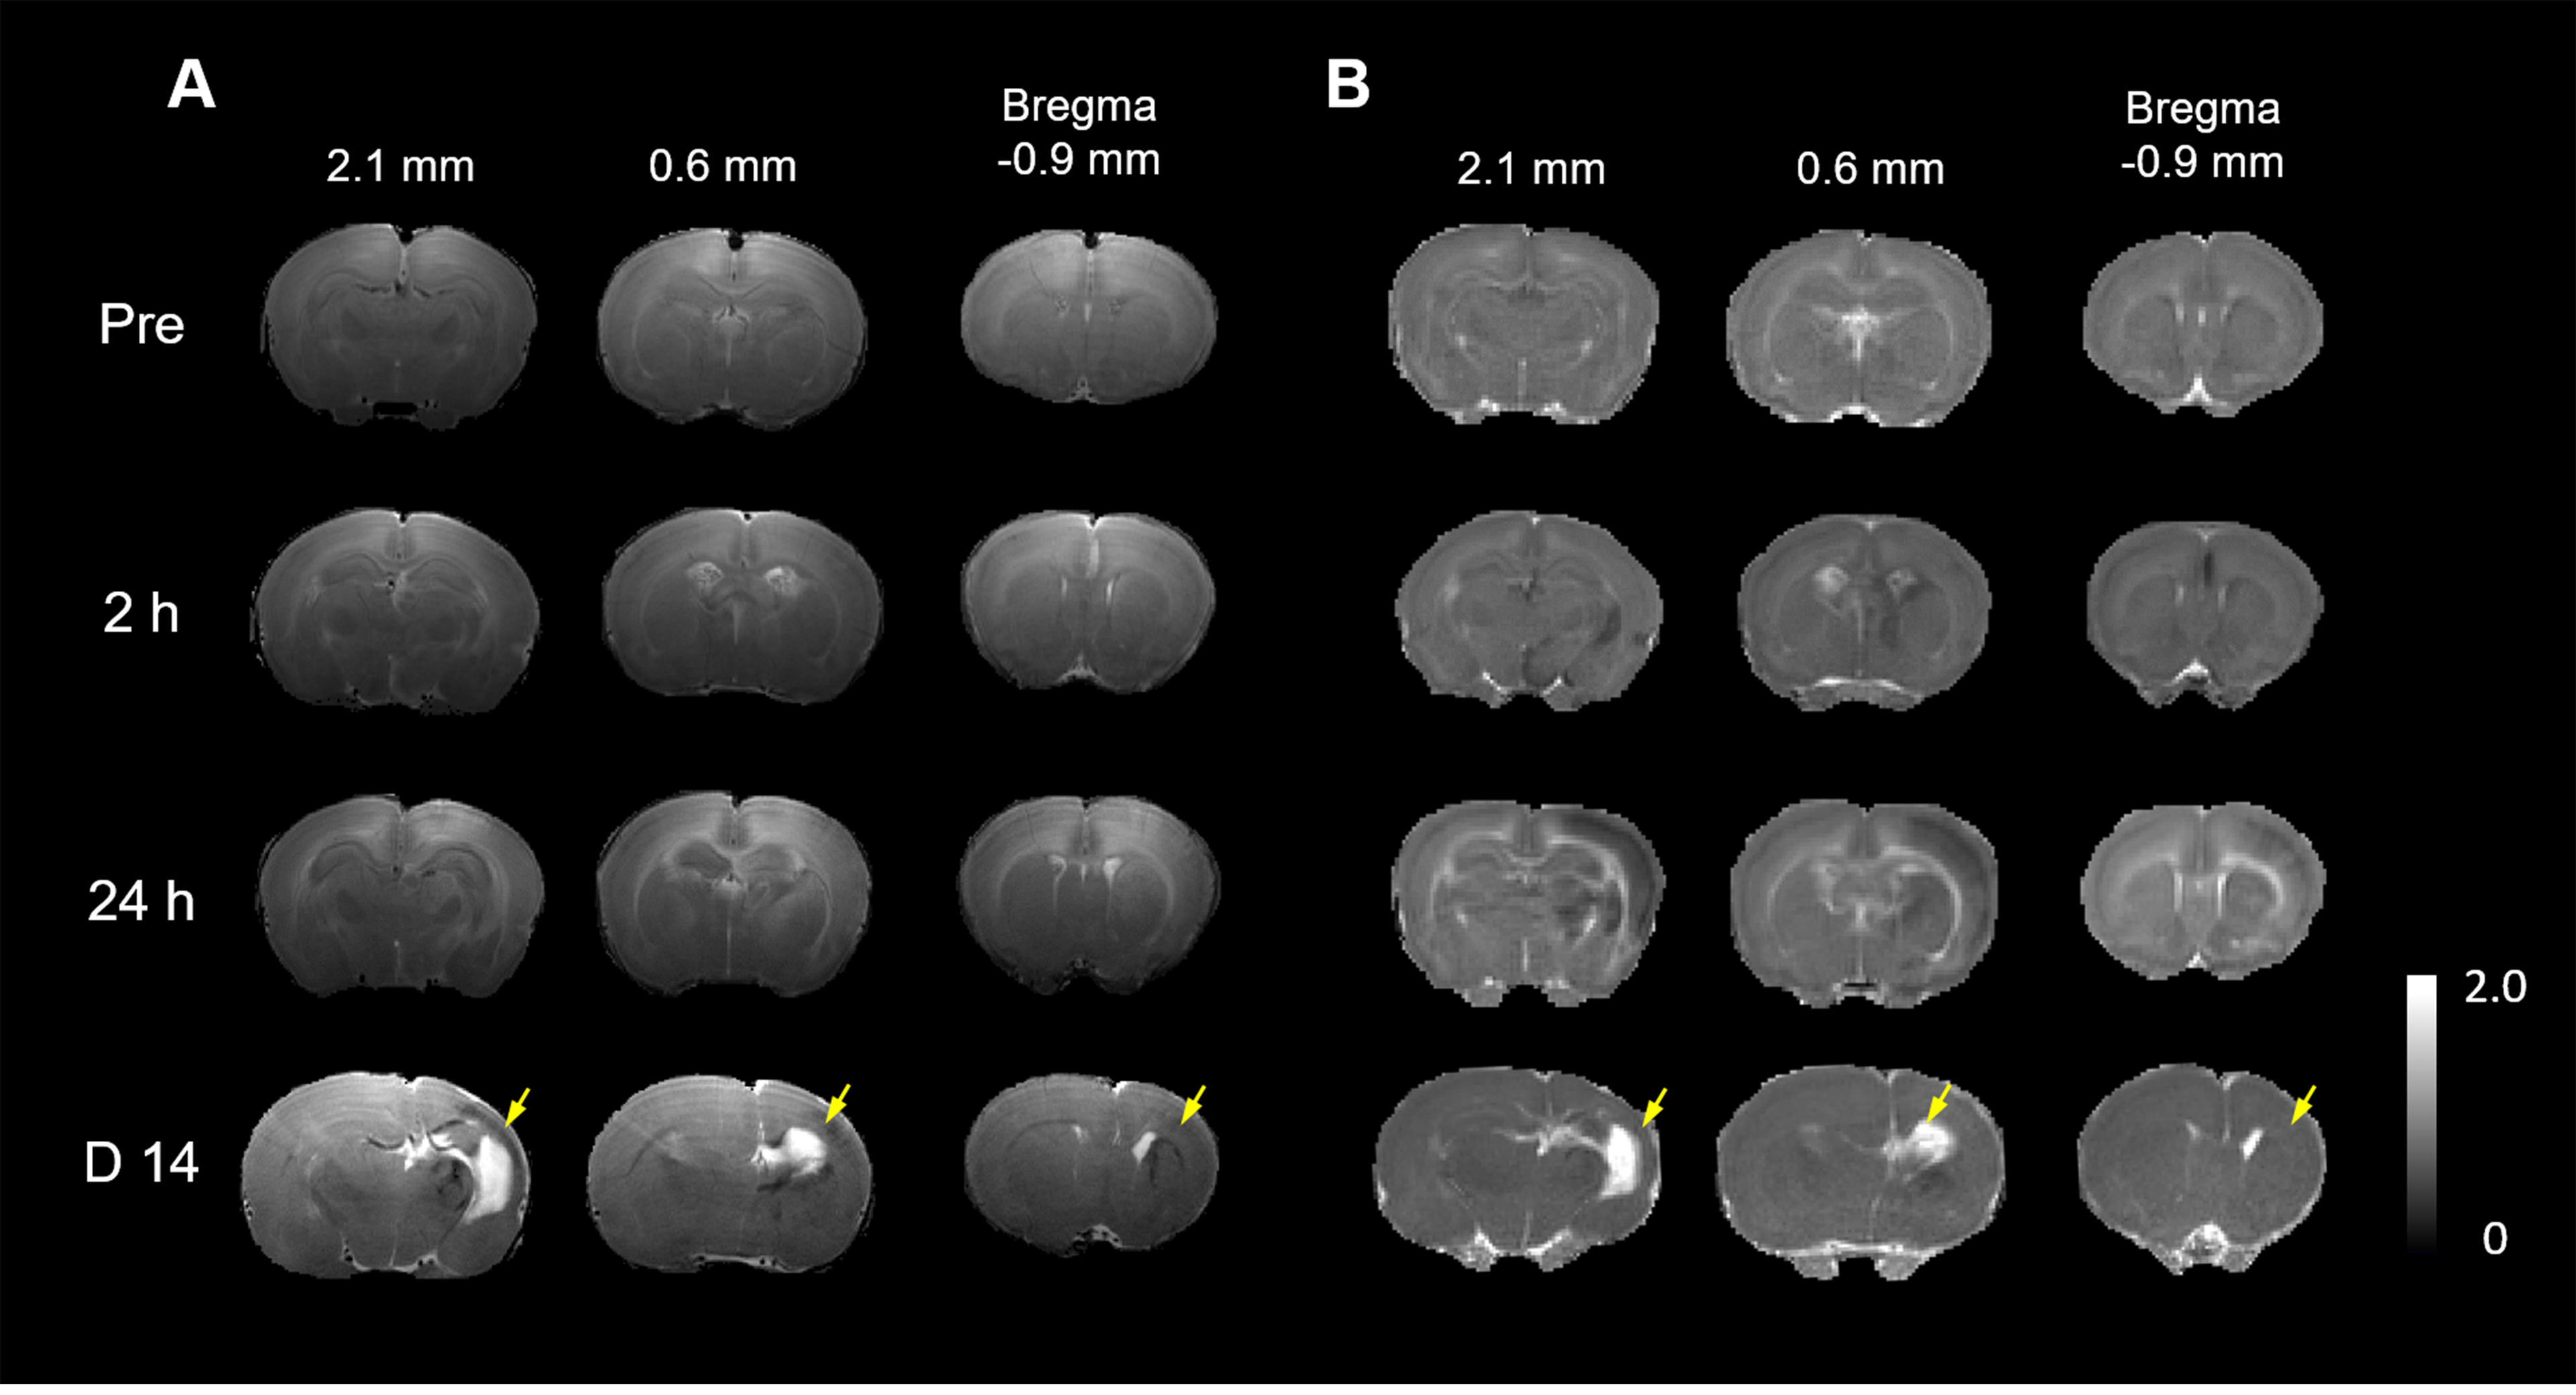
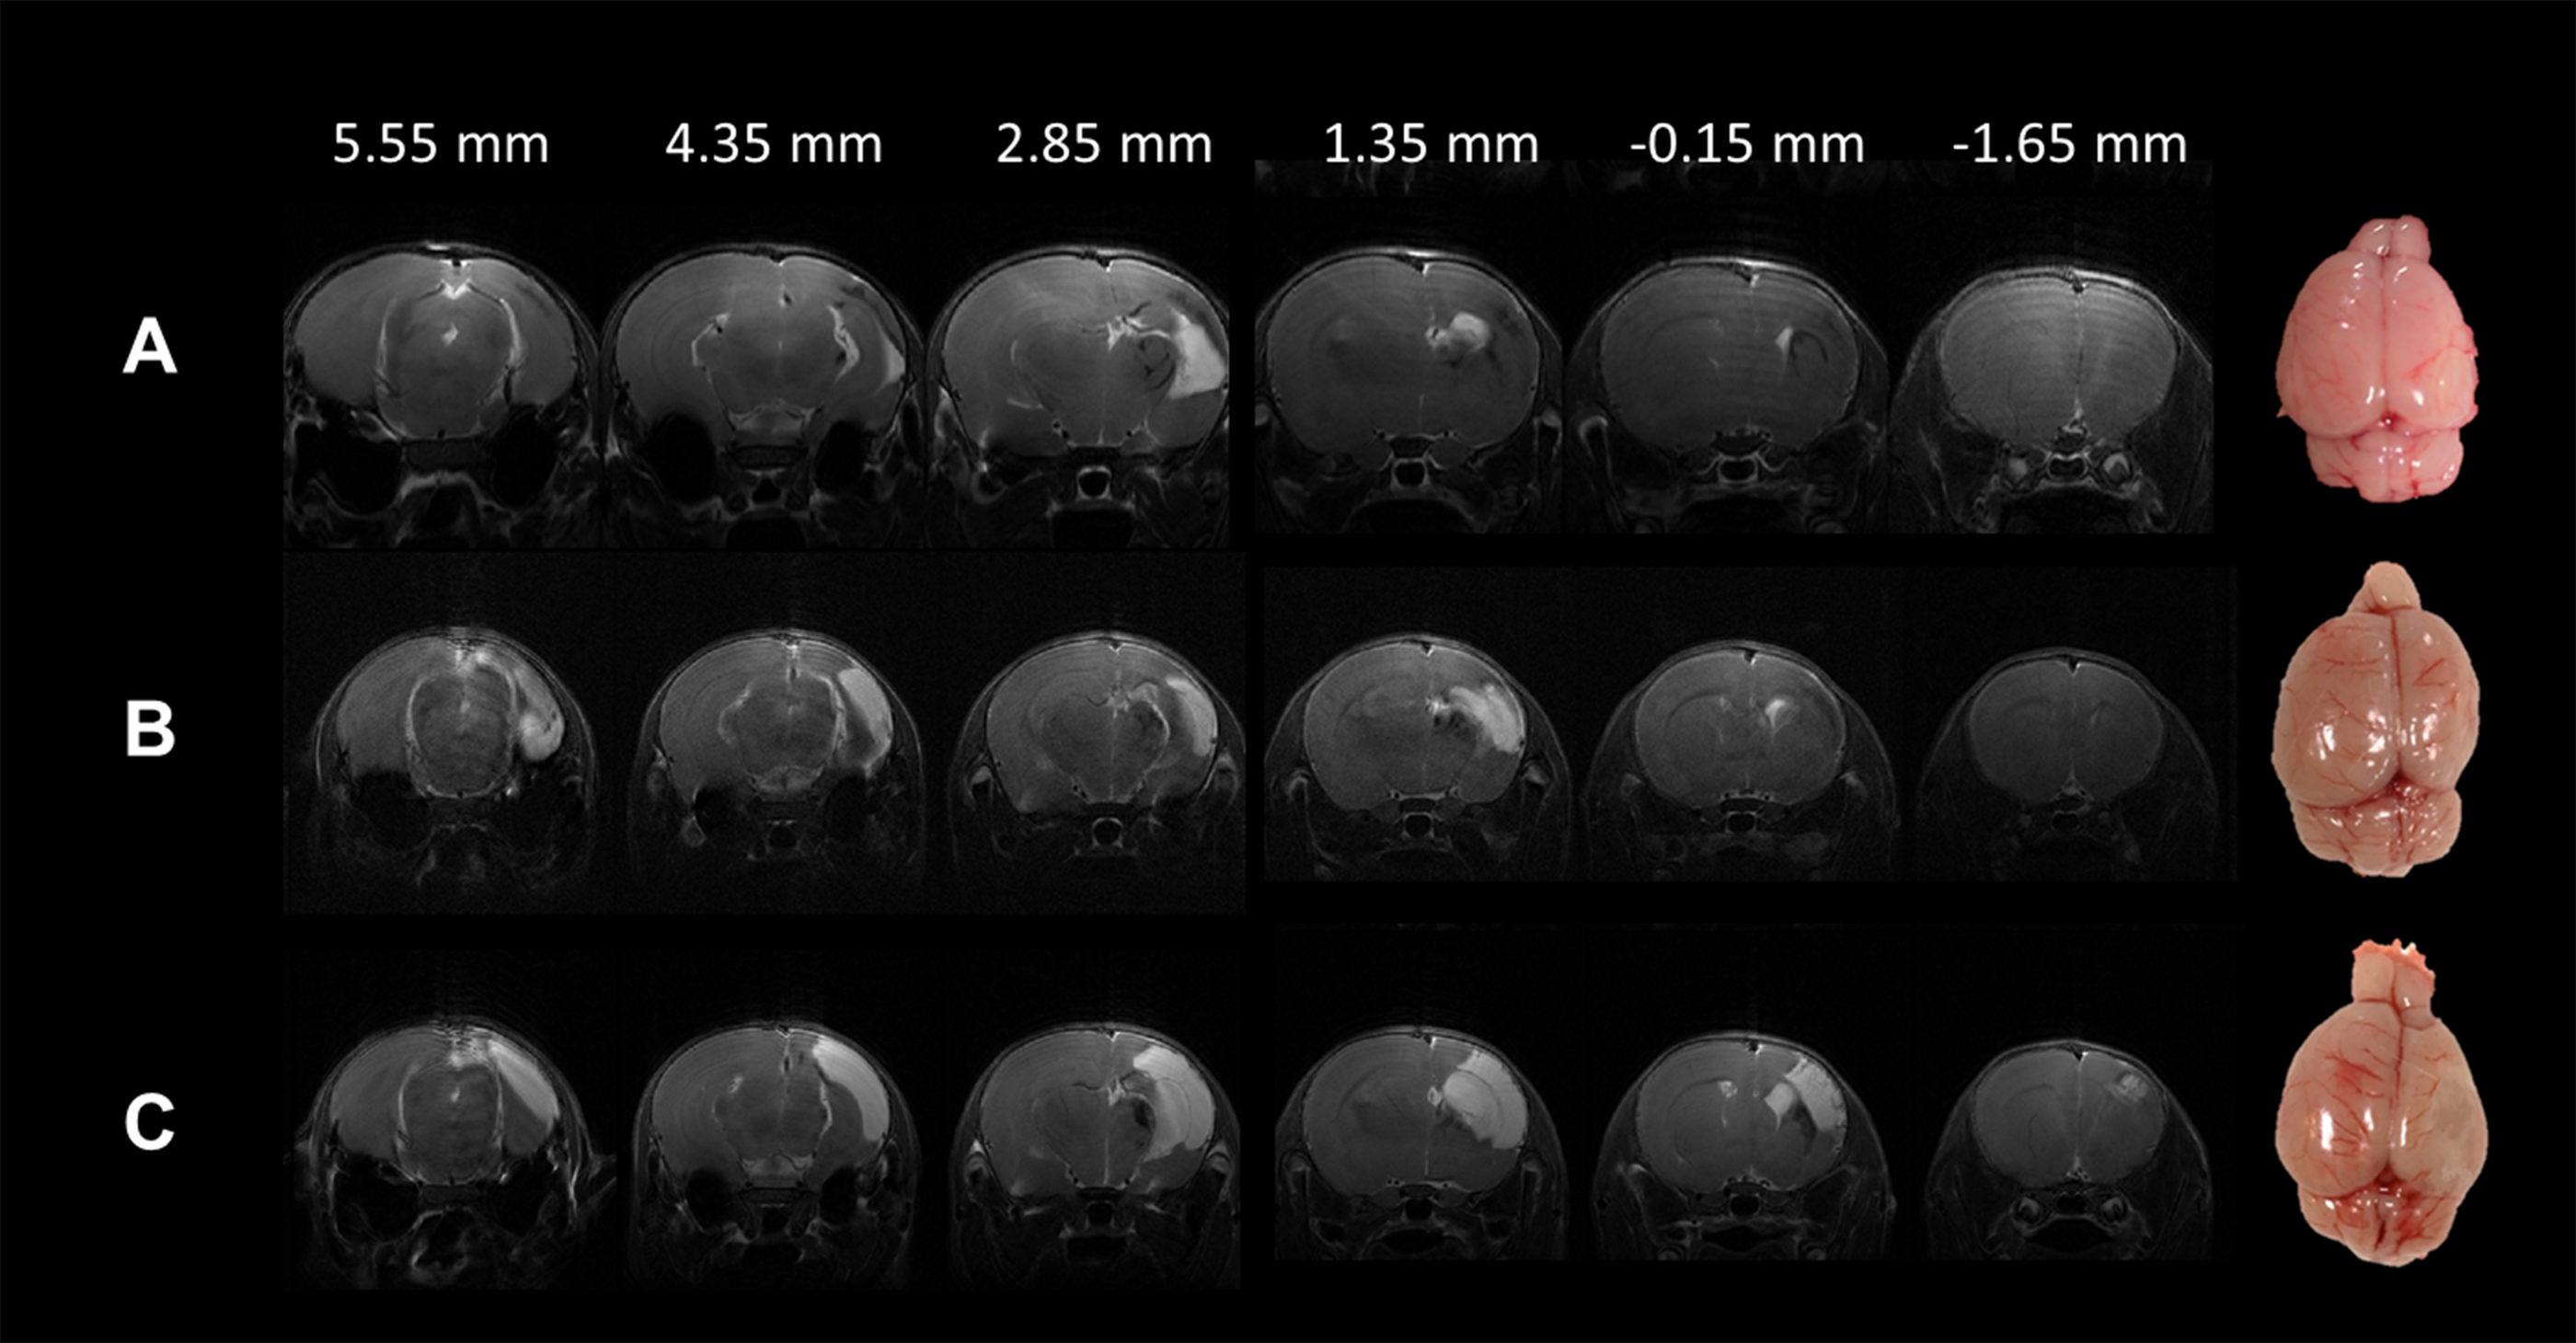
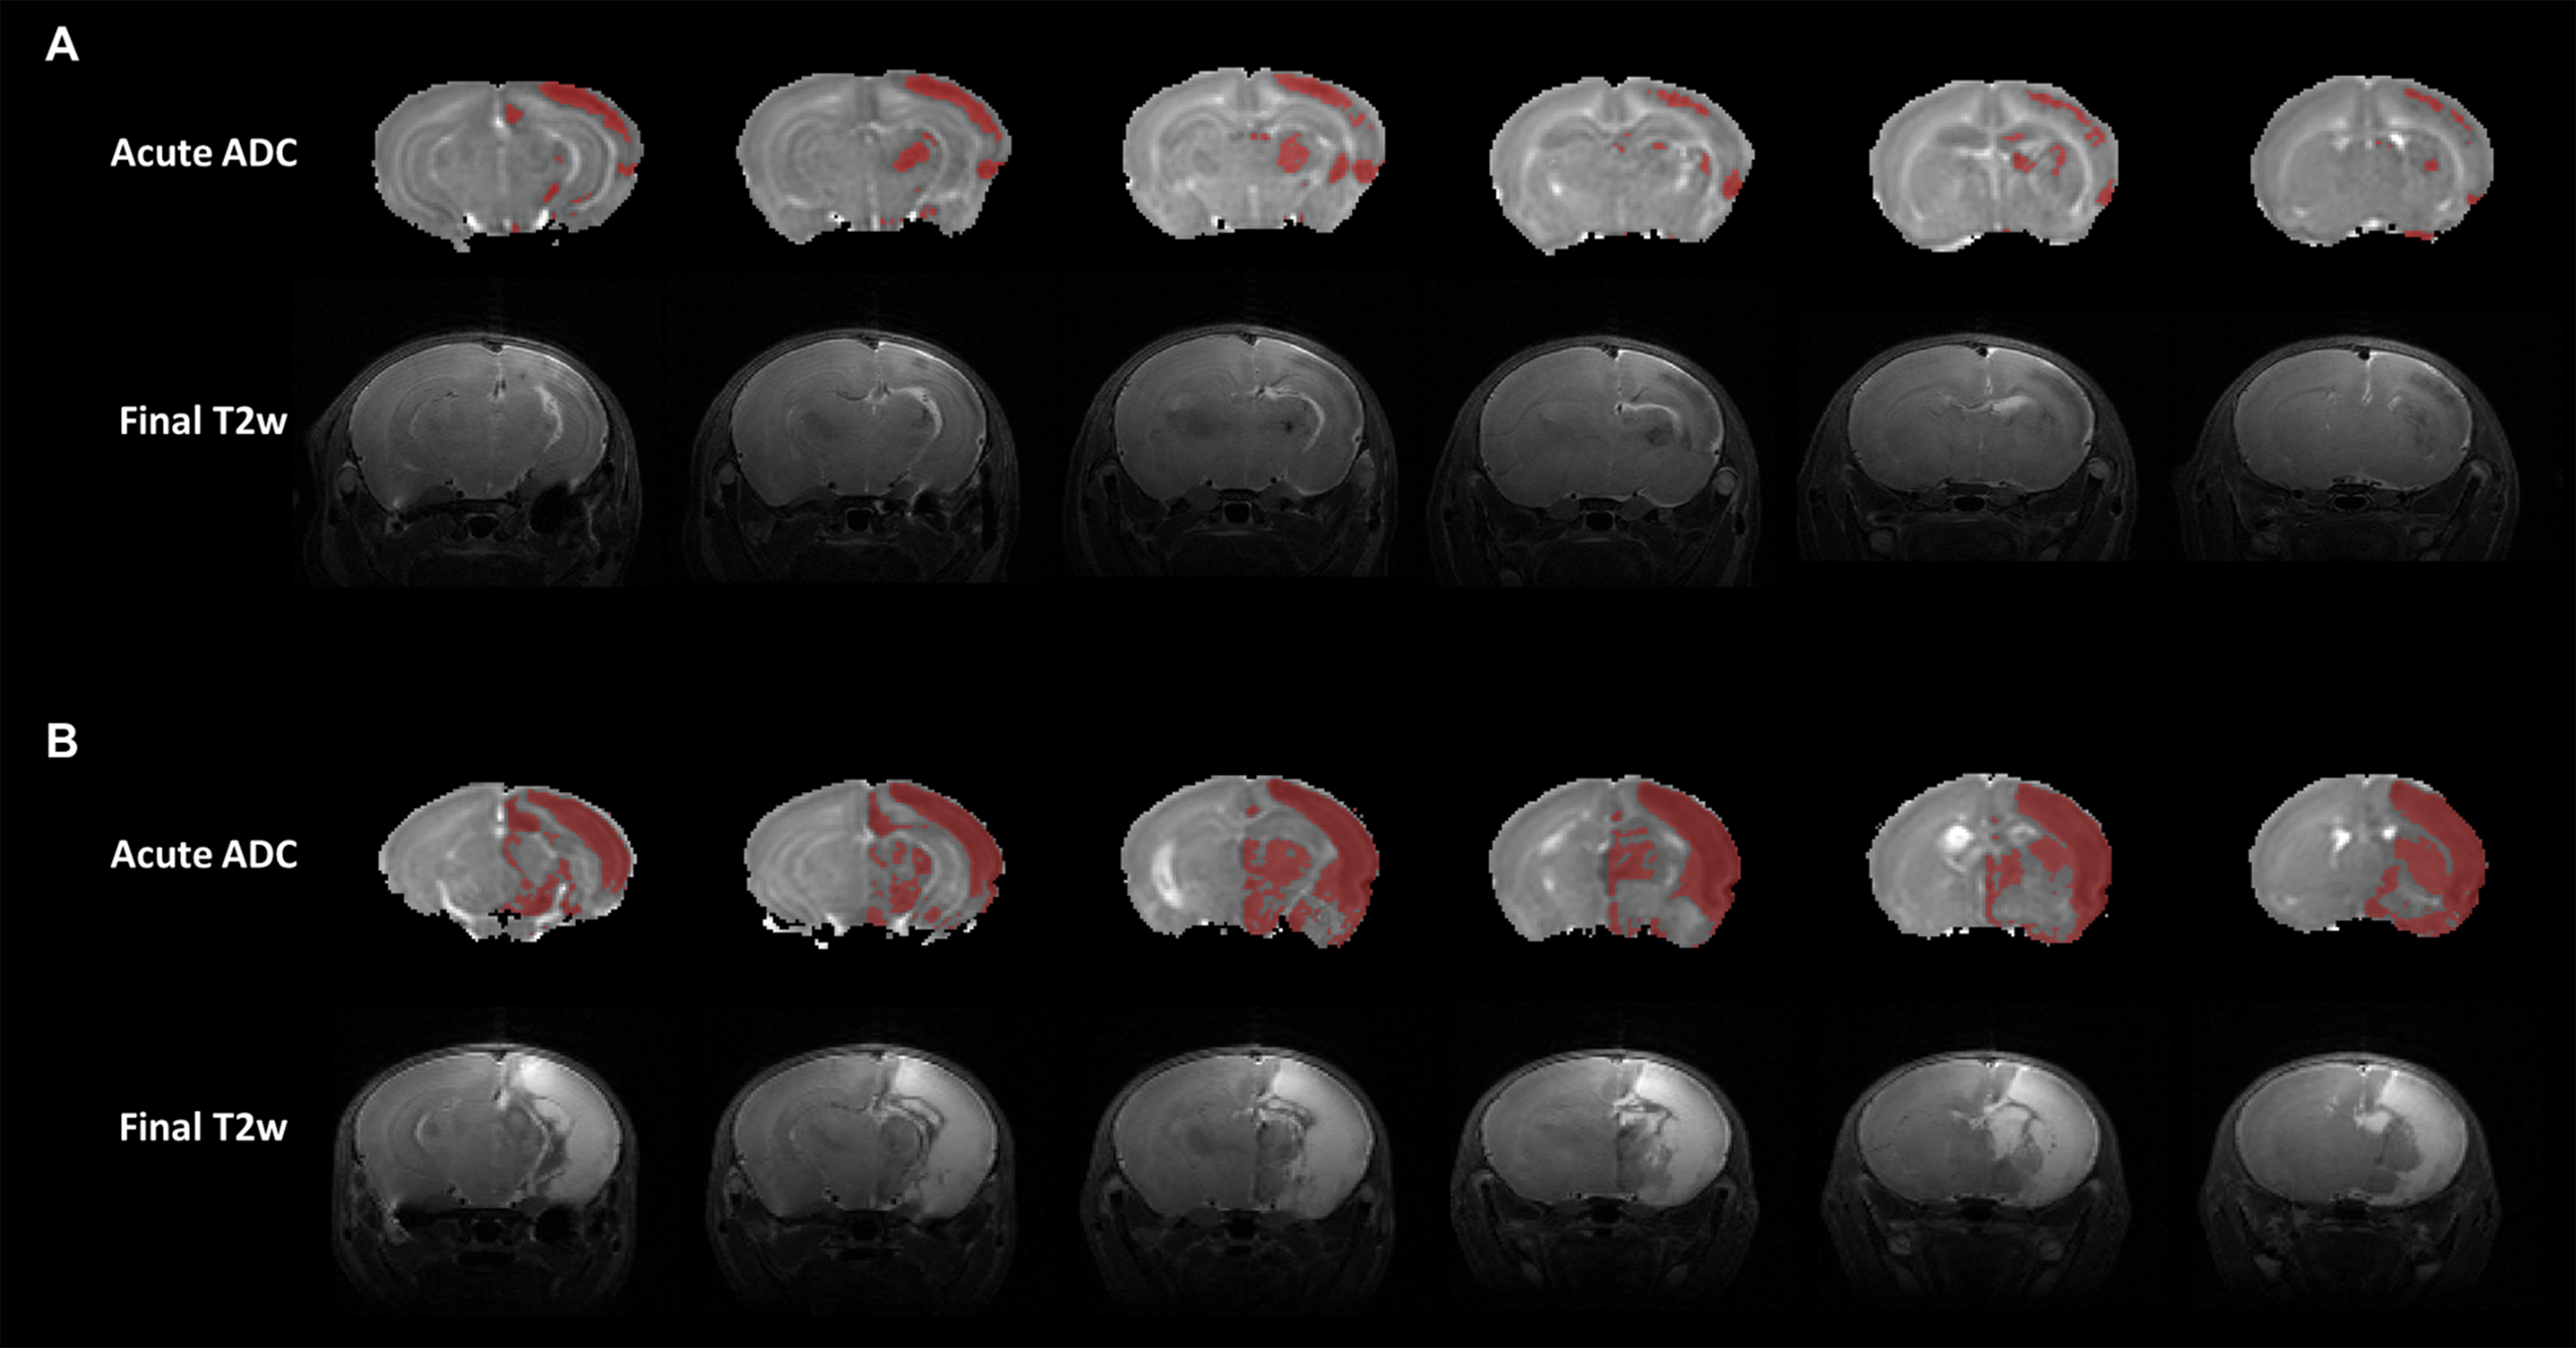
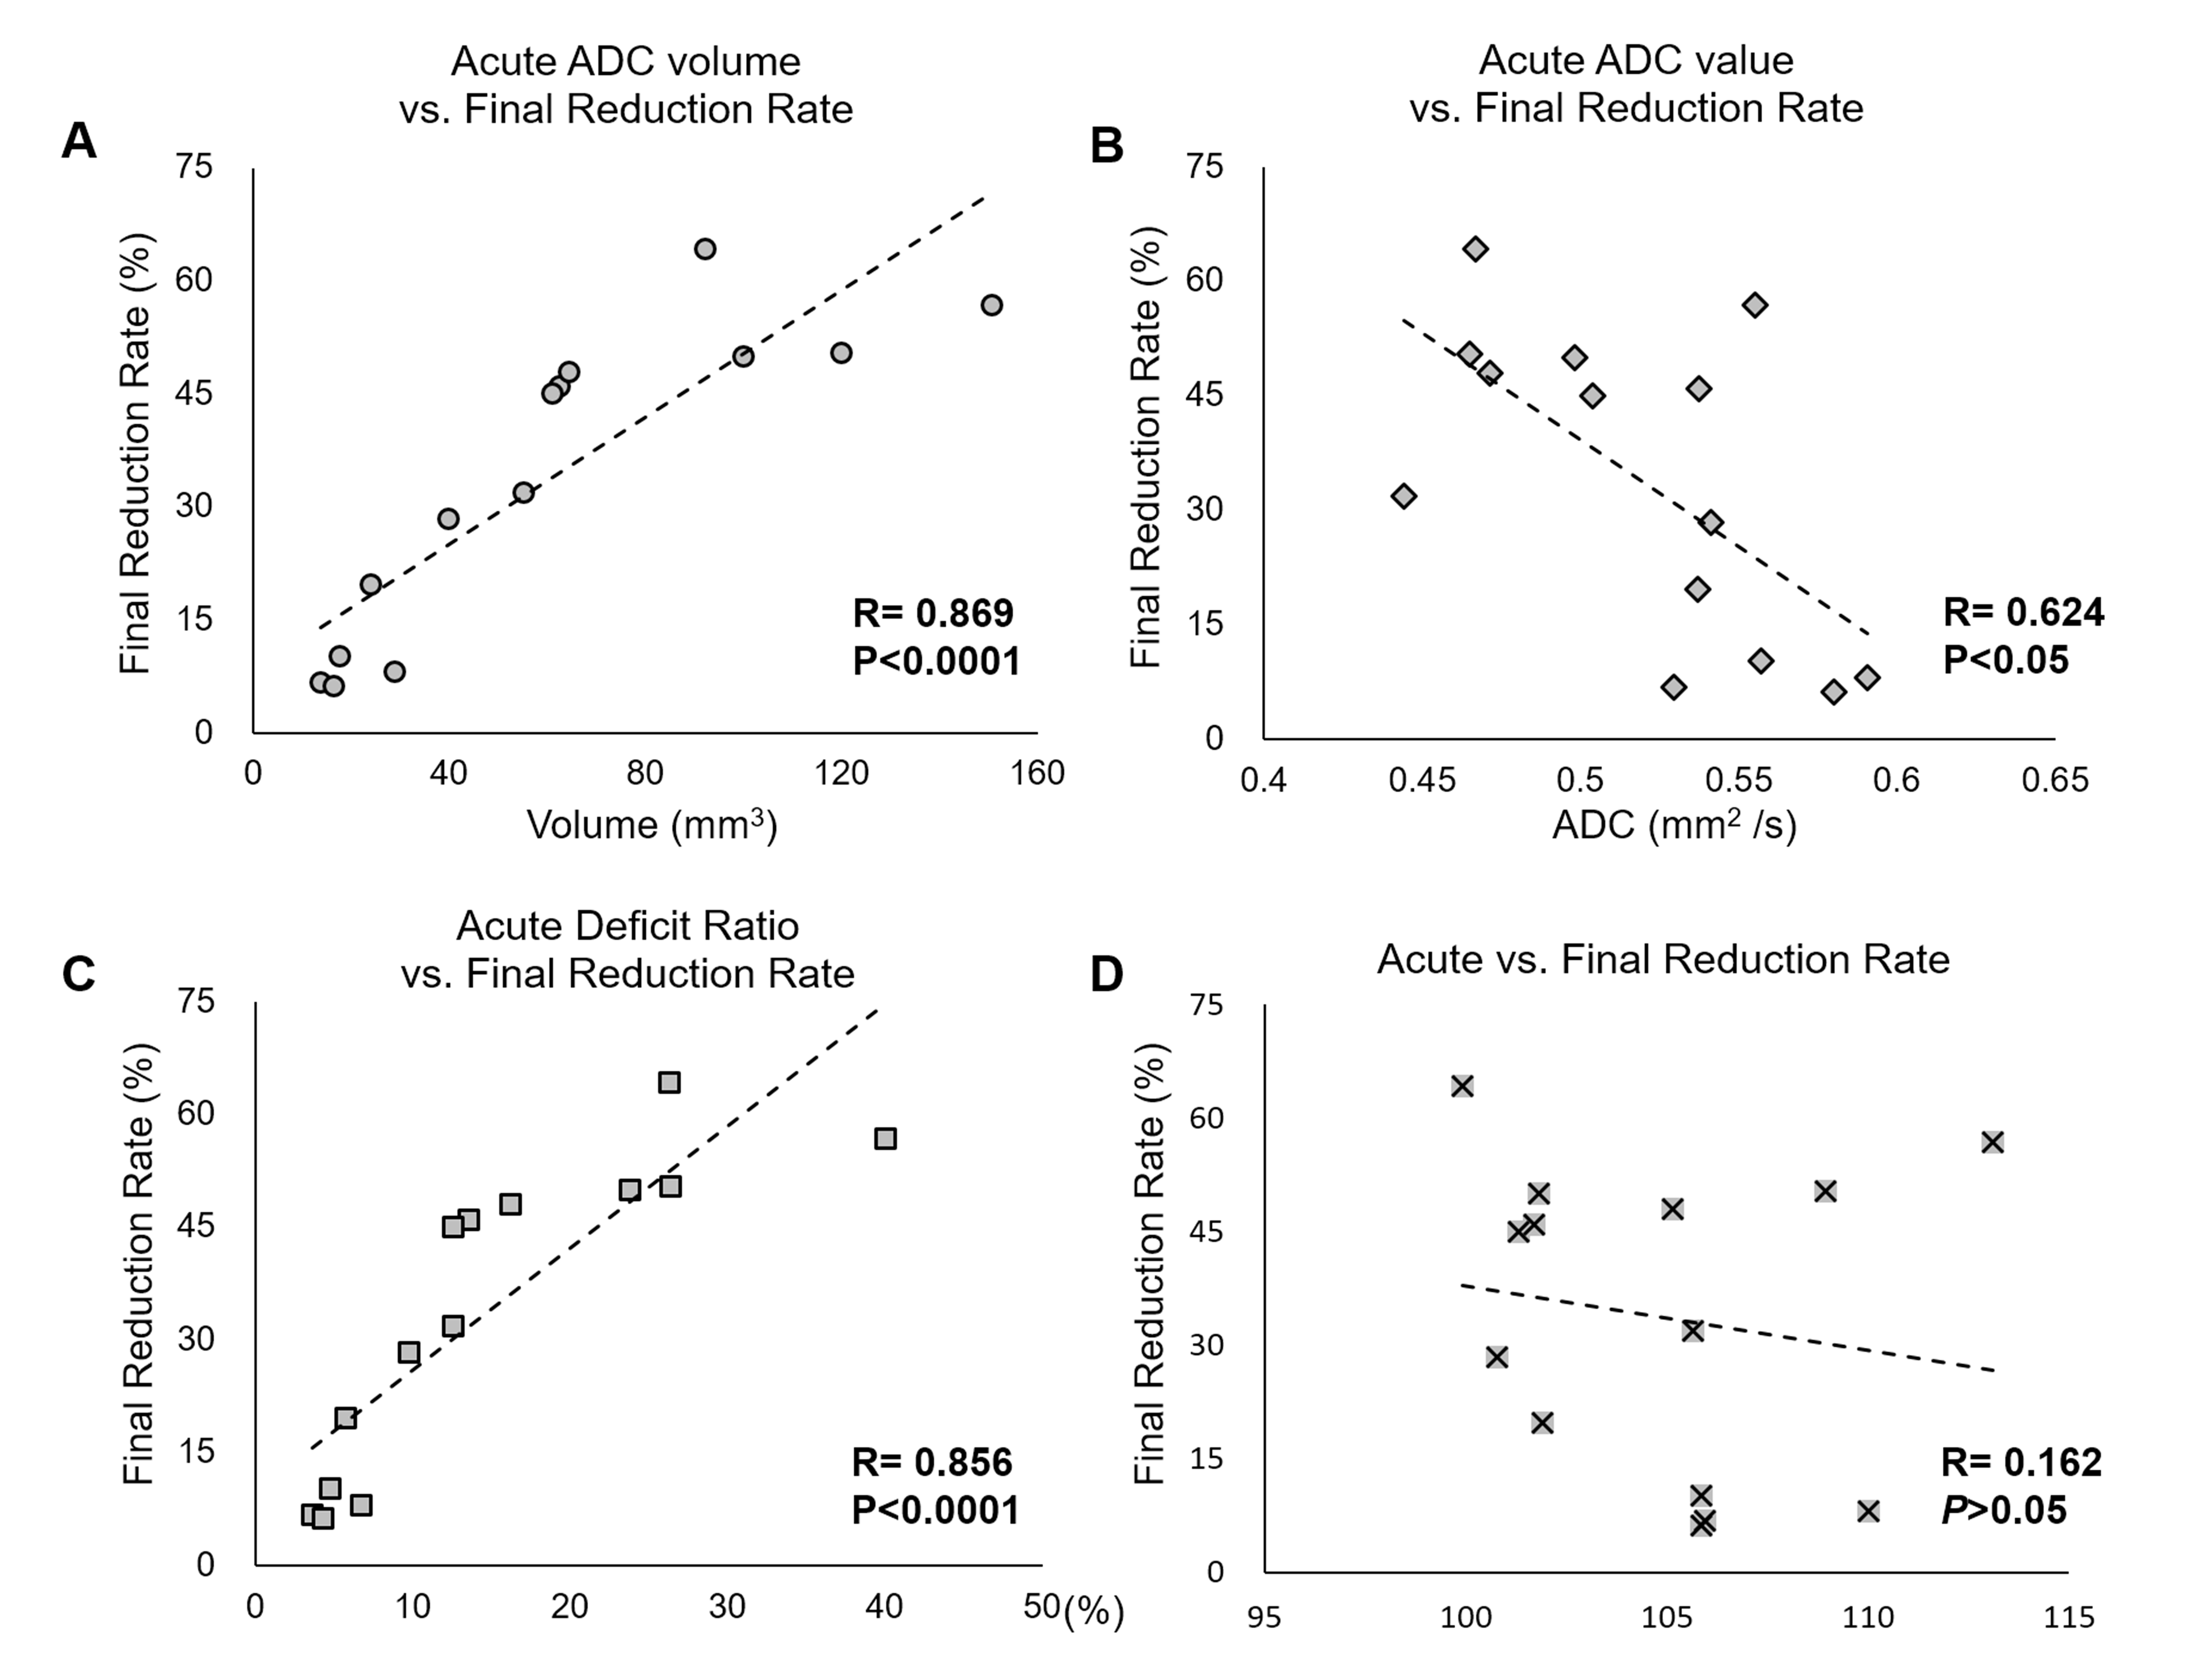
In this study, Rice-Vannucci model was performed to mimic the various degrees of neonatal HI encephalopathy found in clinical.4 We have successfully transferred the neonatal rat within 2 h after HI to 7T animal MRI for image acquisition and for the longitudinal MRI study at 24 h and 7 days post HI (Figure 1). The severity of HI injury was depicted by T2-weighted images and gross neuropathological examination at after 7 days post HI (Figure 2), suggesting the slower dynamics of brain injury after neonatal HI compared to that after ischemia in the adult brain. The cyst formation, the pathological characteristics for neonatal HI8, was highlighted with hyper-intensity in T2-weighted images at the final stage (Figure 2C). At 2 h after HI, significant changes in ADC maps were observed in multiple brain regions including the cortex, hippocampus, striatum, etc. of the ipsi-lesional hemisphere (Figure 3). The ADC-deficit volume, the ADC value in ADC-deficit area, as well as the deficit ratio at 2 h post HI, were highly correlated to the final reduction rate (P<0.05, Figure 4A-C). In contrast, the reduction rate of the ipsi-lesional hemisphere at 2 h was not correlated to the final reduction rate (P>0.05, Figure 4D). Taken together, our results suggested that the early change of ADC within 6 h post HI may indicate the following cyst formation resulting in the tissue loss of ipsi-lesional hemisphere after 7 days. Future studies will attempt to assess the whole spectrum of diffusion tensor imaging matrix for early prediction of final HI outcome.Acknowledgements
This study was funded in part by Taipei Medical University (TMU106-AE2-I12-02) and Ministry of Science and Technology (MOST 106-2314-B-038-079and MOST 105-2628-B-038-002-MY2), Taipei, Taiwan.References
1. Shankaran S, Laptook A R, Ehrenkranz R A, et al., Whole-body hypothermia for neonates with hypoxic-ischemic encephalopathy. N Engl J Med, 2005. 353(15): 1574-84.
2. Higgins R D, Raju T, Edwards A D, et al., Hypothermia and other treatment options for neonatal encephalopathy: an executive summary of the Eunice Kennedy Shriver NICHD workshop. J Pediatr, 2011. 159(5): 851-858 e1.
3. Chalak L F, Sanchez P J, Adams-Huet B, et al., Biomarkers for severity of neonatal hypoxic-ischemic encephalopathy and outcomes in newborns receiving hypothermia therapy. J Pediatr, 2014. 164(3): 468-74 e1.
4. Rice J E, 3rd, Vannucci R C, and Brierley J B, The influence of immaturity on hypoxic-ischemic brain damage in the rat. Ann Neurol, 1981. 9(2): 131-41.
5. Lee H T, Chang Y C, Tu Y F, et al., VEGF-A/VEGFR-2 signaling leading to cAMP response element-binding protein phosphorylation is a shared pathway underlying the protective effect of preconditioning on neurons and endothelial cells. J Neurosci, 2009. 29(14): 4356-68.
6. Kao Y J, Oyarzabal E A, Zhang H, et al., Role of Genetic Variation in Collateral Circulation in the Evolution of Acute Stroke: A Multimodal Magnetic Resonance Imaging Study. Stroke, 2017. 48(3): 754-761.
7. Kuo D P, Lu C F, Liou M, et al., Differentiation of the Infarct Core from Ischemic Penumbra within the First 4.5 Hours, Using Diffusion Tensor Imaging-Derived Metrics: A Rat Model. Korean J Radiol, 2017. 18(2): 269-278.
8. Rumajogee P, Bregman T, Miller S P, et al., Rodent Hypoxia-Ischemia Models for Cerebral Palsy Research: A Systematic Review. Front Neurol, 2016. 7: 57.
Figures