5264
Free-Water Elimination Diffusion Tensor Imaging to Assess Nerve Recovery in Excised Rat Nerve1Vanderbilt University Institute of Imaging Science, Nashville, TN, United States, 2Vanderbilt University School of Medicine, Nashville, TN, United States
Synopsis
We present our findings using a free water elimination model, which allows for the characterization of edema signal in diffusion measurements. We validate this model on ex vivo rat nerve data after sham surgeries on the sciatic nerve. The free water model effectively accounts for inflammation following sham surgeries, leading to increased accuracy in fractional anisotropy measurements throughout the recovery process. This model will be applied in other injury models (crush, transection/surgical repair) to test its ability to independently monitor inflammation/edema and nerve degeneration/regeneration.
Introduction
Up to 5% of all admissions to level I trauma centers have a traumatic peripheral nerve injury (TPNI); and a significant increase in the incidence of TPNI has been noted in recent military combat missions. For function to be restored, surgical intervention and nerve regeneration must occur prior to the onset of permanent muscle atrophy. Previous work has shown that diffusion tensor imaging (DTI) can provide information about nerve regeneration, but may be limited immediately following the injury due to inflammation near the injury site1. Here, we investigate the ability of the free-water elimination (FWE) model2, which was originally proposed to remove partial-volume effects near brain-CSF boundaries, to eliminate the confounding influence of edema/inflammation in rat sciatic nerve models of injury and repair.Methods
Sham surgeries, where the sciatic nerve was surgically exposed proximally and distally without damaging the nerve, were performed to model edema/inflammation in Sprague-Dawley rats (n = 21). MRI studies were performed on nerves at 1, 2, 4 or 12 weeks. Following euthanasia, ≈1-cm segments of the sciatic nerve was excised from the hind limb, fixed in 4% glutaraldehyde for 48 hours, washed in PBS for 24 hours to remove excess fixative, and doped with 1mM of Gd-DTPA to reduce scan times. MRI data were then acquired at bore temperature (≈25˚C) in a 7-T, 16-cm bore Varian Direct Drive scanner and 25-mm quadrature Doty Scientific. DTI was performed using a 3D pulsed-gradient spin-echo (PGSE) sequence with 20 diffusion directions each at b=2,000 and 4,000 s/mm2 (and two b=0 s/mm2 acquisitions). Additional parameters included: TE/TR=22/425 ms, FOV=6x6x16 mm3, resolution=125x125x372 mm3, NEX=2, and a scan time≈15 hours. Following DTI, nerve sample were processed for light microscopy. To do so, samples were post-fixed in osmium tetroxide, and embedded in Epon. From these blocks, sections (1 µm thick) were cut, stained with toluidine blue, and evaluated by light microscopy.
Sham nerves were analyzed with both standard DTI and FWE models in MATLAB. DTI parameters (fractional anisotropy, FA) were estimated via weighted linear least-squares fitting of the noisy data with the following signal equation:
Sk = S0e-bgk'Dgk
where Sk is the signal intensity at the kth diffusion gradient direction gk, the ' operator represents the transpose operation, S0 is the signal intensity value with no diffusion weighting, b is the diffusion weighting, and D is the diffusion tensor.
The FWE signal model adds an additional isotropic term to account for the effect of edema/inflammation
Sk = S0(fisoe-bDiso + (1-fiso)e-bgk'Dgk)
where fiso is the relative contribution of this isotropic diffusion term (i.e., from edema) and Diso is the corresponding diffusion coefficient. For the studies herein, Diso was assumed to be 2.29x10⁻³ mm2/s, which is the self-diffusion coefficient of water at 25˚C4. The remaining model parameters (fiso, FA from the anisotropic tensor D) via nonlinear least-squares fitting2,4, using the results from the standard DTI model as the initial guess.
Results
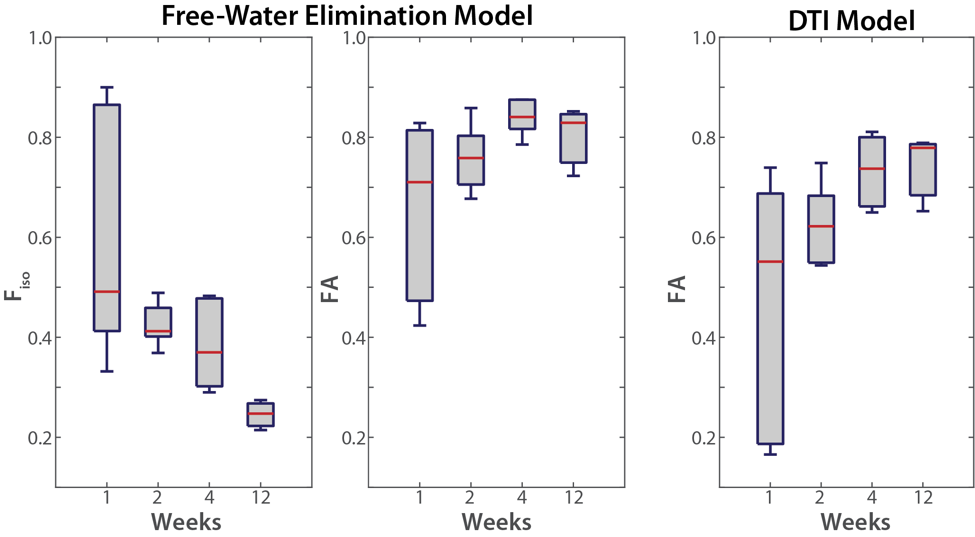
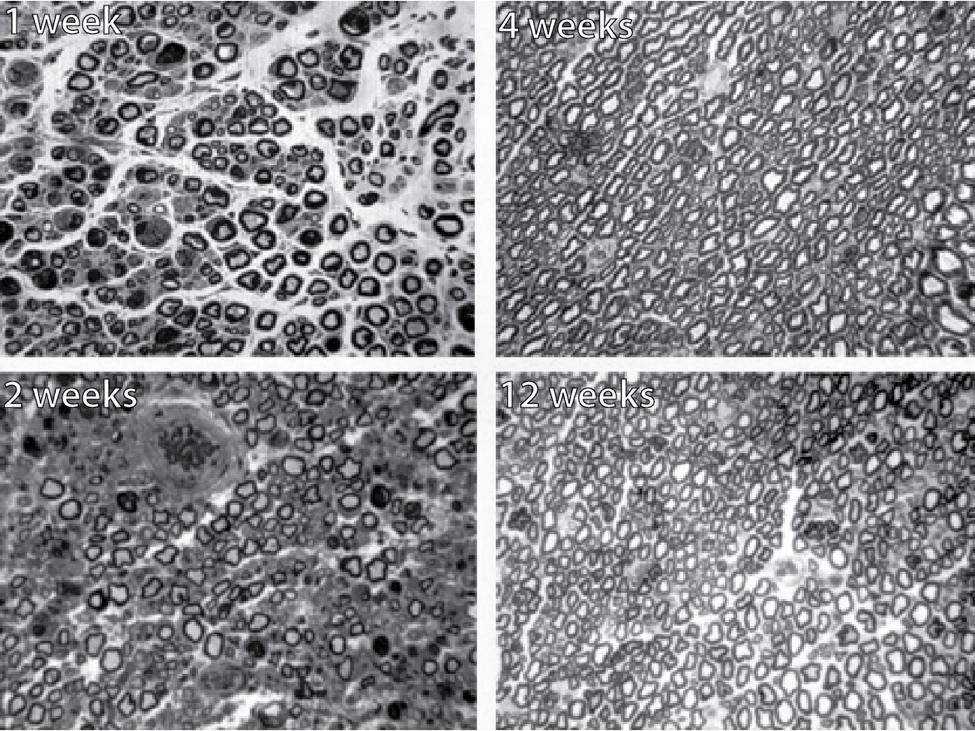
As shown in Figure 1, the standard DTI and FWE analyses yielded significantly different results in the sham nerves, especially in the first two weeks after the surgery. The FWE model yielded more consistent FA values across the 12 weeks, likely due to the fact that the FWE model was able account for the confounding influence of edema, while the standard DTI analysis could not. This is consistent with the estimated fiso values, which decreased over time. Our MRI finding were further corroborated by histological studies (Fig. 2), which show significant increases in extra-cellular space in the two weeks after the sham surgery, but no evidence of axonal degeneration.Discussion and Conclusions
This study demonstrates that the FWE model provides more accurate FA estimates relative to the standard DTI model in a rat sciatic nerve model of inflammation. These results were consistent with histological findings. Taken together, these results suggest that the FWE model is more appropriate for monitoring nerve injury repair, especially in cases where one expect concurrent inflammatory activity in the area being studied. Future work includes i) applying the FWE model in crush and transection/surgical repair rat models and ii) validation of FWE estimates via quantitative morphological estimates of the extra-cellular volume fraction, and iii) translation of this method into humans following nerve injury and repair.Acknowledgements
We thank NIH K25 EB013659 and R01 NS97821 for funding.References
1. Stanisz, G. J., et al. Magn. Reson. Med 45, 415-420 (2001).
2. Hoy, A. R., et al. Neuroimage. 103: 323-333 (2014).
3. Henriques, R. N., et al. bioRxiv, doi: http://dx.doi.org/10.1101/108795 (2017).
4. Holz, M., et al. Physical Chemistry Chemical Physics, 2: 2740-4742 (2000).
Figures