5262
Diffusion tensor changes in acute neuroinflammation in rats1Department of Neuroimaging, King's College London, Institute of Psychiatry, Psychology and Neuroscience, London, United Kingdom, 2Wellcome Trust Consortium for Neuroimmunology of Mood Disorders and Alzheimer's Disease, London, United Kingdom, 3Department of Life, Health and Environmental Sciences, University of L'Aquila, L'Aquila, Italy, 4Department of Psychological Medicine, King's College London, Institute of Psychiatry, Psychology and Neuroscience, London, United Kingdom
Synopsis
Many neurodegenerative and psychiatric disorders feature low level neuroinflammation that is insidious yet difficult to diagnose in vivo. Here we explore the possibility of detecting acute neuroinflammation induced by systemic administration of lipopolysaccharide (LPS) in rats using in vivo diffusion tensor imaging (DTI) at 9.4T. Subtle yet widespread decreases in fractional anisotropy and increases in mean diffusivity were found in LPS-treated rats. Our results confirm the notion that DTI metrics are potential sensitive biomarkers of the dynamic inflammatory response in the brain, raising the possibility of utilizing DTI as a non-invasive in vivo assay for therapeutic interventions.
Introduction
Many neurodegenerative and psychiatric disorders feature low level neuroinflammation that is insidious yet difficult to diagnose in vivo. Non-invasive imaging biomarkers are urgently needed to detect neuroinflammation in patients; equally, the ability to image neuroinflammation in experimental animals is important for development of therapeutic interventions.
Here we explore the possibility of detecting acute neuroinflammation in rodents using diffusion tensor imaging (DTI). Systemic administration of bacterial endotoxin LPS (lipopolysaccharide) causes acute inflammation characterized by the release of inflammatory mediators, which eventually results in neuroinflammation characterized by activated microglia and the release of pro-inflammatory cytokines1. Having previously shown functional connectivity changes2, we focus here on structural DTI metrics in animals treated with LPS vs controls.
Methods
Male Sprague Dawley rats were given i.p. injections of LPS (0.5mg/kg, n=17) or saline vehicle (n=12). After 24h, they were imaged in vivo on a Bruker 9.4T scanner using an 86-mm volume resonator for transmission and a 4-channel surface array receiver coil. For each rat, a T2w structural reference image and DTI data were acquired using the following sequences: T2w – 3D RARE, TE/TR=32/1800 ms, RARE factor=12, FOV=30×20×20 mm, matrix=192×128×64, scan time=14 min 42 s; DTI – 2D spin-echo EPI, 1 segment, TE/TR=24.5/9000 ms, FOV=21.12×17.16 mm, matrix=64×52, 64 slices, slice thickness=0.33, b-value=1000, 60 diffusion directions, scan time ~15 min with respiration gating. Additional b0 images with opposite phase encoding polarity were acquired for correction of susceptibility-induced distortions3,4. After distortion and motion correction5, fractional anisotropy (FA) and mean diffusivity (MD) maps were calculated.
A multimodal study template was constructed using the T2w images and FA maps6. The FA and MD maps of each brain were non-linearly registered to the study template which was then non-linearly registered to the rat brain atlas7. Voxel-wise analysis was performed using permutation tests and threshold-free cluster enhancement (TFCE) to test for differences in FA and MD between the LPS and control groups8.
For region-based analysis, and mean FA and MD values were calculated for 43 hand-drawn regions of interest (ROI). Two-tailed Mann-Whitney U tests were performed to test for differences between the groups. For regions in which FA or MD was significantly different, we calculated the Spearman correlation between the DTI parameters and eight non-MRI measurements: body weight relative to baseline; plasma levels of α-2-macroglobulin, tumor necrosis factor alpha (TNFα), interleukin (IL) 1b, IL 6 and KC/GRO; and brain levels of IL 6 and KC/GRO.
Results
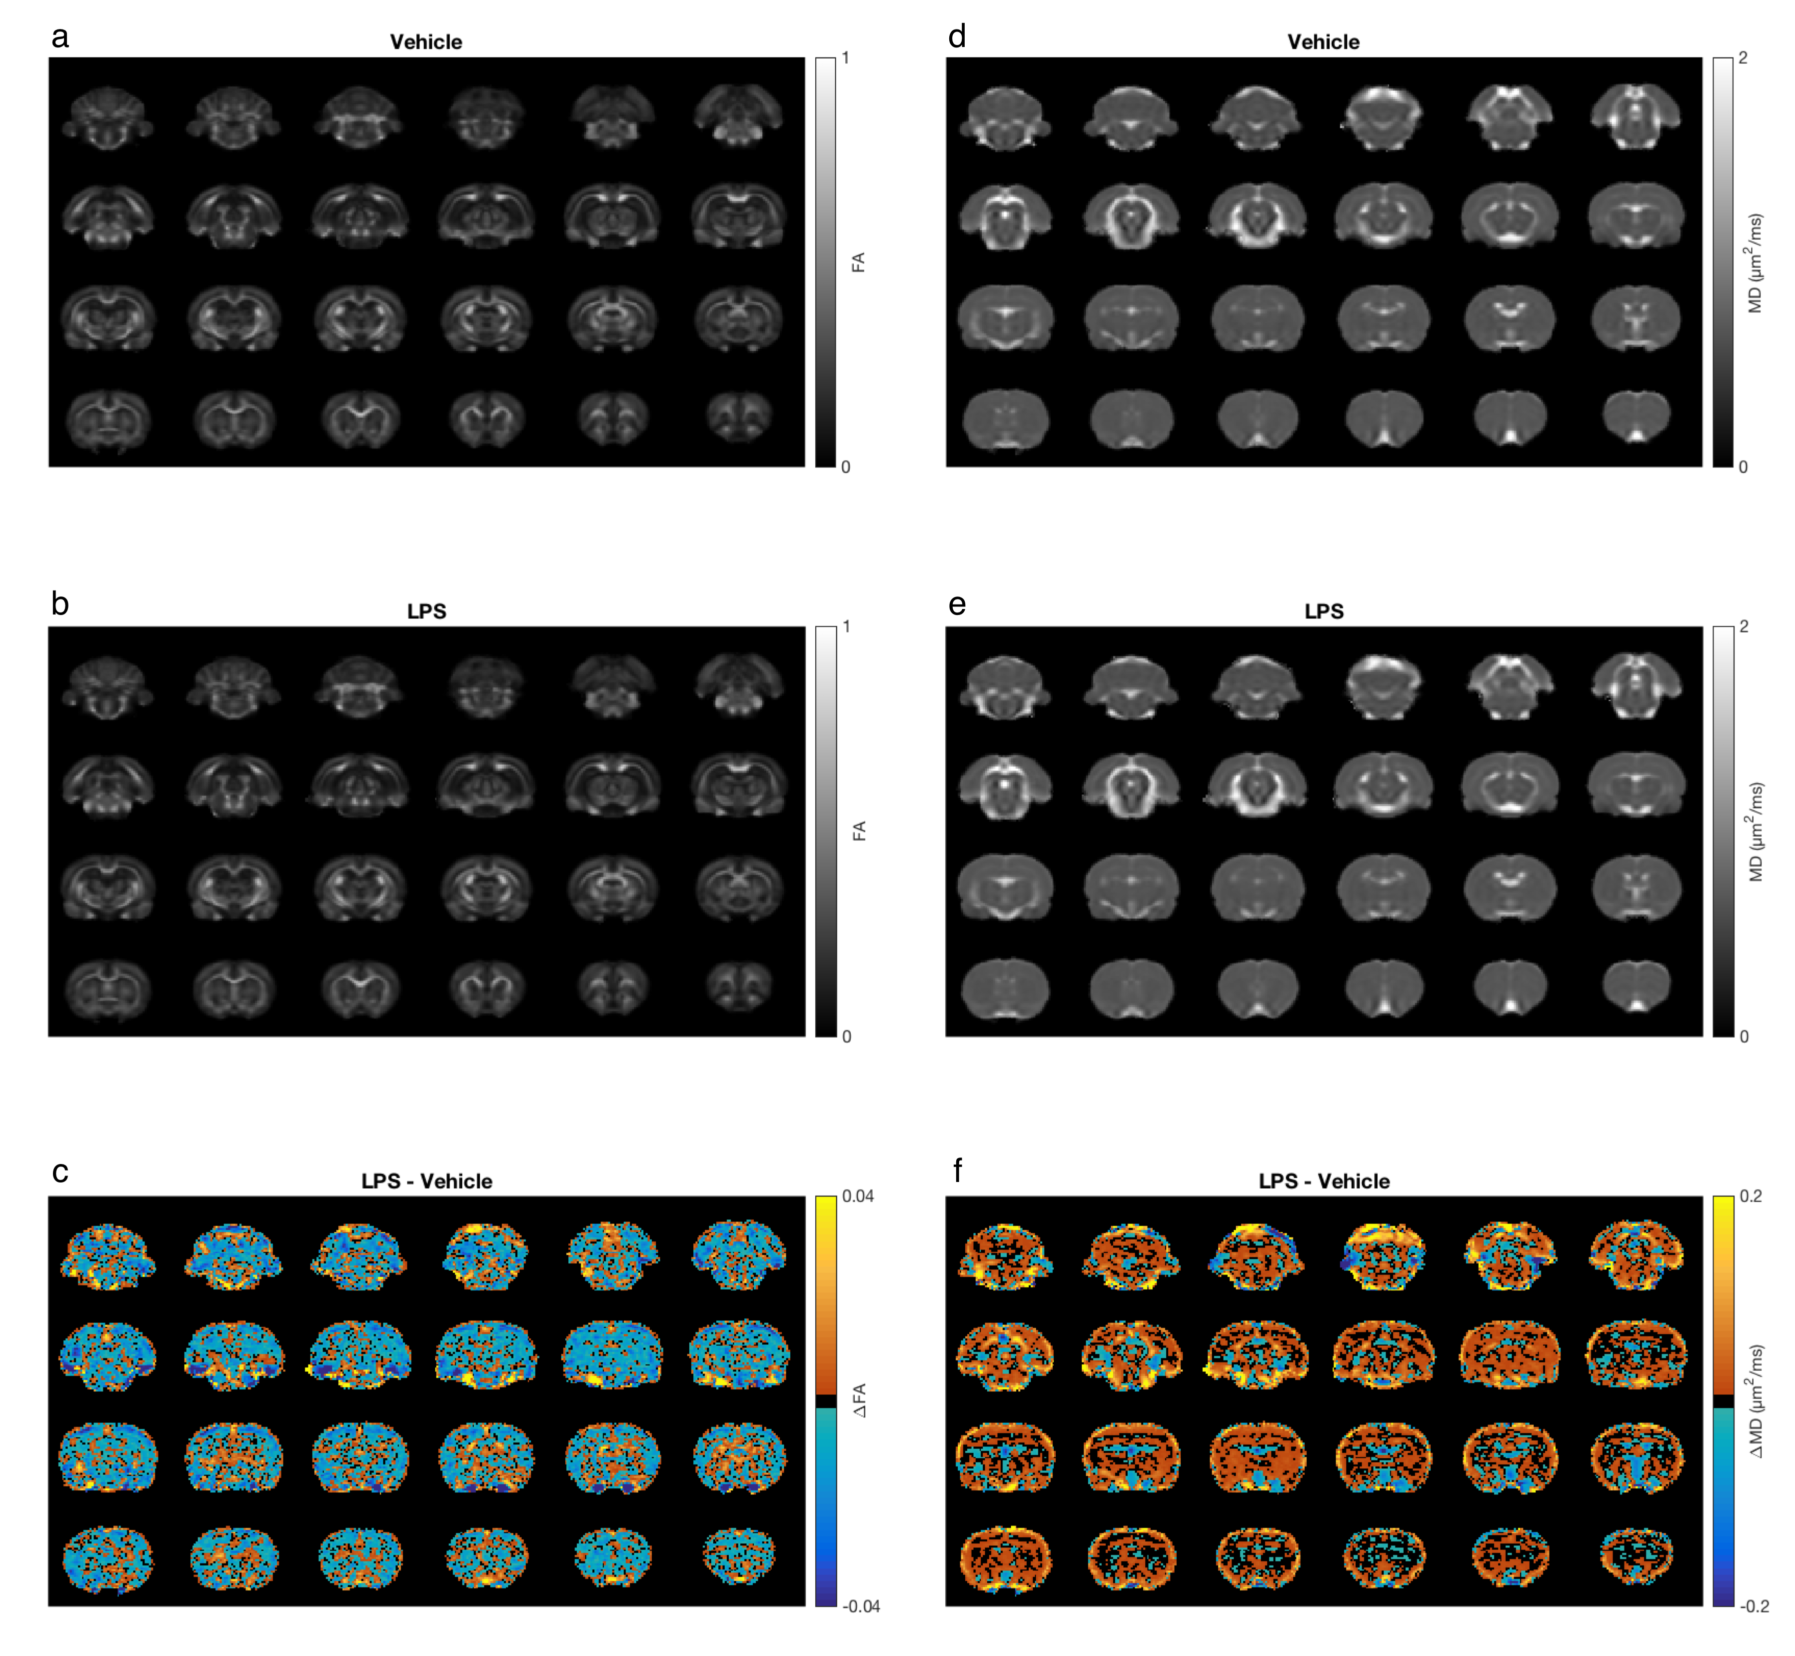
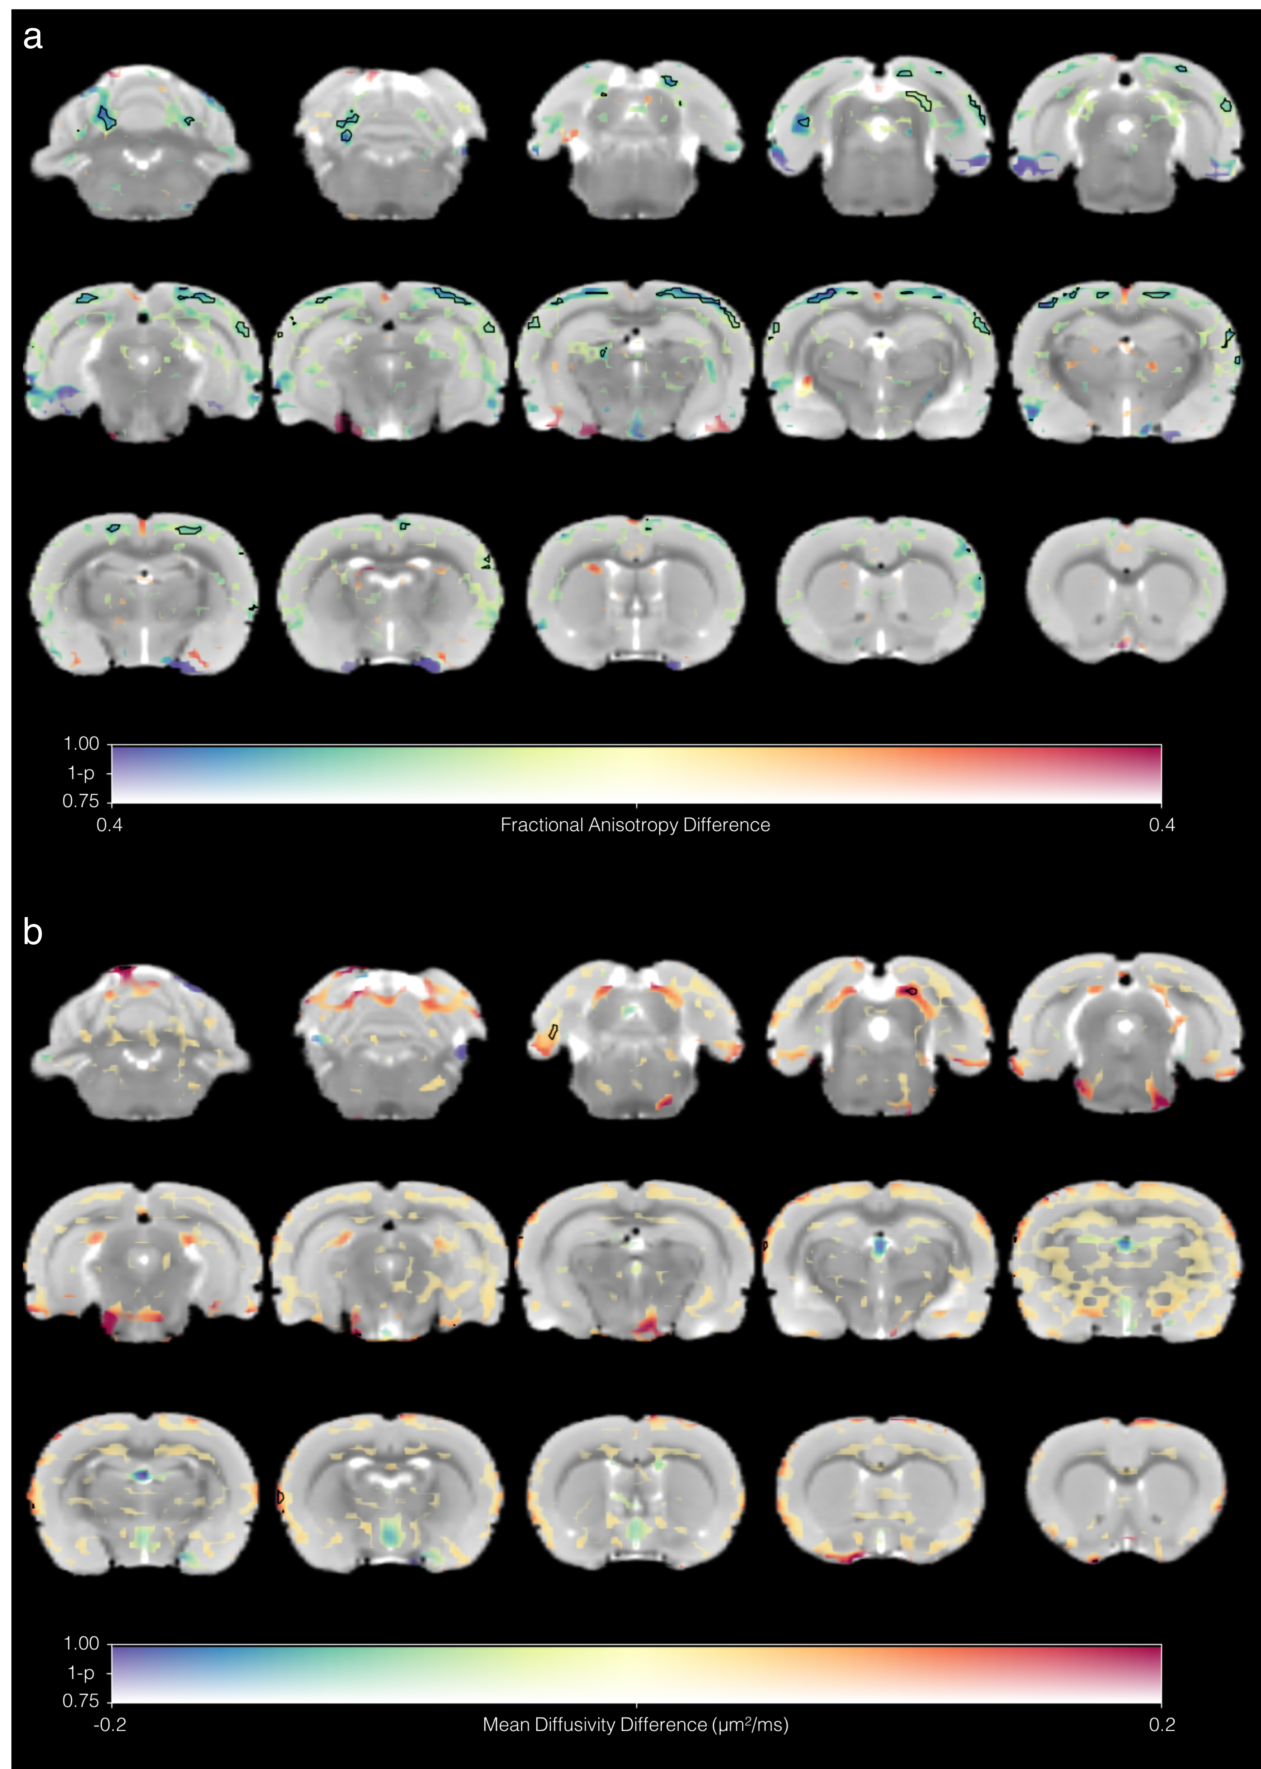
Group mean FA and MD maps are shown in Fig 1. Generally, the mean FA was lower and the mean MD higher in the LPS group. Voxel-wise analysis indicated reduced FA in regions of the cortex in LPS-treated rats compared to controls (Fig 2a). MD was not significantly different between the two groups (Fig 2b).
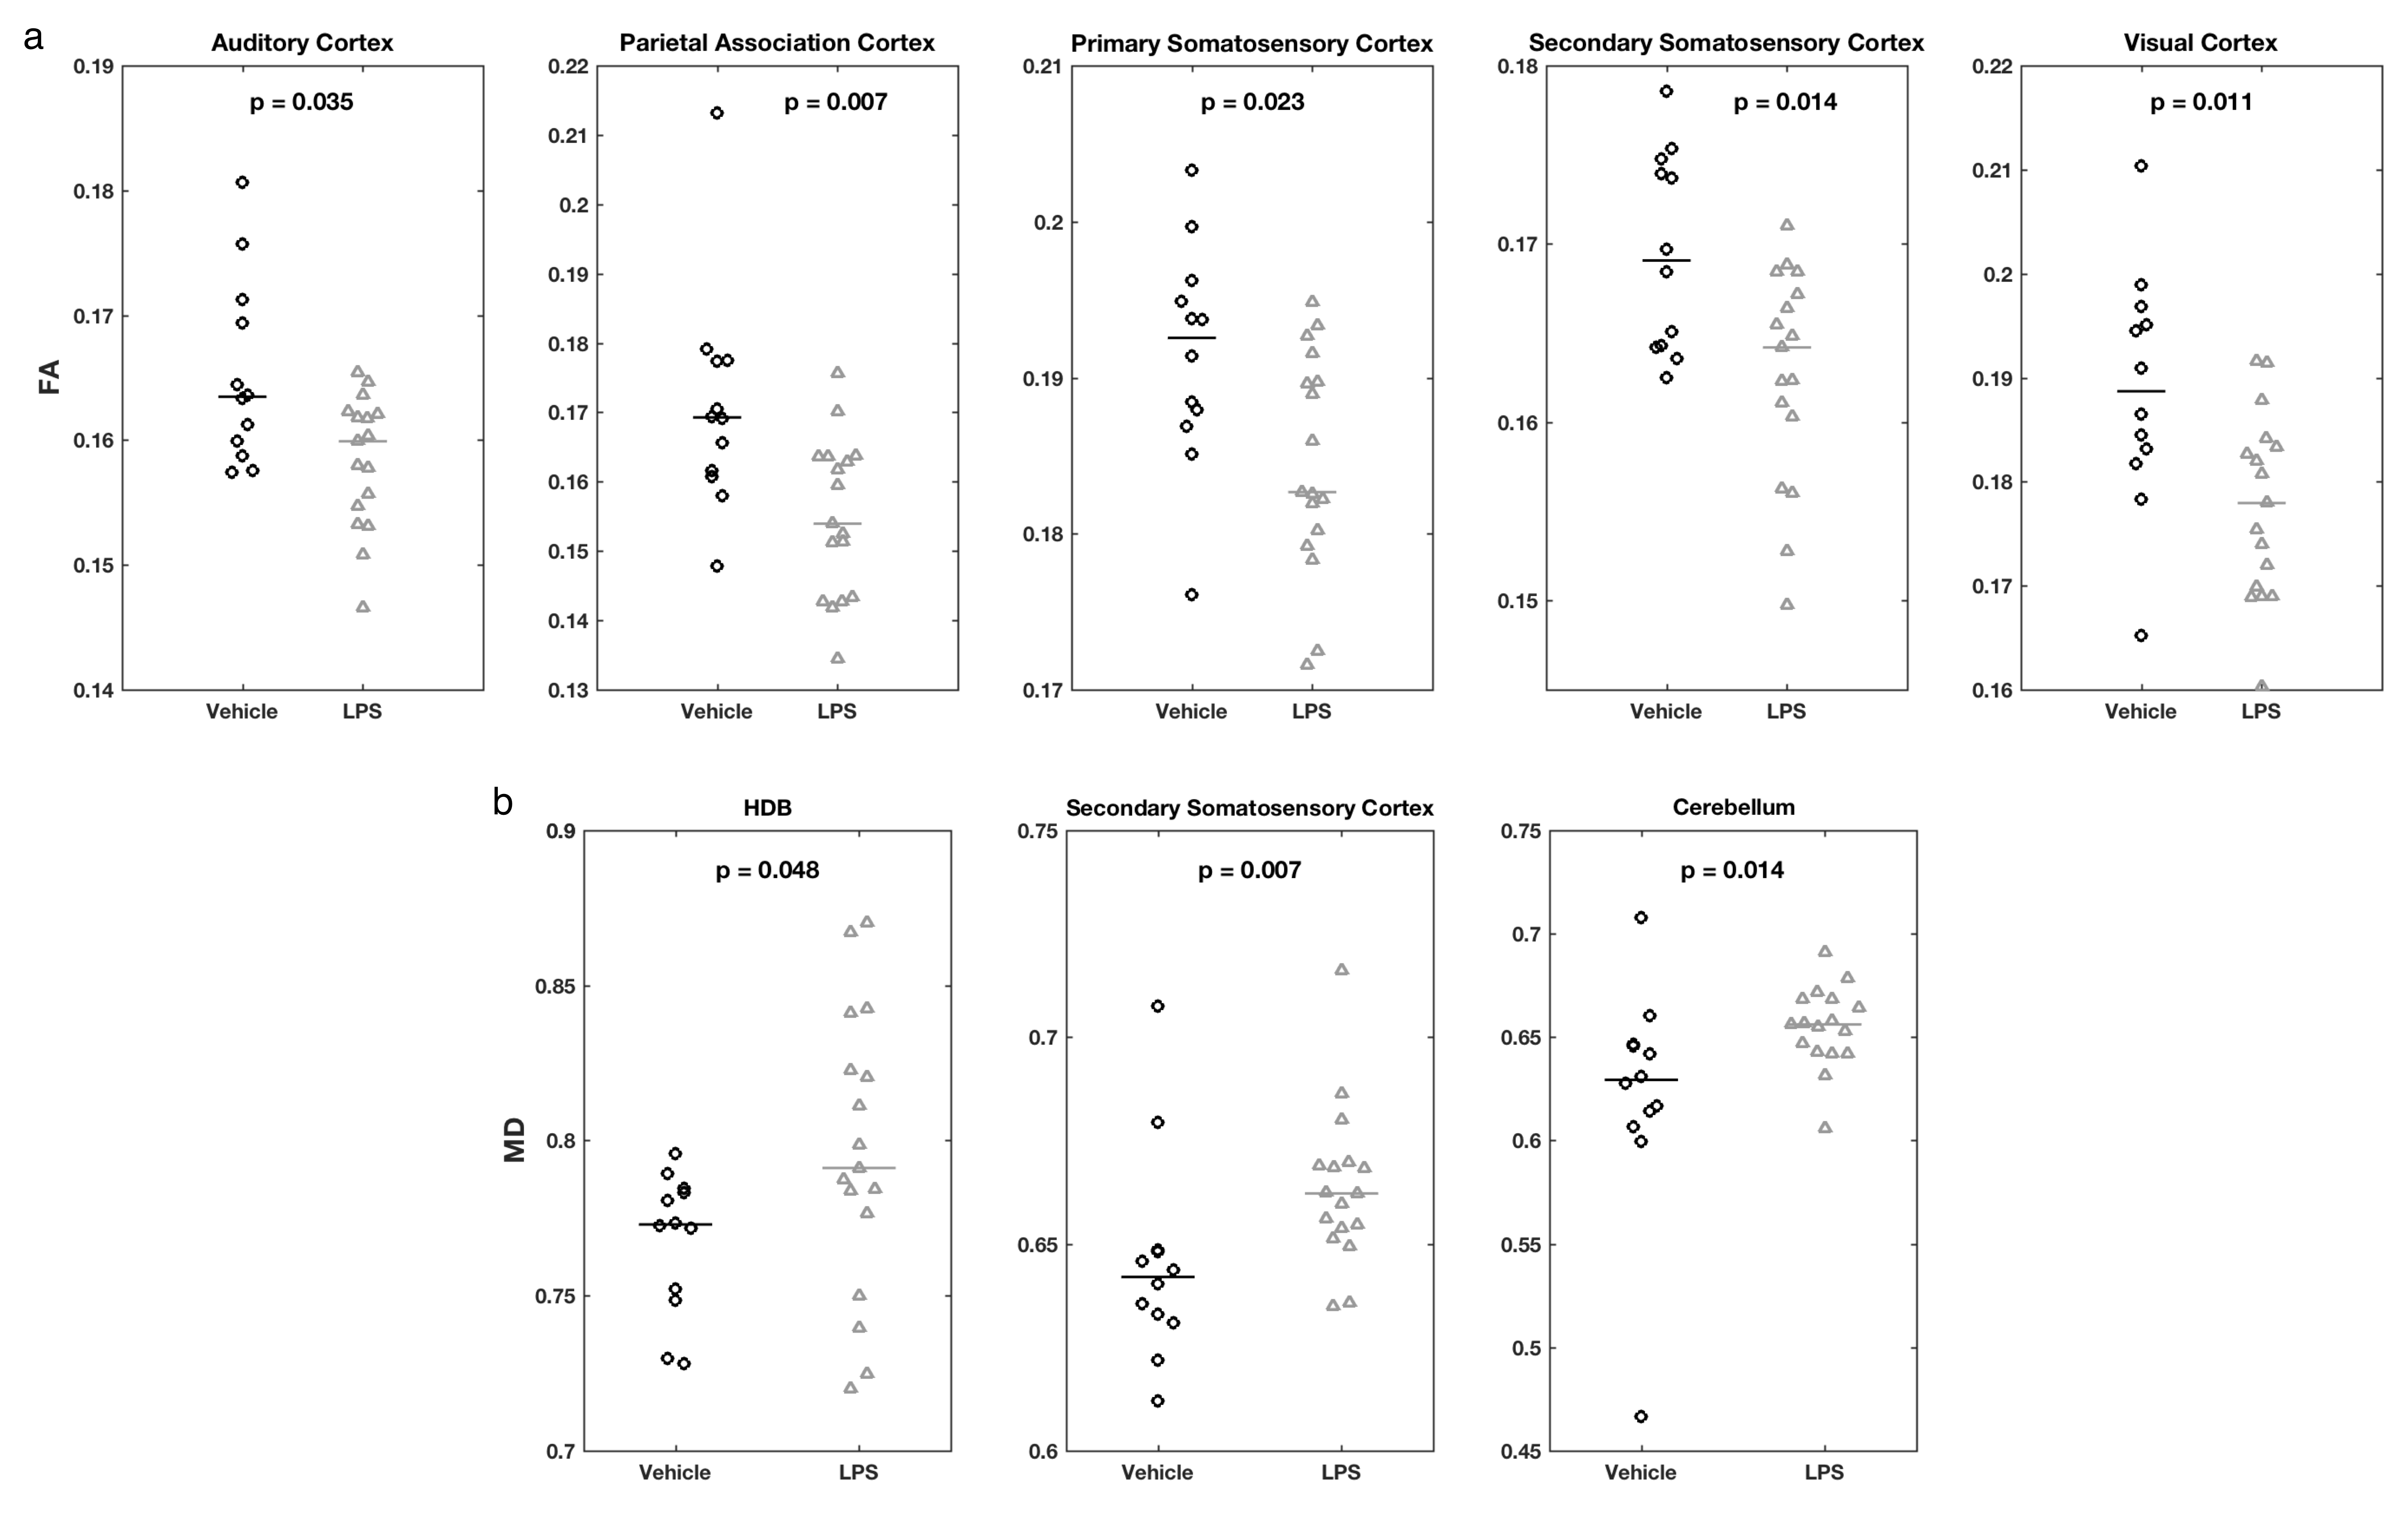
Region-based analysis produced similar results – FA was lower in various cortical regions of LPS-treated rats[CD1] (Fig 3a). Increased MD in the LPS group were seen in the horizontal limb of the diagonal band of Broca (HDB), secondary somatosensory cortex, and cerebellum (Fig 3b). There were no significant differences after correcting for multiple testing.
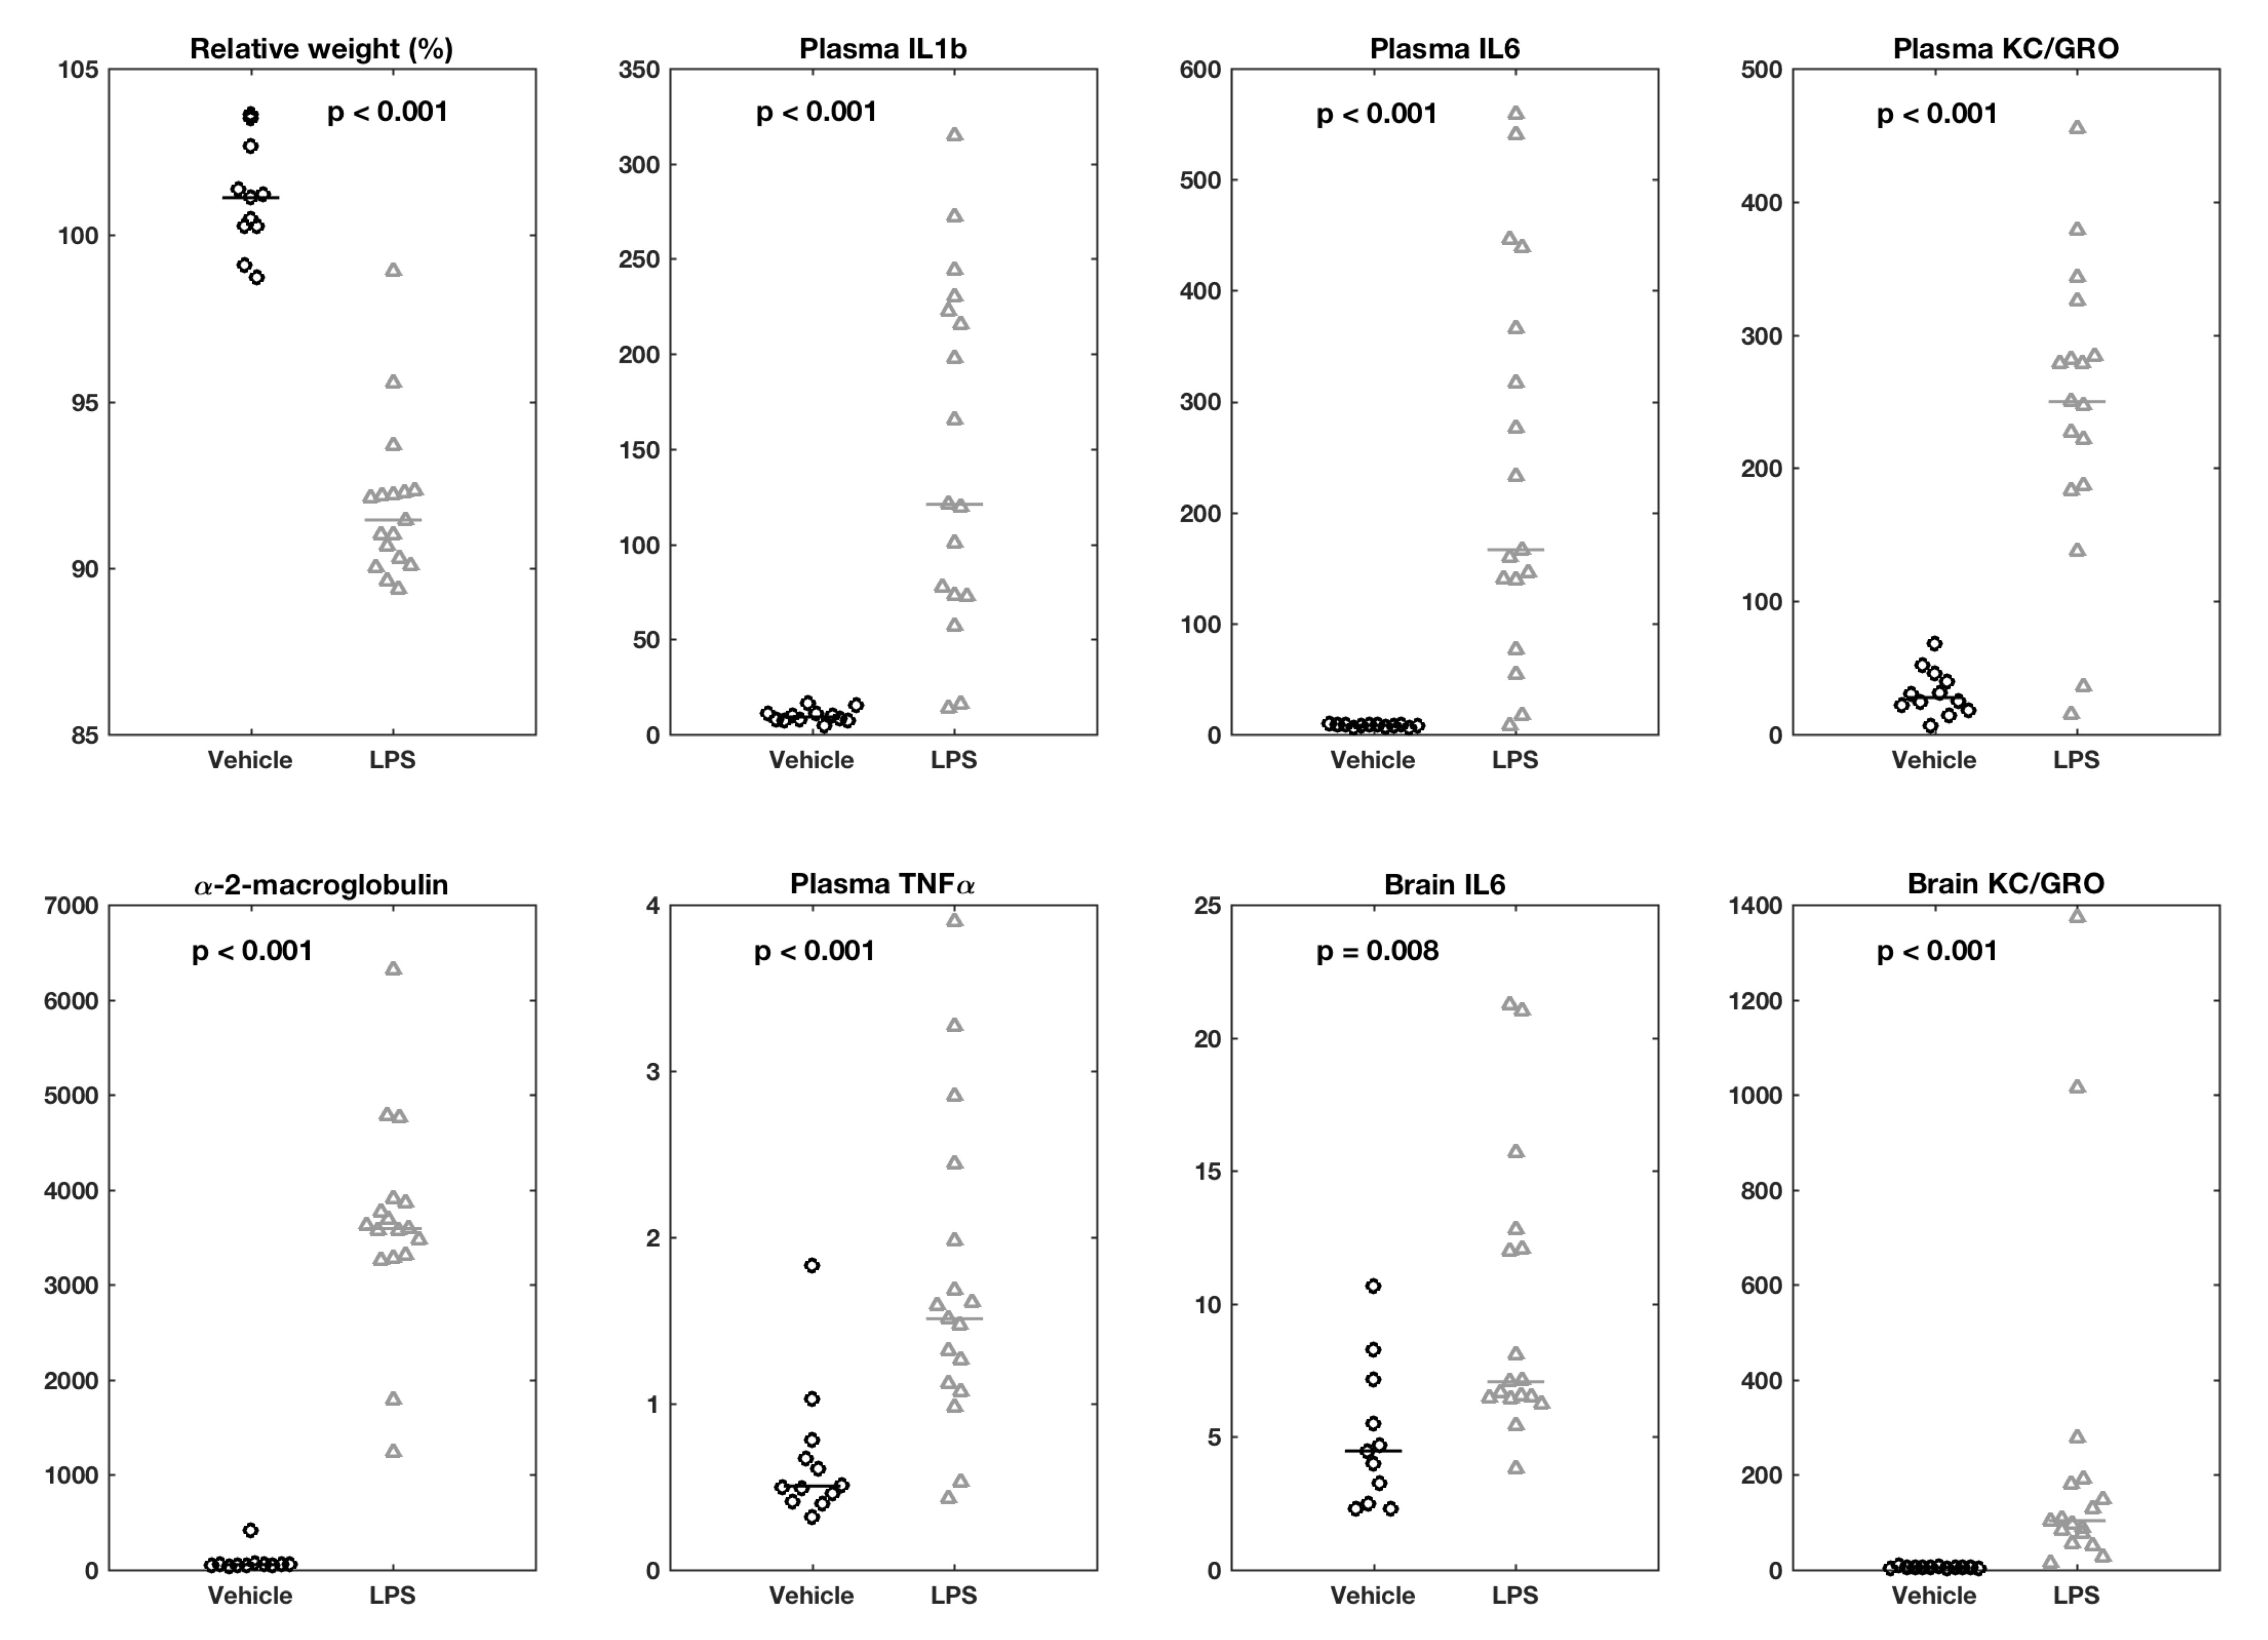
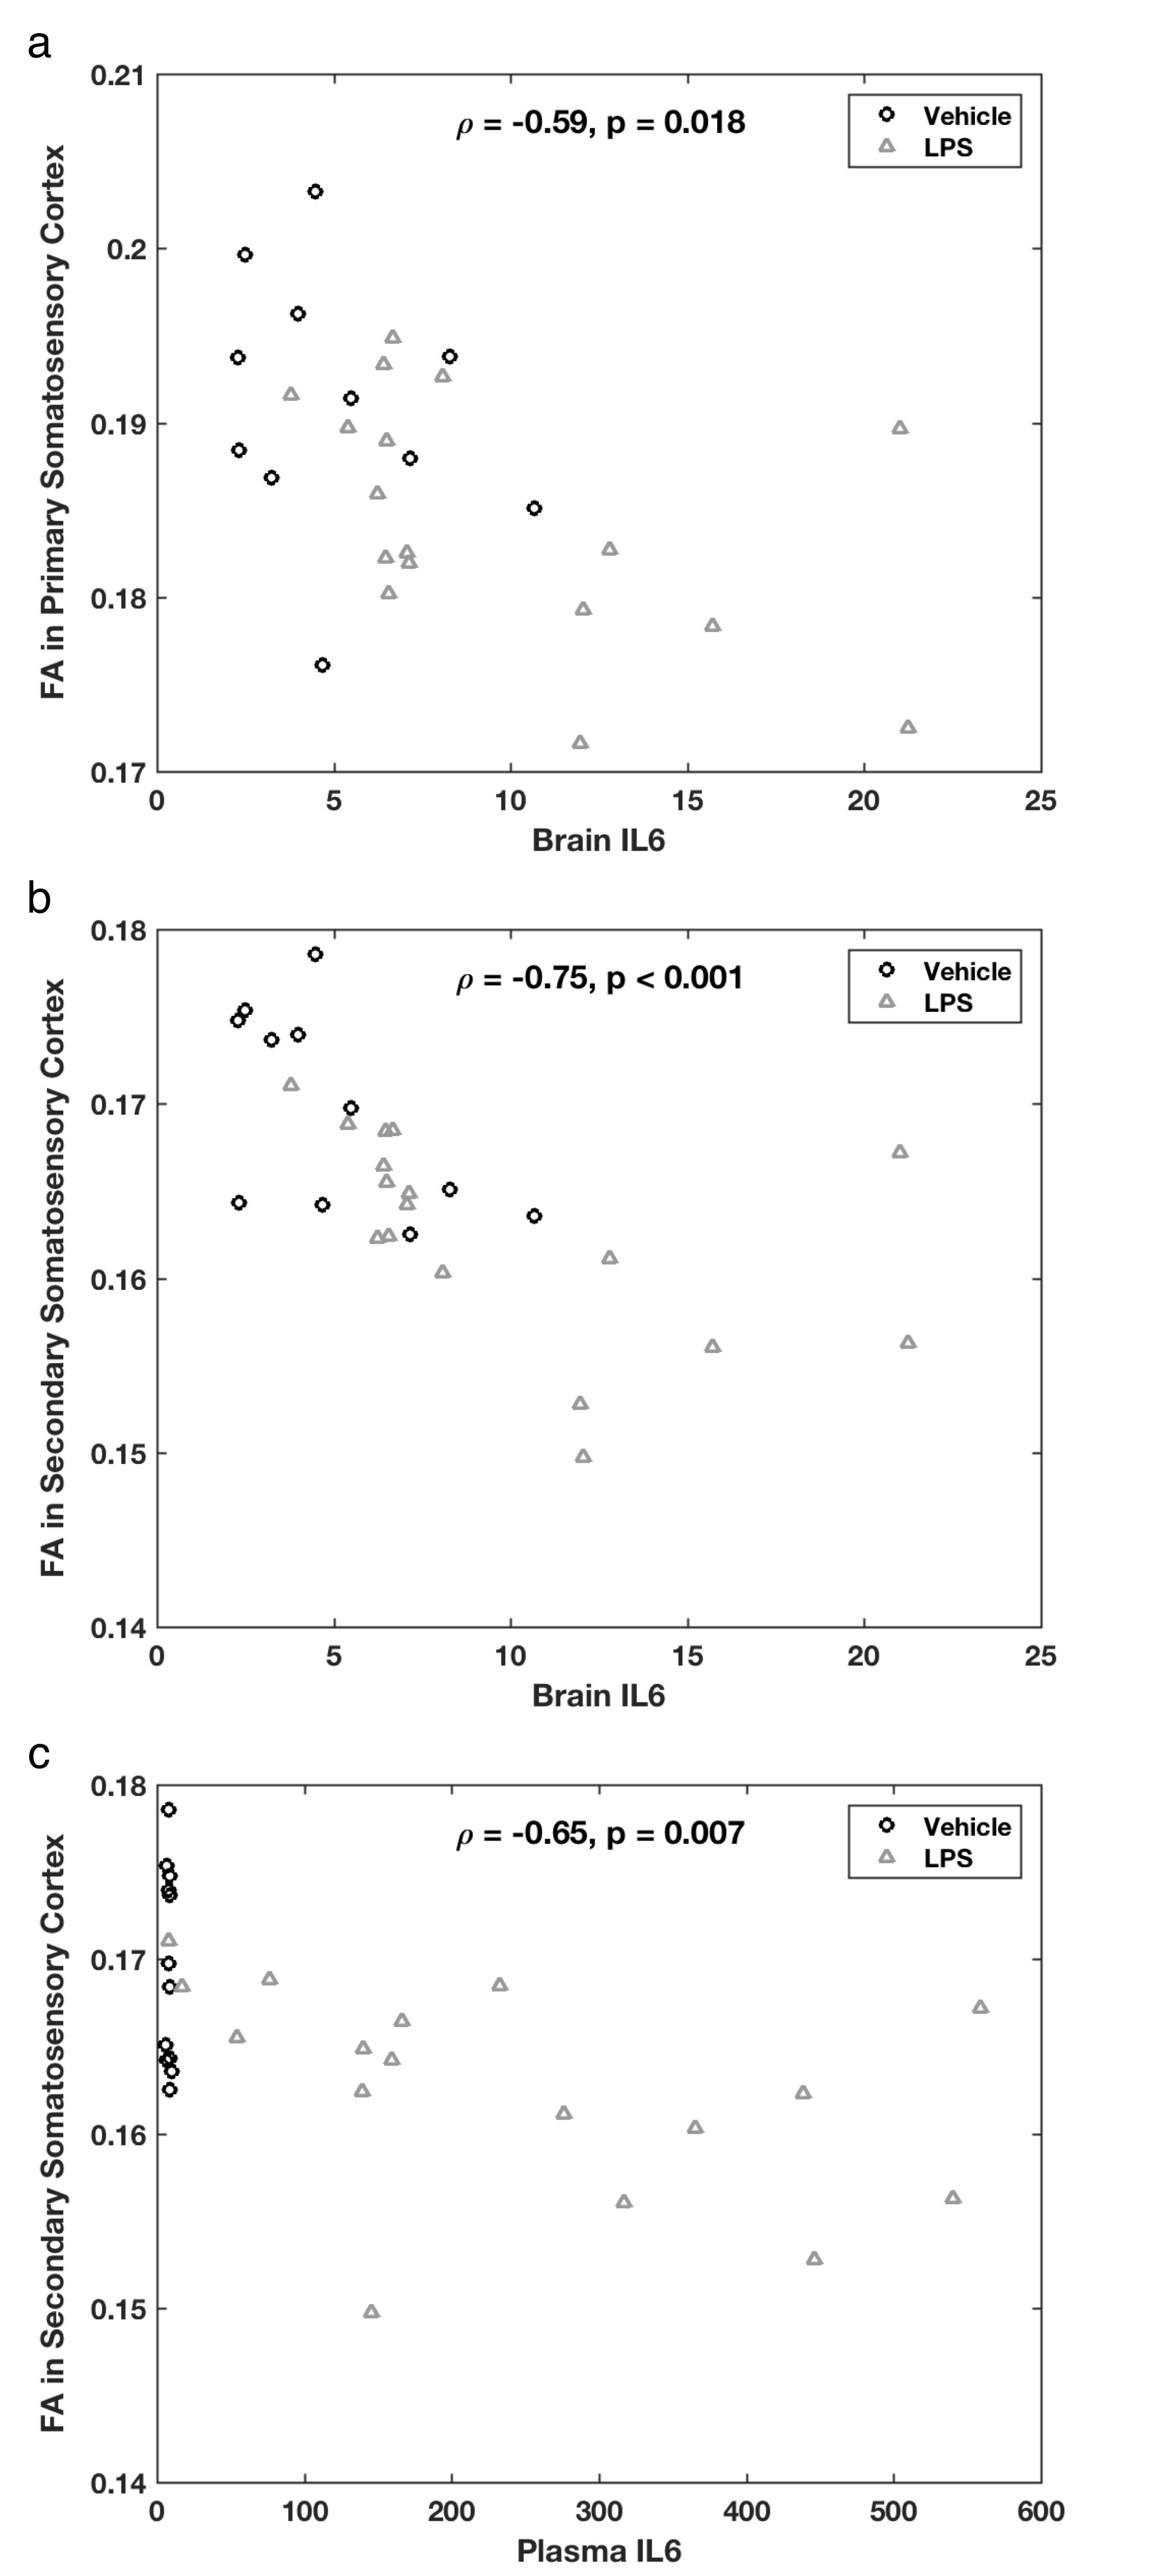
In contrast, all eight non-MRI measures were highly significantly different between the groups (Fig 4). As expected, LPS-treated rats lost 7±2% of pre-treatment body weight and had significantly increased cytokines in the plasma and the brain compared to controls. Interestingly, there were significant negative correlations between FA in the somatosensory cortex and both plasma and brain levels of IL 6 (Fig 5).
Discussion
This study demonstrates the sensitivity of DTI-derived metrics to detect an acute inflammatory response in the brains of rats injected with LPS. The results show subtle yet widespread decreases in FA and accompanying increases in MD in LPS-treated rats vs. controls.
Decreases in FA and increases in MD are normally shown in inflammatory demyelination in both animal models and in human demyelinating diseases including multiple sclerosis9. Interestingly, more recent studies report DTI changes in brain diseases that do not feature overt white matter lesions, but rather low level neuroinflammation and possibly disorganized and pathologically affected white matter. Such diseases include Parkinson’s disease10, obstructive sleep apnea11, and lupus erythematosus12, wherein alterations of water diffusivity in both grey and white matter might be caused by e.g. reactive microgliosis, oedema, blood brain barrier permeability, and infiltration of adhesion molecules, as could be the case in our model.
Conclusion
The ability to detect acute neuroinflammation confirms the notion that DTI metrics are potential sensitive biomarkers of the dynamic changes in the inflamed brain, raising the possibility of utilizing DTI as a non-invasive in vivo assay for therapeutic interventions.Acknowledgements
No acknowledgement found.References
1. Dantzer et al. (2008) Nat Rev Neurosci 9, 46.
2. Westphal et al. (2017) Brain - 28th symposium on cerebral blood flow metabolism and function, Berlin, Germany.
3. Andersson et al. (2003) NeuroImage 20(2):870-888.
4. Smith et al. (2004) NeuroImage 23(S1):208-219.
5. Andersson and Sotiropoulos (2016) NeuroImage 125:1063-1078.
6. Avants et al. (2011) NeuroImage 54(3):2033-44.
7. Valdés-Hernández et al. (2011) Front Neuroinform 5, 26.
8. Winkler et al. (2014) NeuroImage 92:381-397.
9. Wood et al. (2016) PeerJ 4, e2632.
10. Chiang et al. (2017) BMC Neurosci 18:48.
11. Chen at al. (2015) Sleep 38(3):361.
12. Ercan et al. (2015) Neuroimage Clin. 8:337-344.
Figures