5260
Characterisation of microstructural alterations in a weight drop mTBI rat model: a longitudinal diffusion MRI and histological analysis1Medical Imaging and Signal Processing group, UGent, Ghent, Belgium, 2Department of Basic Medical Sciences, UGent, Ghent, Belgium, 3The Centre of Disability and Development Research, Australian Catholic University, Melbourne, Australia
Synopsis
TBI is the leading cause of acquired disability of young adults and due to the subtle nature, conventional scans show no evidence of injury. In this multi-shell longitudinal diffusion MRI study of mTBI in rat brain we found that DKI and white matter metrics can be used to follow up recovery in the brain at least until one week after injury. Moreover, histological analysis showed that changes in the metrics could be explained by inflammation and neurofilament compaction. On the other hand, DTI metrics could not differentiate between the sham and TBI group and were comparable in the two groups.
Introduction
Traumatic brain injury (TBI) is the leading cause of acquired disability in young adults, often caused by traffic accidents or sport injuries1. Mild TBI (mTBI) is the most common type of TBI. While conventional scans (CT or anatomical MRI) show no evidence of injury due to the diffuse and subtle nature of mTBI, the patients can suffer from chronic cognitive defects evens years after their injury. Due to the lack of specificity of DTI metrics for histological features2, the aim of this study is to better characterise microstructural changes with advanced longitudinal diffusion MRI analysis in a mTBI rat model and evaluate whether these findings are supported by histological analysis.Material and methods
Animal model: 20 female Wistar rats weighing 263±12.1g were used in this study. 10 sustained mTBI utilizing the Marmarou-weight-drop-model3, the other 10 received a sham injury. In brief, in anesthetized rats a steel helmet was fixed on the skull 1/3 before and 2/3 behind bregma. The rat was positioned under a 450g brass weight on a foam bed. The weight was dropped from a height of 1m guided through a plexiglass column. The foam bed together with the rat was rapidly removed from the column to prevent a second impact. For the sham animals, the procedure was the same except for the impact.
Imaging and data analysis: MRI data were acquired on a 7T MRI-scanner (PharmaScan, Bruker) before, 1 day, 1 week and 3 months after injury. T2-weighted images were acquired for anatomical reference. Multi-shell diffusion data were acquired with multiple directions/b-values (b=800, 1500 and 2000 s/mm2; 32, 46 and 64 directions). DWI images were corrected for EPI, motion and eddy-current distortions in ExploreDTI 4.8.6.4. Moreover, diffusion kurtosis tensor estimation was performed5 and maps for the diffusion and kurtosis metrics (FA, MD, AD, RD, MK, AK and RK) were calculated6. Maps for white matter metrics (AWF, AxEAD, RadEAD, tortuosity) were calculated based on a white matter diffusion model7. The maps were then co-registered in SPM12 on an anatomical template. Next, a volume-of-interest analysis was performed in the hippocampus, cingulum, cortex and corpus callosum. The Mann-Whitney-U test was performed to investigate changes between two groups. Subsequently, the Friedman test was carried out to investigate the influence of time with a post-hoc analysis using the Wilcoxon-signed-rank test between timepoints. P<0.05 was considered significant.
Histological analysis: Rats were sacrificed for histological analysis and perfused with 4% paraformaldehyde 1 day (n=3), 1 week (n=4) and 3 months (n=12) after impact. Sections of the brain were stained with anti-synaptophysin, Luxol-Fast-Blue, anti-glial fibrillary acidic protein, and anti-neurofilament. Analysis was done by means of colour-deconvolution and k-clustering. The Mann-Whitney-U test was performed to investigate differences between groups. P<0.05 was considered significant.
Results
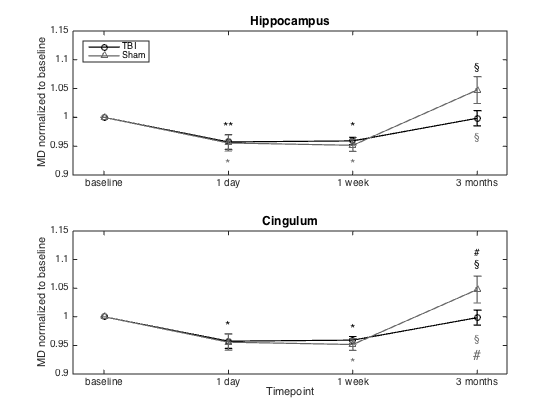
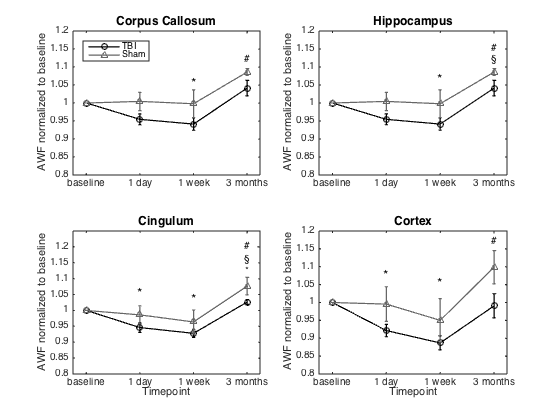
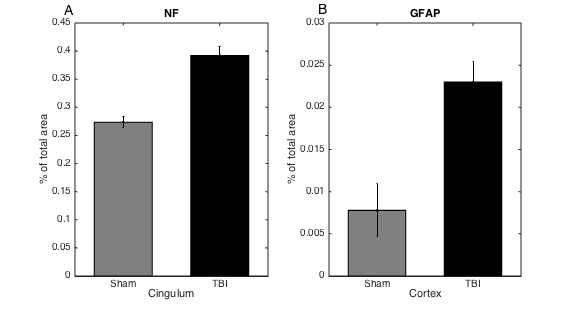
AD, RD and MD showed a significant decrease in the cingulum and hippocampus for both the TBI and sham animals (Figure 1). However, RK showed a significant decrease after one day and one week post injury in the corpus callosum, cingulum and hippocampus only in the TBI group. In the cortex, there was a significant decrease in AK after one week. Additionally, the AWF was significantly decreased in all four ROIs one week after impact, only in the TBI group (Figure 2). Unfortunately, no differences between the two group were found for those metrics on any timepoint. Histological analysis revealed no significant changes, however, there is a near significant increase in NF in the cingulum and GFAP in the cortex one day post injury (p=0.064 and p=0.064, respectively)(Figure 3).Discussion
Longitudinal changes in DKI and white matter metrics can be used to investigate the recovery process in the brain after a mild TBI. These metrics showed a significant decrease in the TBI group, one week after impact. The decrease in diffusion can be explained by extensive swelling of the brain as a result of inflammation and the reduction in kurtosis could indicate a loss of organisation in the microstructure. Furthermore, the general decrease in AWF suggests axonal damage. Indeed, in the cortex there was a near significant increase in GFAP expression 1 day post impact which is associated with inflammation. The increase in NF expression in the cingulum demonstrates a higher amount of dephosphorylated neurofilament, possibly leading to compaction. The longitudinal DTI changes seen in both the TBI and sham group are somewhat unexpected. The hypothesis is that the operation and pain relief have an influence on the DTI metrics. Inclusion of a naïve group should confirm this.Acknowledgements
No acknowledgement found.References
1. Thurman. The Epidemiology of Traumatic Brain Injury in Children and Youths: A Review of Research Since 1990. J Child Neurol. 2016; 31(1):20-27.
2. Jones, et al. White matter integrity, fiber count, and other fallacies: The do's and don'ts of diffusion MRI. NeuroImage. 2013; 73:239-254.
3. Marmarou, et al. A new model of diffuse brain injury in rats Part I: Pathophysiology and biomechanics. J Neurosurg. 1994; 80:291-300.
4. Leemans, et al. ExploreDTI: a graphical toolbox for processing, analyzing, and visualizing diffusion MR data. Proceedings 17th Scientific Meeting, International Society for Magnetic Resonance in Medicine; 2009.
5. Veraart, et al. Weighted linear least squares estimation of diffusion MRI parameters: strengths, limitations, and pitfalls. NeuroImage. 2013; 81:335-346.
6. Veraart, et al. More Accurate Estimation of Diffusion Tensor Parameters Using Diffusion Kurtosis Imaging. MRM. 2011; 65:138-145.
7. Fieremans, et al. White matter characterization with diffusional kurtosis imaging, NeuroImage, 2011; 58(1):177-188.
Figures