5259
Brain microstructure alterations associated to Alzheimer's disease assessed by diffusion tensor and neurite orientation dispersion and density imaging.1Experimental 7T MRI Unit, Institut d'Investigacions Biòmediques August Pi i Sunyer (IDIBAPS), Barcelona, Spain, 2Dept. of Information and Communication Technologies, Universitat Pompeu Fabra, Barcelona, Spain, 3CIBER de Bioingeniería, Biomateriales y Nanomedicina (CIBER-BBN) Group of Biomedical Imaging of the University of Barcelona, Barcelona, Spain
Synopsis
NODDI characterizes neurite orientation dispersion (ODI) and intracellular volume fraction (ICVF), related to neurite density, based on diffusion magnetic resonance imaging. In this study, we have applied NODDI to evaluate excised brains of TgF344-AD, a transgenic rat model of Alzheimer’s disease (AD) and compared them with brains from control rats. Specific brain regions were evaluated: amygdala, caudate putamen, insular cortex and antero-dorsal and posterior hipppocampi. ODI and ICVF shown a different distribution in AD and control rats, with a tendency to higher values in AD, that could not be observed by standard diffusion parameters such as fractional anisotropy (FA).
Introduction
Diffusion magnetic resonance imaging (MRI) can help to understand brain tissue changes associated to Alzheimer’s disease (AD). To disentangle these microstructural changes, diffusion tensor imaging (DTI) and neurite orientation dispersion and density imaging (NODDI)1 were applied to evaluate specific regions in excised brains of a transgenic rat model of AD (TgF344-AD)2 and compared them with control subjects in a range of 18 to 20 months of age. This model was previously analysed to characterize ageing in AD using NODDI3, but comparison with control animals had not been performed until now.Methods
A cohort composed by 7 rats (4 TgF344-AD and 3 control littermates) was considered. Rats were sacrificed between 18 to 20 months of age and brains excised and fixed with paraformaldehyde. MRI scans were performed including T2-weighted and diffusion weighted images. T2-weighted was acquired by a RARE protocol with TR=6000 ms, TE=8.82 ms, voxel size: 0.12x0.12x0.8 mm³ and FoV 30x30x32 mm³. Diffusion weighted acquisition was performed using a two-shell protocol optimized for NODDI3, including two b-values: 1000 s/mm² and 3000 s/mm² with 60 gradient directions per shell and 5 baseline images with b-value=0 s/mm², voxel size: 0.16x0.16x0.25 mm³ and FoV=22x15x27 mm³. Diffusion tensors and fractional anisotropy (FA) were computed using Dipy4. NODDI model was fit to the data using the matlab NODDI toolbox1. The intracellular and isotropic diffusivity were set to 0.6x10⁻³ mm²/s and 2x10⁻³ mm²/s for ex-vivo tissues3. Orientation dispersion index (ODI), intracellular volume fraction (ICVF, which has been related with neurite density) and isotropic volume fraction (ISOF) were computed at each voxel.
Automatic parcellation was performed by registration with an atlas of the rat brain5 to the subject T2-weighted image, and from it to its diffusion volume. Regions of interest (ROIs) that have been related with AD were selected for further analysis: amygdala, insular cortex, caudate putamen and anterodorsal and posterior hippocampus. The distribution of FA and NODDI parameters in these regions in transgenic and control rats were compared.
Results
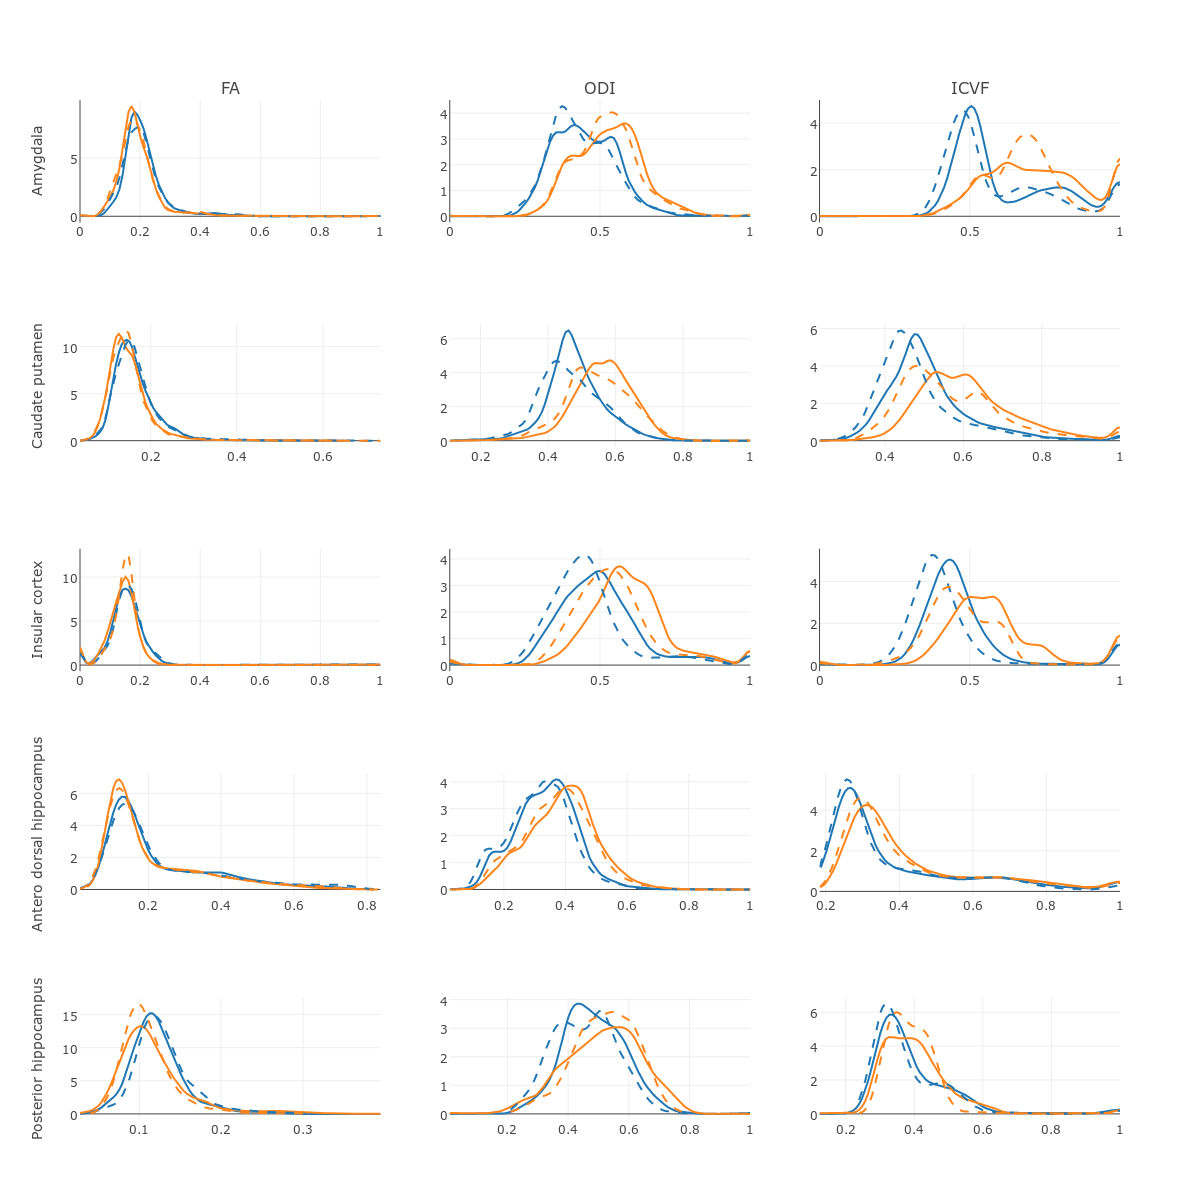
Figure 1 shows the distribution of FA, ODI and ICVF in the ROIs in control and transgenic groups. ISOF values are not shown since no differences were observed in any of the ROIs. Distribution of FA was similar in cases and controls in all ROIs except posterior hippocampus, where a trend to lower FA values can be observed in the transgenic rats with respect to controls. ODI showed a tendency to higher values in AD in all the regions. An increase in ICVF values was also observed in AD rats, more notable in amygdala, insular cortex and caudate putamen than in the two analysed hippocampal regions.
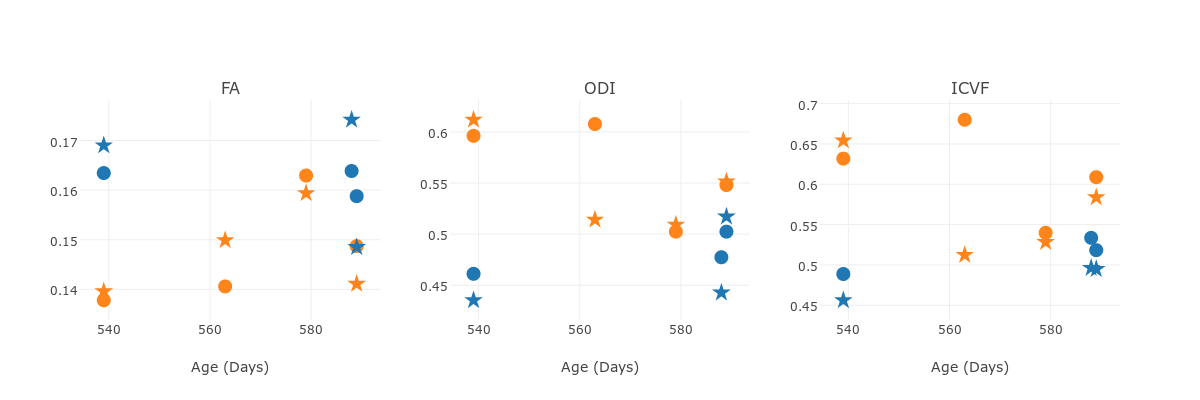
Figure 2 shows the average value with respect to the age at which the animal was sacrificed in the caudate putamen region, where it can be seen that in this cohort and range of ages, AD has higher impact in the diffusion values than differences in ageing. A similar pattern was observed in the other regions.
Discussion
Alterations in microstructural properties associated to AD were observed in specific regions by diffusion metrics. NODDI showed to be more sensitive to brain tissue alterations than FA, which only had different distribution between AD and control rats in the posterior hippocampus, while a tendency to higher values of ODI and ICVF in the transgenic rats in was observed in all the ROIs. FA values in a voxel are affected by different factors such as axonal organization and orientation dispersion and differences in the percentage of volume in the voxel occupied by neurites1. These two factors are related with ODI and ICVF respectively, but simultaneous changes in both of them could not be detected by FA. This can explain why the higher values of ODI and ICVF in transgenic rats observed in our experiments were not translated to differences in FA.
Increases in ODI and ICVF have been associated to ageing in TgF344-AD3, what could be related with the higher values of these parameters in the transgenic group observed in our experiments. Similarly, in a transgenic mice model of AD higher ICVF in cortex and hippocampus were correlated to higher percentage of tau burden in a cohort of 5 transgenic mice6.
Conclusion
Parameters derived from NODDI models provided information about differences in brain regions affected by AD that can disentangle microstructural alterations undetectable by conventional metrics such as FA. Therefore, NODDI can contribute to the understanding of changes associated to AD.
Although our experiments were performed ex-vivo, NODDI is suitable for in-vivo acquisition, which could contribute to the development of non-invasive biomarkers of AD.
Acknowledgements
This work has been funded by the project PI14/00595, integrated in the Plan Nacional I+D+I and co-funded by ISCIII-Subdirección General de Evaluación and European Regional Development Fund (ERDF); and by the Fundació La Marató de TV3 (201441 10). CIBER-BBN is an initiative financed by the Instituto de Salud Carlos III with assistance from the European Regional Development Fund. We are indebted to the Experimental MRI 7T Unit of the IDIBAPS.References
1. Zhang H, Schneider T, Wheeler-Kingshott, CAG and Alexander DC. NODDI: Practical in vivo neurite orientation dispersion and density imaging of the human brain. NeuroImage 2012; 61:1000–1016.
2. Cohen RM, Rezai-Zadeh K, Weitz TM et al. A transgenic Alzheimer rat with plaques, tau pathology, behavioral impairment, oligomeric Aβ and frank neuronal loss. J. Neurosci. 2013; 33:6245–6256.
3 Fick R, Daianu M, Pizzolato M et al. Comparison of biomarkers in transgenic Alzheime rats using multi-shell diffusion MRI. Proccedings of MICCAI 2016 Workshop on Computational Diffusion MRI (CDMRI’16).
4. Garyfallidis E, Brett M, Amirbekian B et al. Dipy, a library for the analysis of diffusion MRI data. Front. Neuroinform. 2014; 8:8
5. Schwarz AJ, Danckaert A, Reese T et al. A stereotaxic MRI template set for the rat brain with tissue class distribution maps and co-registered anatomical atlas: application to pharmacological MRI. NeuroImage, 2006; 32:538–550
6. Colgan N, Siow B, O’Callaghan JM, et al. Application of neurite orientation dispersion and density imaging (NODDI) to a tau pathology model of Alzheimer’s disease. Neuroimage 2016; 125:739–744.
Figures