5257
Diffusion Tensor Imaging to Investigate Diet-induced Changes in Neuronal Tissue Microstructure and Organization1Biomedical Engineering, University of Wisconsin-Madison, Madison, WI, United States, 2Medical Physics, University of Wisconsin-Madison, Madison, WI, United States, 3Radiology, University of Wisconsin-Madison, Madison, WI, United States, 4Neuroscience, University of Wisconsin-Madison, Madison, WI, United States, 5Psychiatry, University of Wisconsin-Madison, Madison, WI, United States
Synopsis
Altered gut microbiome populations are associated with a broad range of neurodevelopmental disorders. Disruption of the gut microbiome via dietary intake has been shown to influence brain function and behavior in animal models. Utilizing diffusion tensor imaging we identified global changes in white matter structural integrity occurring in a diet-dependent manner. Subsequent diet-crossover experiments demonstrate the varying permanence of these diet-induced changes and the degree of plasticity associated with these changes. These studies allow us to further explore our understanding of the gut-brain-microbiota axis by revealing possible links between altered and dysbiotic gut microbiome populations and changes in brain structure.
Introduction:
Alterations in gut microbiome composition have been associated with several neurodevelopmental and psychiatric disorders1. In animal models, modifications of gut microbiome populations through dietary manipulation influence brain function and behavior, and have been shown to influence behavioral symptoms2-6. With striking differences in microbiome-driven behavior, we employed diffusion tensor imaging (DTI) to explore whether these behavioral changes are also accompanied by corresponding changes in neural tissue microstructure.Methods:
Male rats were assigned to one of four purified and irradiated diets: a control diet, a high-fat diet, a high-fiber diet, and a high-protein diet. Animals were fed the experimental diets immediately post-weaning for a total of 21 days. At post natal day (PND) 42, animals from each diet cohort (total n=20, n=5 per diet group, PRE) were sacrificed and brains dissected. The remaining animals (total n=24, n=6 per diet group, POST) were crossed over and remained on the control diet for an additional 21 days, whereupon the brains were isolated in a similar fashion. Brains were ex-vivo imaged and following standard preprocessing, tensors were reconstructed, registered, and normalized to a population-specific template. Tract-based spatial statistics (TBSS) were computed to evaluate whole-brain voxel-wise differences along standard diffusion tensor indices; permutation test results were considered significant at the α<0.05 level after family-wise error correction.Results:
To uncover diet-induced changes in neural tissue microstructure, ex-vivo whole brain DTI was performed followed by a voxel-wise TBSS analysis on samples from both the PRE and POST diet groups. Figure 1 shows the TBSS experimental design; PRE diet group analysis (fig. 1a), POST diet group analysis (fig. 1b), and PRE-POST diet groups analysis (fig. 1c). Statistically significant differences in fractional anisotropy (FA), axial diffusivity (AD), radial diffusivity (RD), and trace (TR; trace: mean diffusivity [MD] x3) were identified. Figure 2 reveals substantial areas of differing FA, TR, and AD values for the high-fat diet group (B1:A1) principally concentrated in the neocortex and external capsule. Additionally, animals on the high-fiber diet (C1:A1) showed statistically significantly higher TR and AD in the hypothalamus, internal capsule, and brainstem, and statistically lower AD and RD values in the neocortex. Animals on the high-protein diet (D1:A1) demonstrated increased FA and RD in both the neocortex and cerebellum. TBSS analysis performed on POST animals also reveal widespread areas of increased FA, TR, AD, and RD in the high-fat group (B2:A2), which were found largely throughout the forebrain (fig. 3). Surprisingly, animals crossed over from the high-fiber diet (C2:A2) demonstrated tremendous changes in the diffusion tensor with widespread and global changes in the diffusion tensor with decreased FA, TR and AD, and increased RD that stand in stark contrast to the minimal changes see in the high-fiber PRE group (C1:A1). While no significant differences in FA and AD were identified in the POST high-protein group (D2:A2), statistically significant decreased TR and RD values were observed throughout the brainstem. Results for PRE-POST diet groups, shown in figure 4, reveal areas with differing FA and increased RD values in the neocortex and external capsule for the POST high-fat group (B2:B1). Significant TR, AD, and RD differences are showed in the case of high-fiber diet (C2:C1). Confluent TR and AD high values are present at the neocortex, external capsule, corpus callosum, and brainstem POST crossover. Increased RD is observed in the rest of the midbrain, inferior colliculus, and central gray. Lastly, the high-protein group (D2:D1) shows increased TR, AD, and RD values at the neocortex, external capsule, rest of the midbrain, and brainstem POST crossover; along with confluent increased TR and RD at the corpus callosum.Summary & Discussion:
The mechanism through which the gut microbiome exerts its effects on the central nervous system (CNS) is multifactorial (neural, endocrine, and immunologic) but is thought to largely occur via the generation of bacterial metabolites, which exert their physiologic effects both locally and systemically. Short-chain fatty acids (SCFA), produced by the bacterial fermentation of dietary carbohydrates, alter neuronal excitability and gut bacteria also manufacture a wide spectrum of neuroactive compounds that include dopamine, γ-aminobutyric acid, histamine, acetylcholine and tryptophan, a precursor in the biosynthesis of serotonin7,8. The results of our work extend and build upon these findings by uncovering changes in white matter structural integrity via differing DTI metrics that may be linked to diet-influenced gut microbiome populations. Our method for uncovering potential links between gut microbiome populations and brain structural changes can help guide important new experiments to study how these microbiome populations impact the CNS beyond transiently modulating the presence and flux of neuroactive molecules and compounds.Acknowledgements
This work is supported under NIH awards UL1TR000427 and TL1TR000429. The content is solely the responsibility of the authors and does not necessarily represent the official views of the National Institutes of Health.References
- Rogers G. B., Keating D. J., Young R. L., et al. From gut dysbiosis to altered brain function and mental illness: mechanisms and pathways. Molecular Psychiatry.2016;21(6):738–748.
- Liu Z., Patil I. Y., Jiang T., et al. High-fat diet induces hepatic insulin resistance and impairment of synaptic plasticity. PLoS ONE.2015; 10(5).
- Kaptan Z., Akgün-Dar K., Kapucu A., et al. Long term consequences on spatial learning-memory of low-calorie diet during adolescence in female rats; Hippocampal and prefrontal cortex BDNF level, expression of NeuN and cell proliferation in dentate gyrus. Brain Research.2015;1618: 194–204.
- Buffington S. A., Di Prisco G. V., Auchtung T. A., et al. Microbial Reconstitution Reverses Maternal Diet-Induced Social and Synaptic Deficits in Offspring. Cell.2016; 165: 1762–1775.
- Schafer D. P., & Stevens B. Phagocytic glial cells: Sculpting synaptic circuits in the developing nervous system. Current Opinion in Neurobiology.2013; 23:1034-1040.
- Rogers G. B., Keating D. J., Young R. L., et al. From gut dysbiosis to altered brain function and mental illness: mechanisms and pathways. Molecular Psychiatry. 2016; 21: 738–748.
- Nohr M.K., Egerod K.L., Christiansen S.H., et al. Expression of the short chain fatty acid receptor GPR41/FFAR3 in autonomic and somatic sensory ganglia. Neuroscience. 2015; 290: 126–137.
- Barrett E., Ross R.P., O’Toole P.W., et al. Gamma-Aminobutyric acid production by culturable bacteria from the human intestine. J Appl Microbiol. 2012; 113: 411–417.
Figures
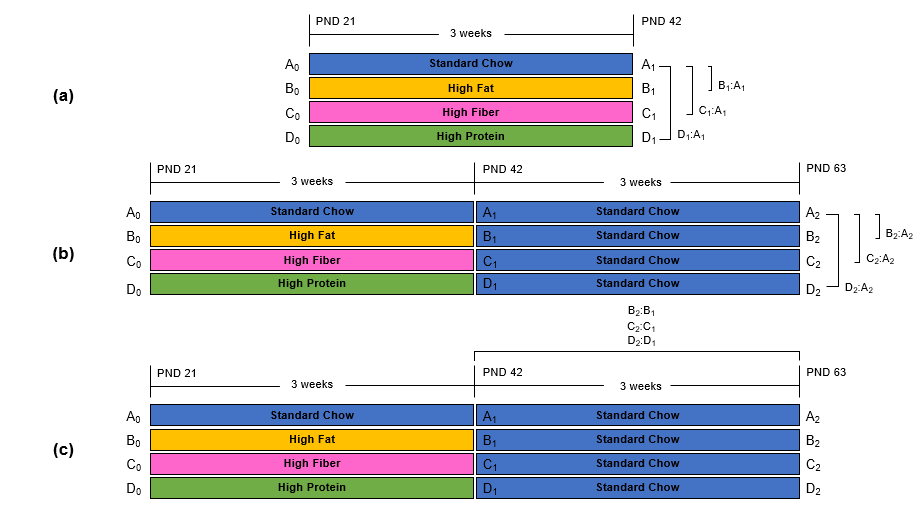
Figure 1. TBSS: Experimental Design.
Voxel-wise TBSS analysis was performed between animals on the control diet and those on either a high-fat, high-fiber, or high-protein diet at (a) PND 42 (PRE diet group) and (b) PND 63 (POST diet group). (c) In addition, a TBSS analysis was completed between animals on the PRE diet group (PND 42) and those on the POST diet group (PND 63).
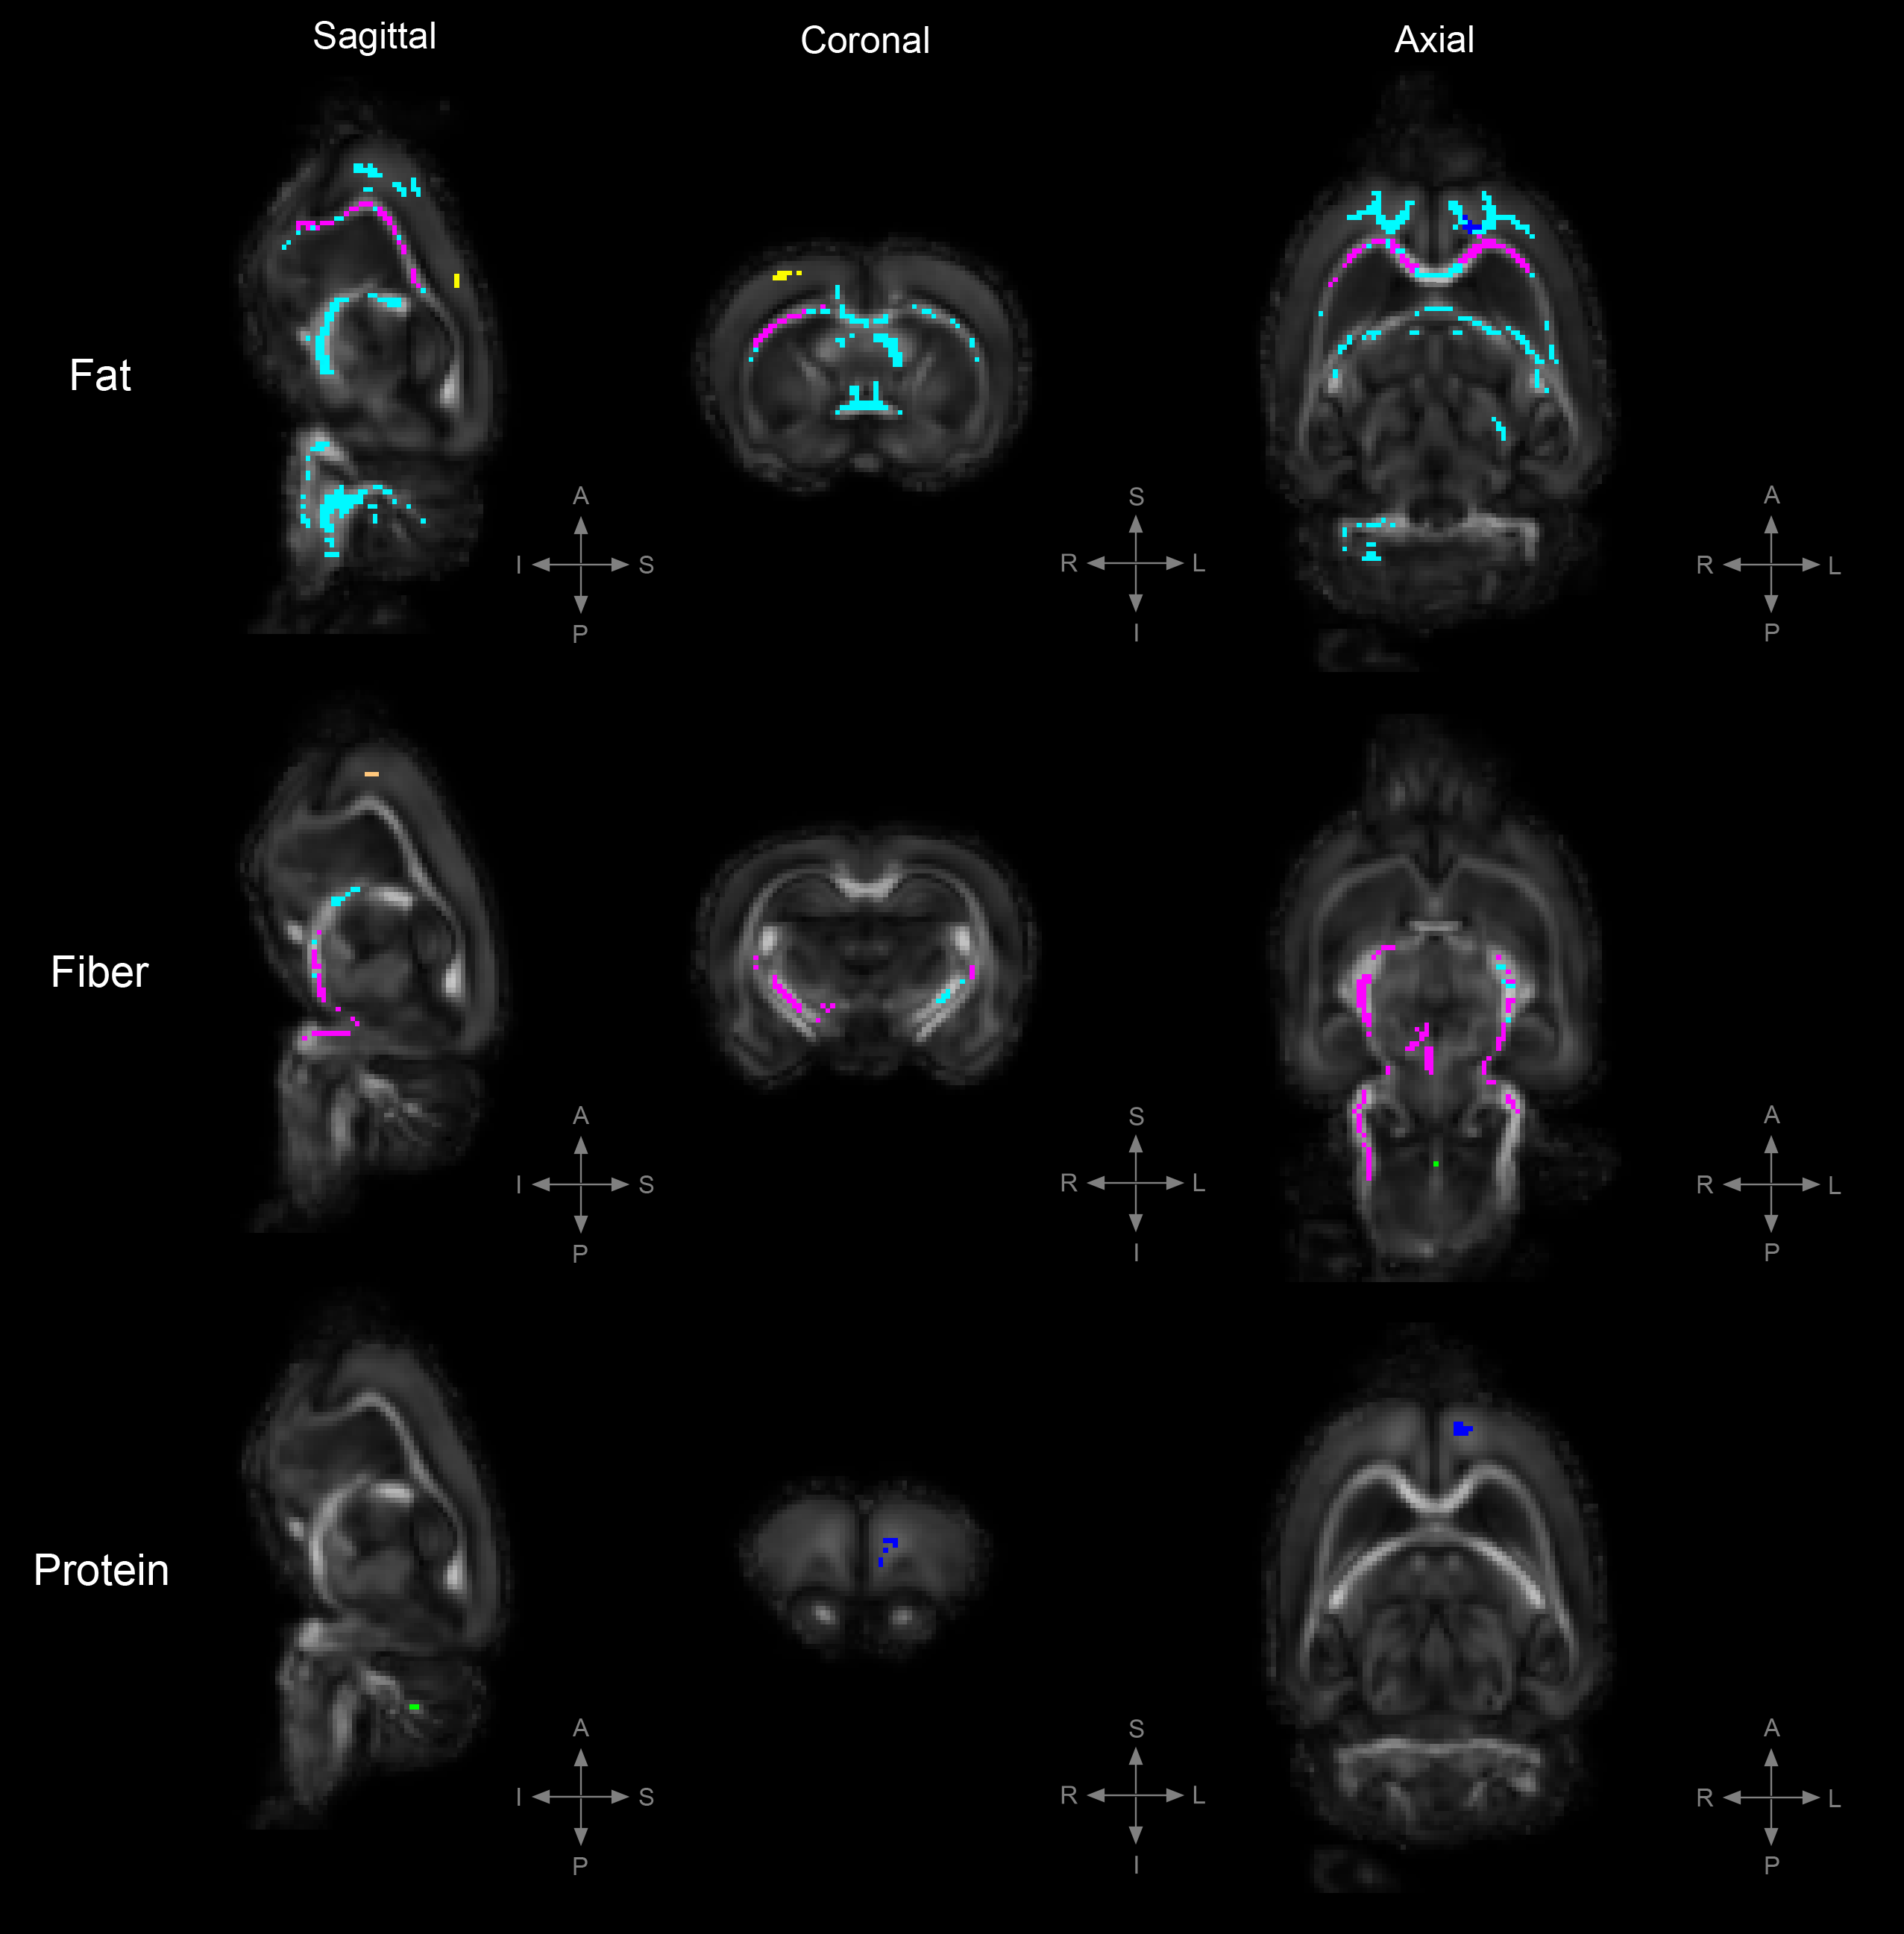
Figure 2. TBSS: Statistically significant DTI differences in PRE crossover diet group.
Statistically significant differences in fractional anisotropy (FA), axial diffusivity (AD), radial diffusivity (RD), and trace (TR; trace: mean diffusivity [MD] x3) between animals on the control diet and those on either a high-fat, high-fiber, or high-protein diet (family-wise error corrected, α<0.05). Decreased FA= yellow, increased FA= blue, decreased AD= red, increased AD= light-blue, decreased RD= cooper, increased RD= green, increased TR= magenta.
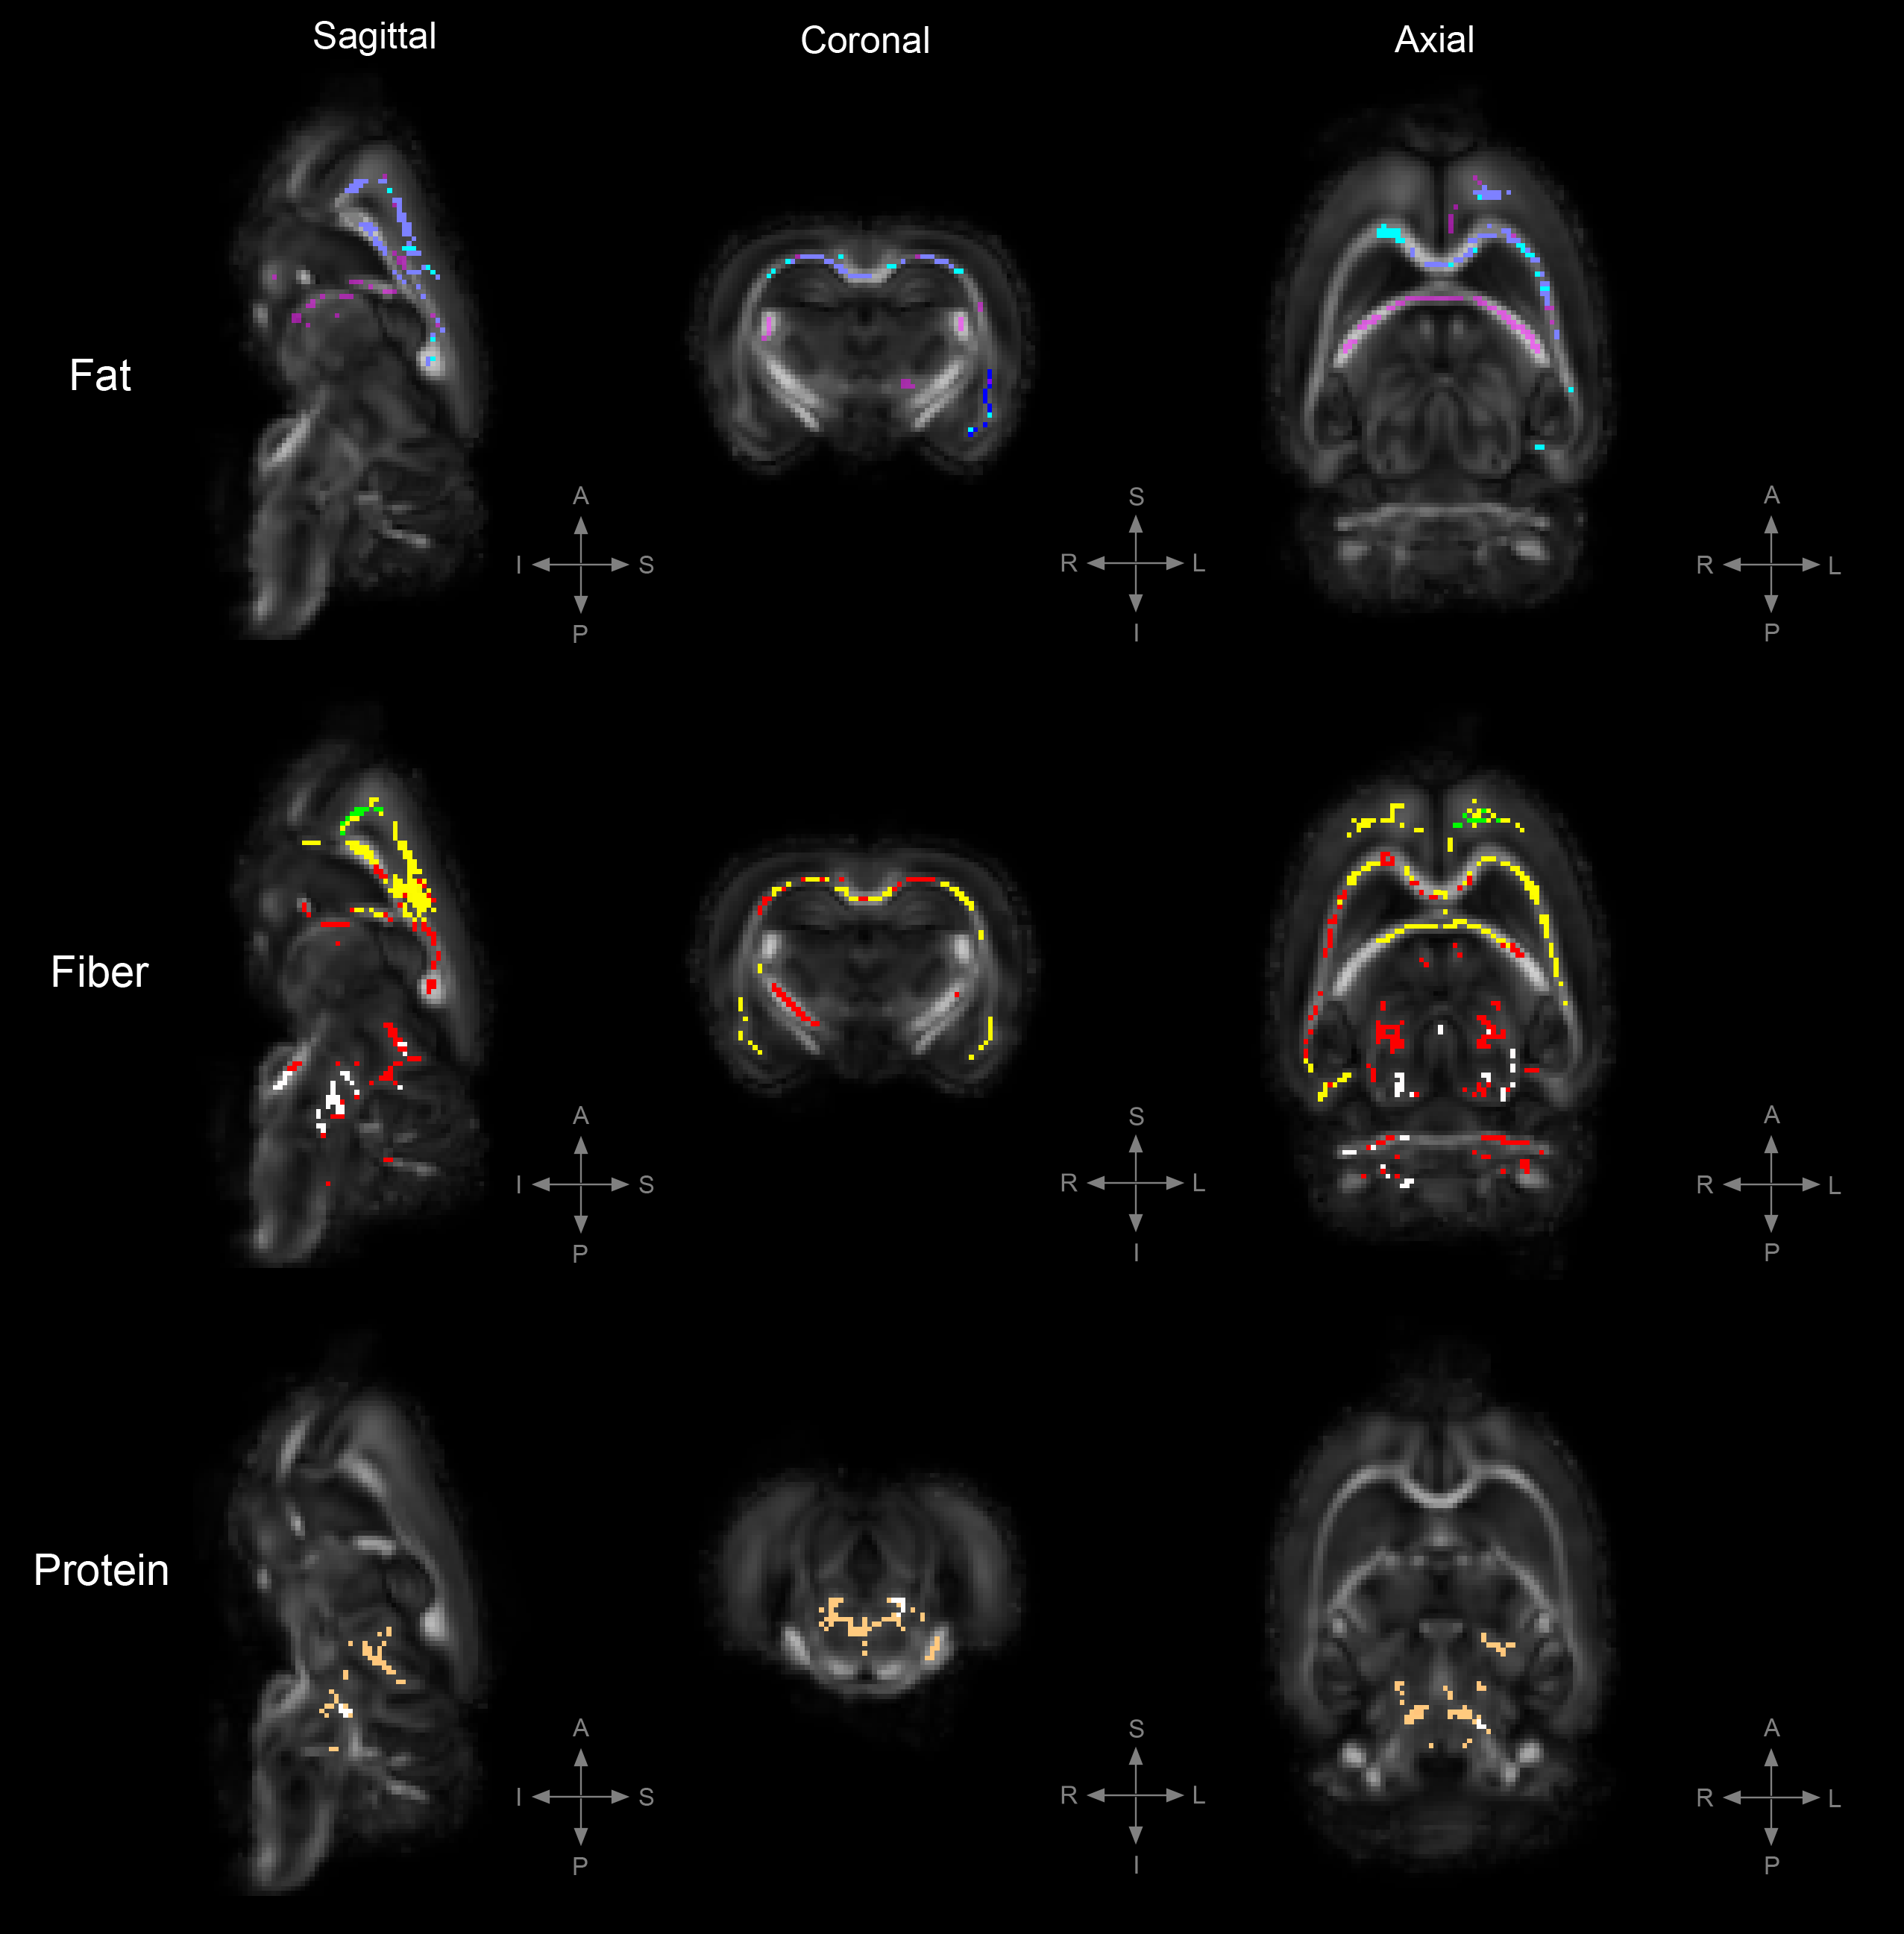
Figure 3. TBSS: Statistically significant DTI differences in POST crossover diet group.
Statistically significant differences in fractional anisotropy (FA), axial diffusivity (AD), radial diffusivity (RD), and trace (TR; trace: mean diffusivity [MD] x3) between animals on the control diet and those on either a high-fat, high-fiber, or high-protein diet (family-wise error corrected, α<0.05). Decreased FA= yellow, increased FA= blue, decreased AD= red, increased AD= light-blue, decreased RD= cooper, increased RD= green, decreased TR= white, increased TR= magenta.
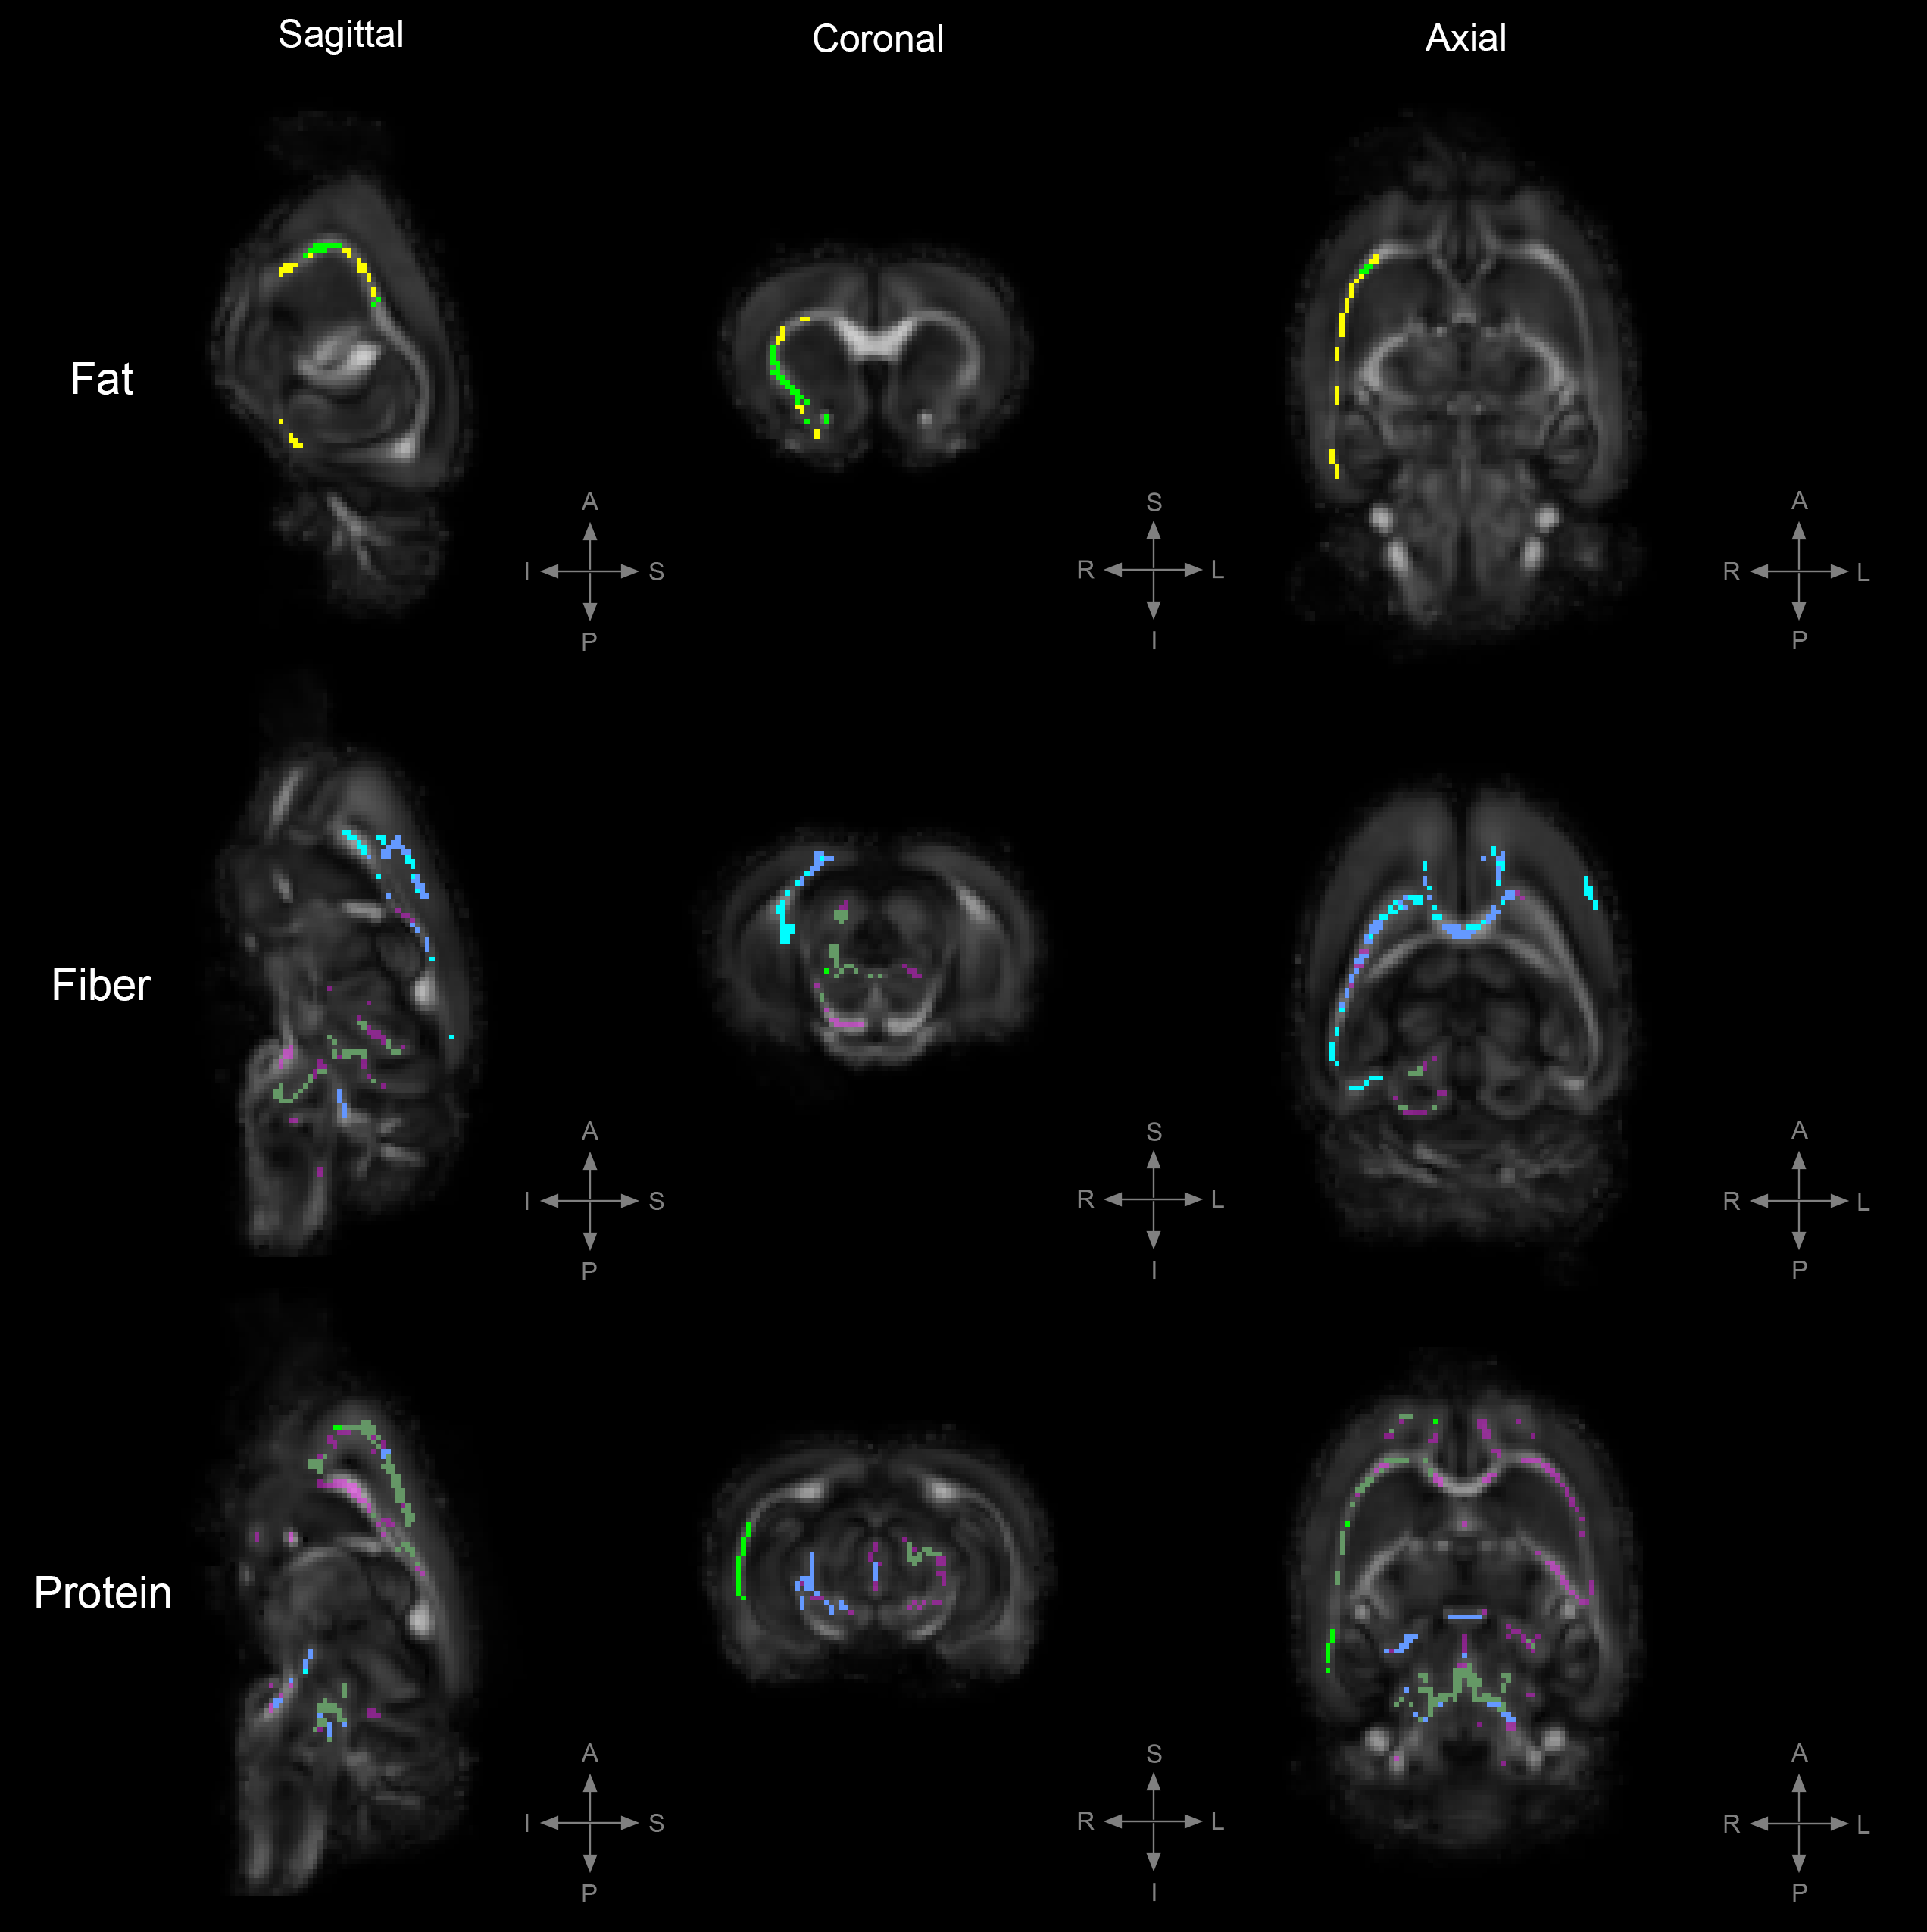
Figure 4. TBSS: Statistically significant DTI differences between PRE-POST diet groups.
Statistically significant differences in fractional anisotropy (FA), axial diffusivity (AD), radial diffusivity (RD), and trace (TR; trace: mean diffusivity [MD] x3) between animals on the PRE diet group and those on the POST diet group; either in a high-fat, high-fiber, or high-protein diet (family-wise error corrected, α<0.05). Results are showed with respect to the POST diet groups; decreased FA= yellow, increased AD= light-blue, increased RD= green, increased TR= magenta.