5256
Microstructure-mesh projection: Combining shape analysis with diffusion MRI models1USC Mark and Mary Stevens Neuroimaging and Informatics Institute, University of Southern California, Los Angeles, CA, United States
Synopsis
The hippocampus is a heterogeneous structure consisting of subfields with distinct cytoarchitectonic and connectivity patterns. In order to capture the complexity of hippocampal structure, we propose a framework that combines the localized specificity of shape analysis with the microstructural sensitivity obtained with diffusion MRI models. The microstructure-mesh projection pipeline projects local model parameters within the hippocampus onto the surface to enable visualization and analysis of regional microstructural features. In a pediatric dataset, regional patterns of microstructural maturation within the hippocampus were observed.
Introduction
The hippocampal formation is a complex subcortical structure critical for learning and memory and is implicated in a wide variety of neurological and developmental disorders1. The hippocampus consists of subfields with distinct cytoarchitectonic and connectivity patterns and includes the subiculum, cornu ammonis (CA) 1-4 and dentate gyrus (DG). Due to the heterogeneity within hippocampal structure, analytical approaches sensitized to regional morphological changes may provide a more nuanced understanding of the relationship between hippocampal structure and behavior. Shape analysis techniques provide enhanced sensitivity to regionally-specific surface deformations in development2,3 and diseased states4. Recent advances in diffusion MRI have led to the development of microstructural models, such as neurite orientation dispersion and density imaging (NODDI)5, sensitized to specific anatomical features. Here, we present a framework to combine the localized specificity of shape analysis with the microstructural sensitivity obtained with diffusion MRI (dMRI) models to enable researchers to: (1) visualize regional microstructural patterns on the surface of the hippocampus and (2) analyze changes in local hippocampal microstructure. We then show how this method is implemented and provide an example application in child development.Methods
MRI scans from 119 cross-sectional typically development children between 0.1 and 18.8 years (7.9±4.8, 62 F) were used from the Cincinnati MR Imaging of NeuroDevelopment (C-MIND) study (https://cmind.research.cchmc.org/). One T1-weighted (T1w) MPRAGE scans (voxel size: 1 mm isotropic; FOV: 256x224x160 mm; TI: 939 ms; TR/TE: 8.1/3.7 ms) and 2 dMRI scans (voxel size: 2 mm isotropic; acquisition matrix: 112x109; 61 gradient-encoding directions with 7 B0 images (averaged). Scan 1: b=1000 s/mm2; TR/TE=6614/81 ms. Scan 2: b=3000 s/mm2; TR/TE=8112/104 ms.) were acquired per subject. Due to differences in TR/TE, each scan was normalized by the b=0 volume of the other acquisition. Neurite density index (NDI) and orientation dispersion index (ODI) were calculated using the NODDI Matlab Toolbox5, and the resulting maps were registered to the subject T1w space.
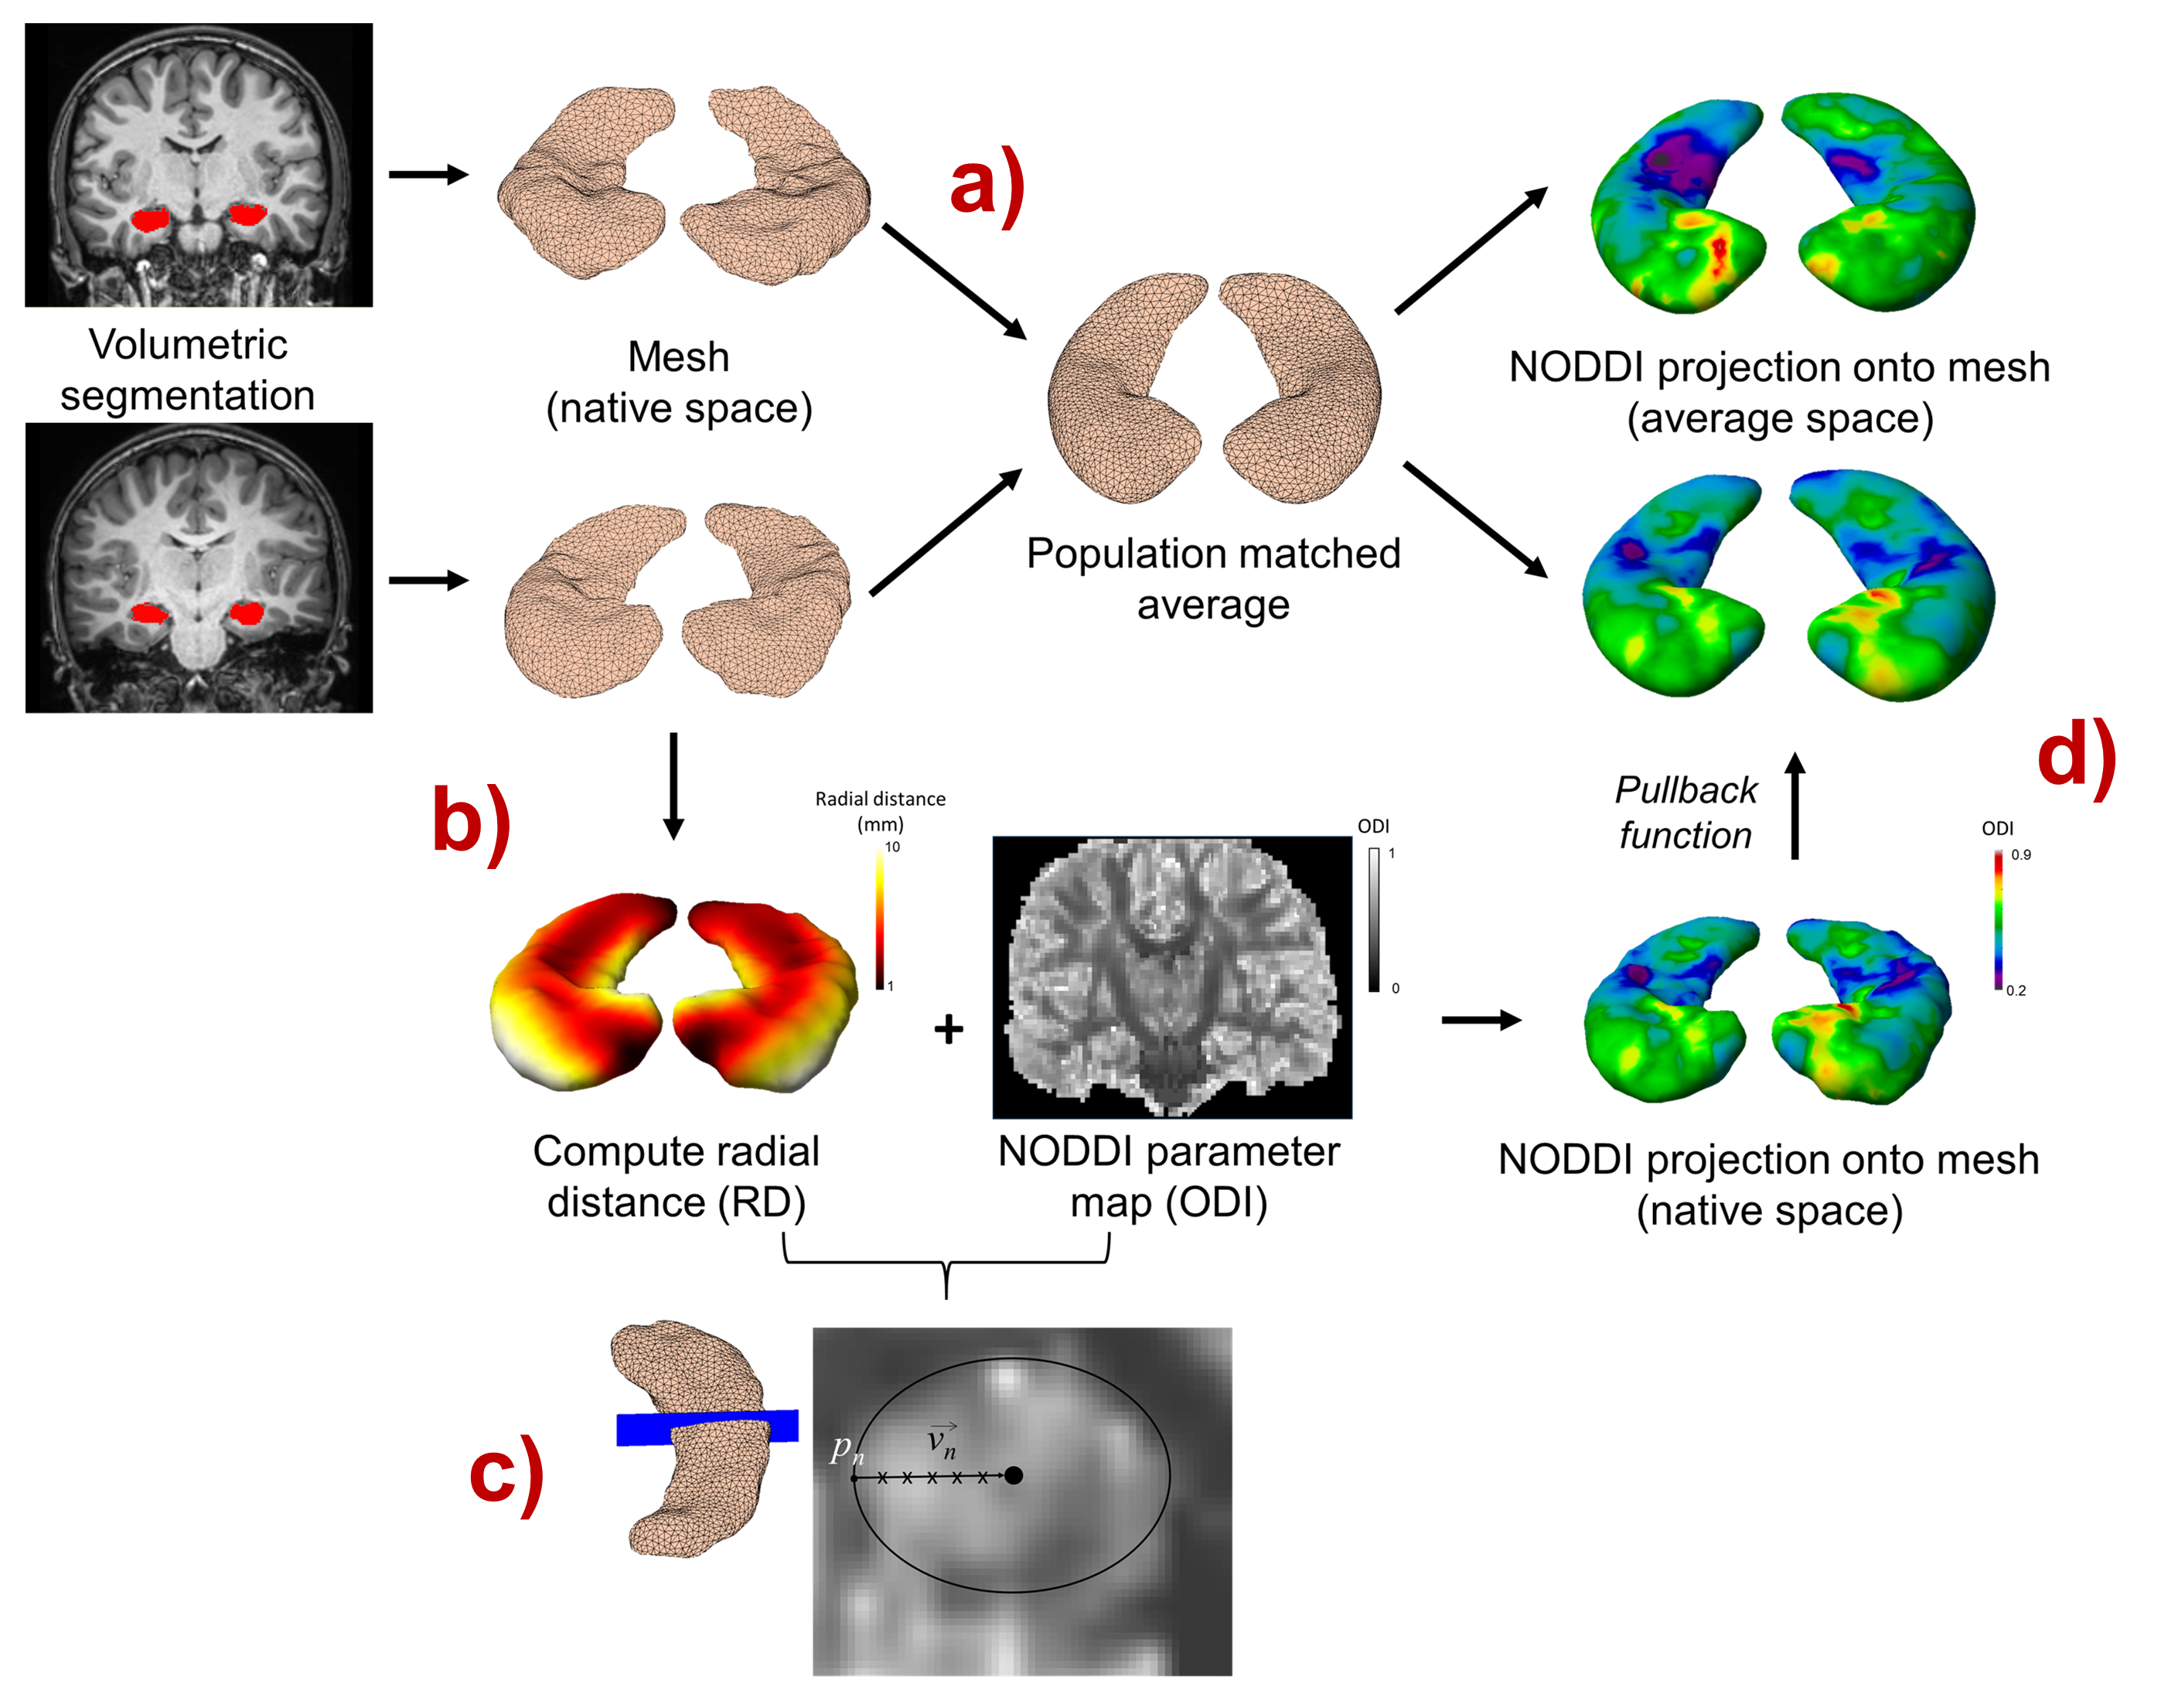
Shape analysis was performed using Metric Optimization for Computational Anatomy (MOCA) software6,7, which aligns anatomical features onto brain surfaces using Laplace-Beltrami eigen-functions in high-dimensional embedding space. The radial distance (RD), defined by the shortest distance from the surface to the longitudinal core, was measured at each vertex. For a given vertex, each dMRI parameter was interpolated along 5 equidistant points along the RD vector directed towards the core and the average value was used as the surface feature. An overview of the microstructure mesh projection pipeline is shown in Figure 1. Age-related changes in hippocampal microstructure were then analyzed using general linear models, and clusters were identified using random field theory8,9. The model controlled for the effects of sex and intracranial volume (ICV).
Results
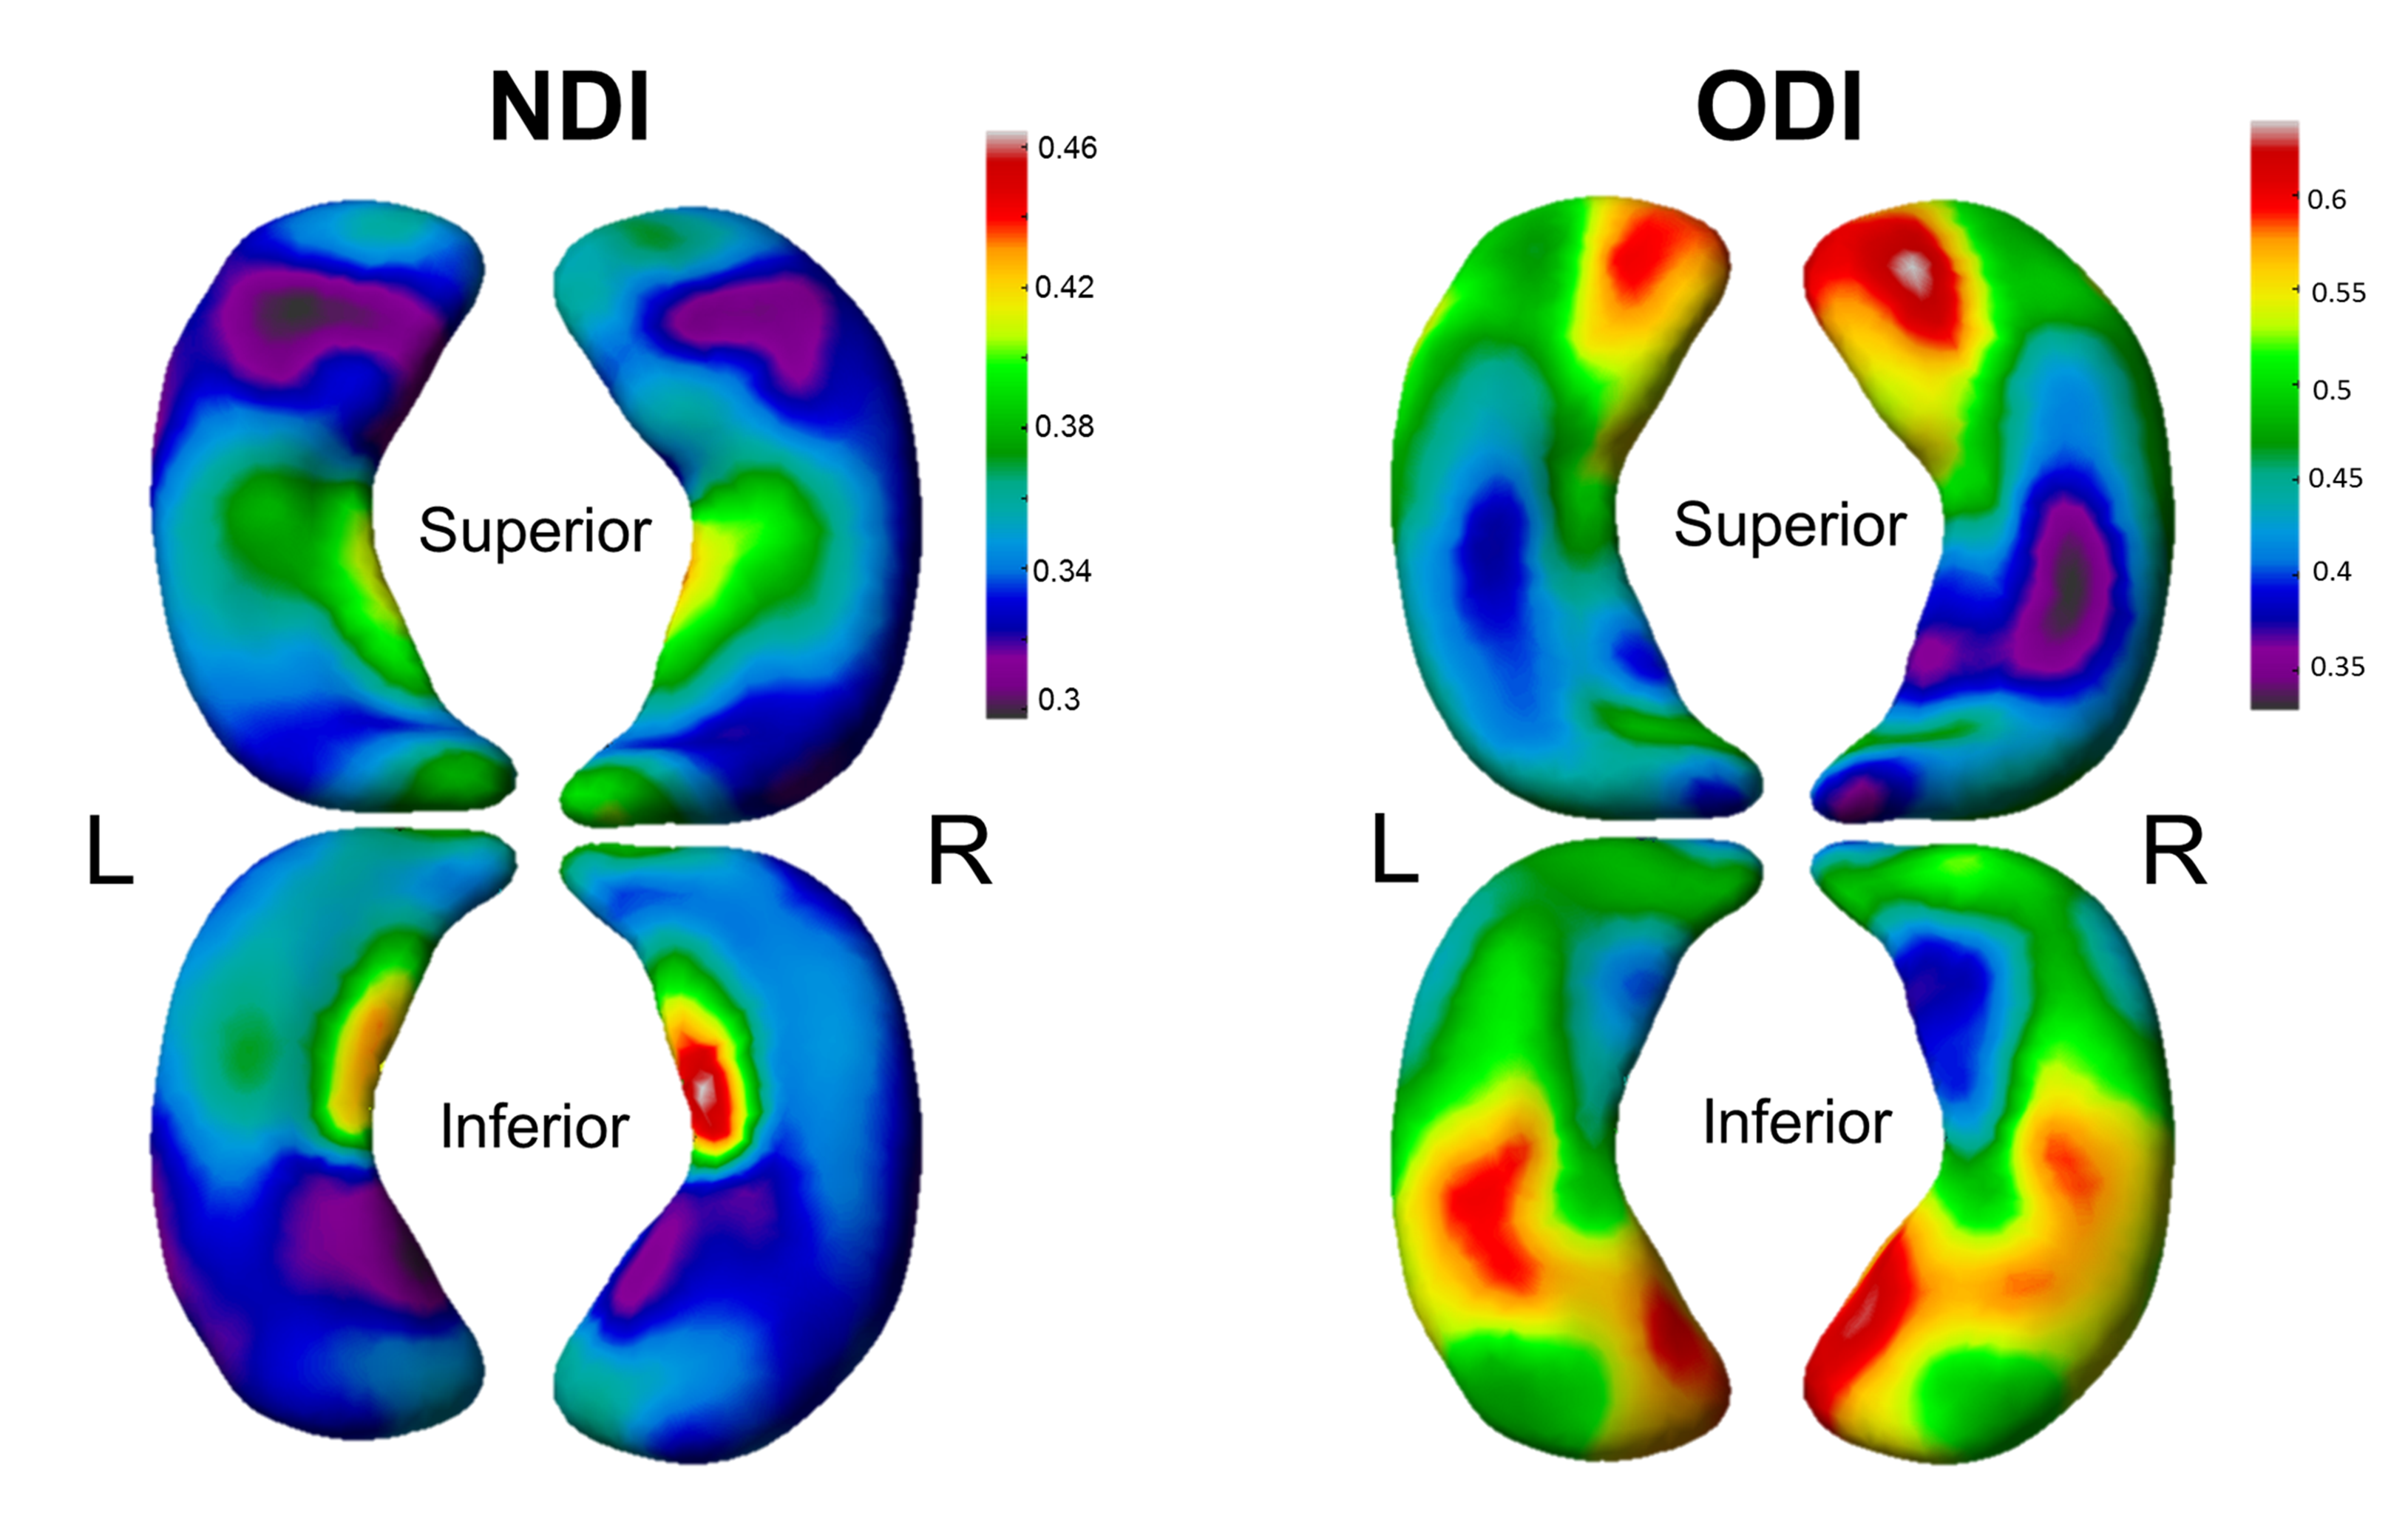
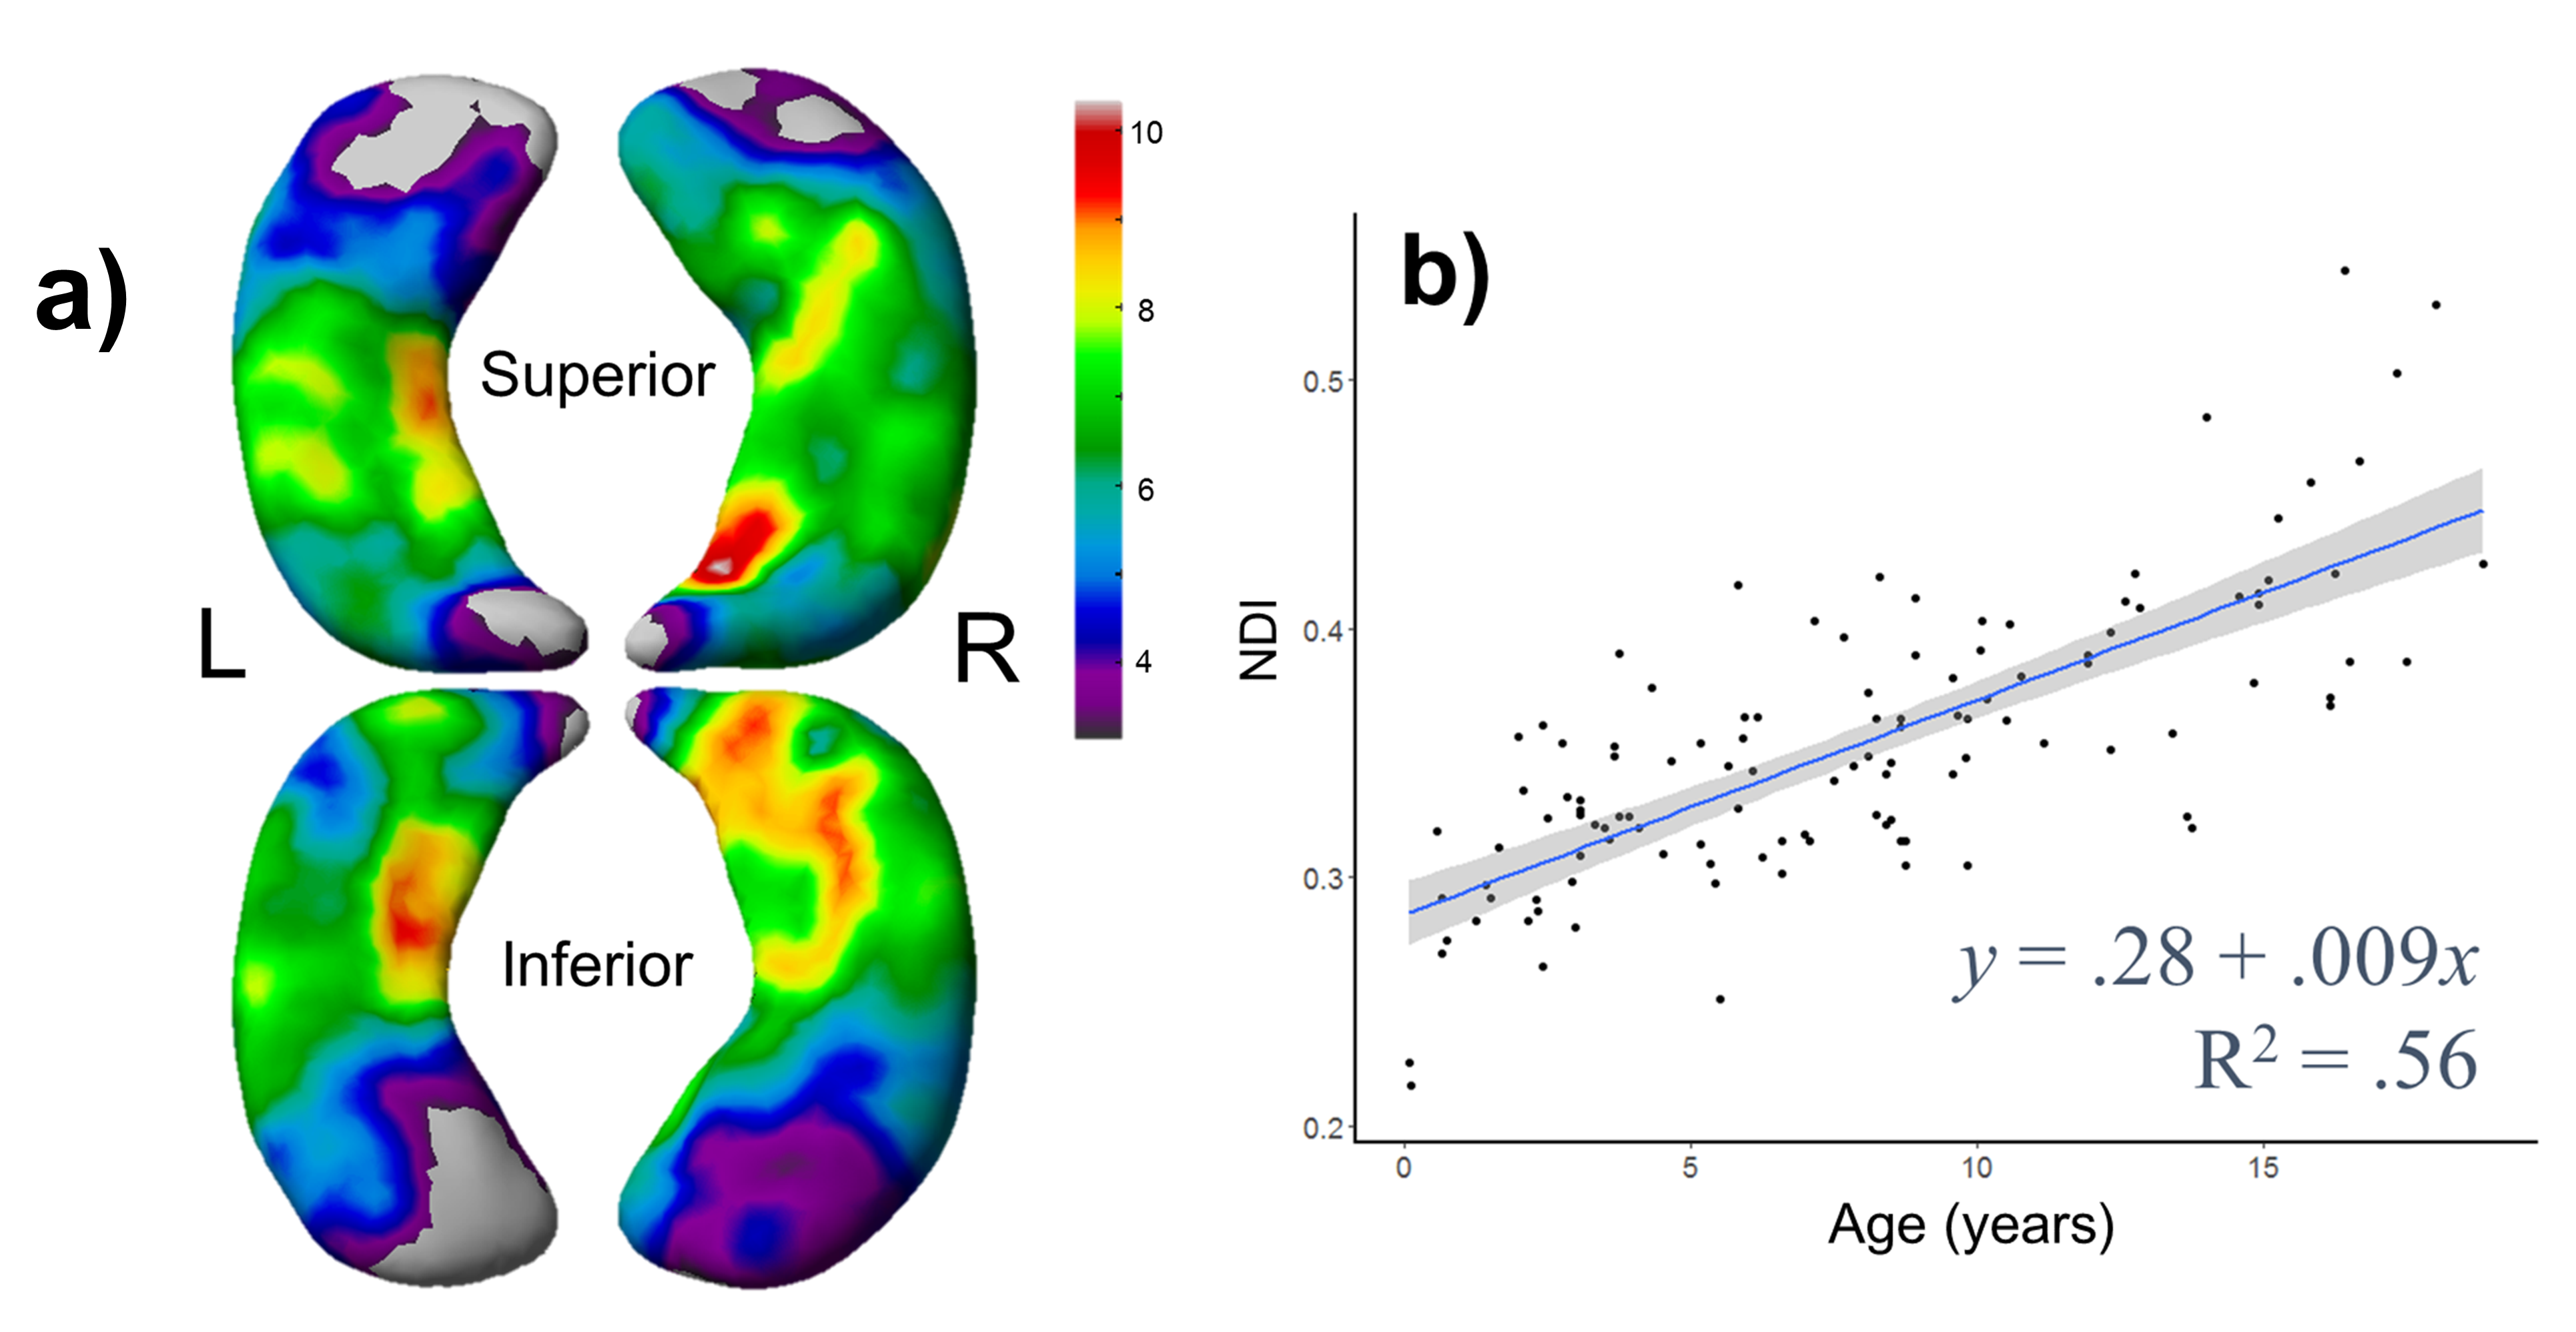
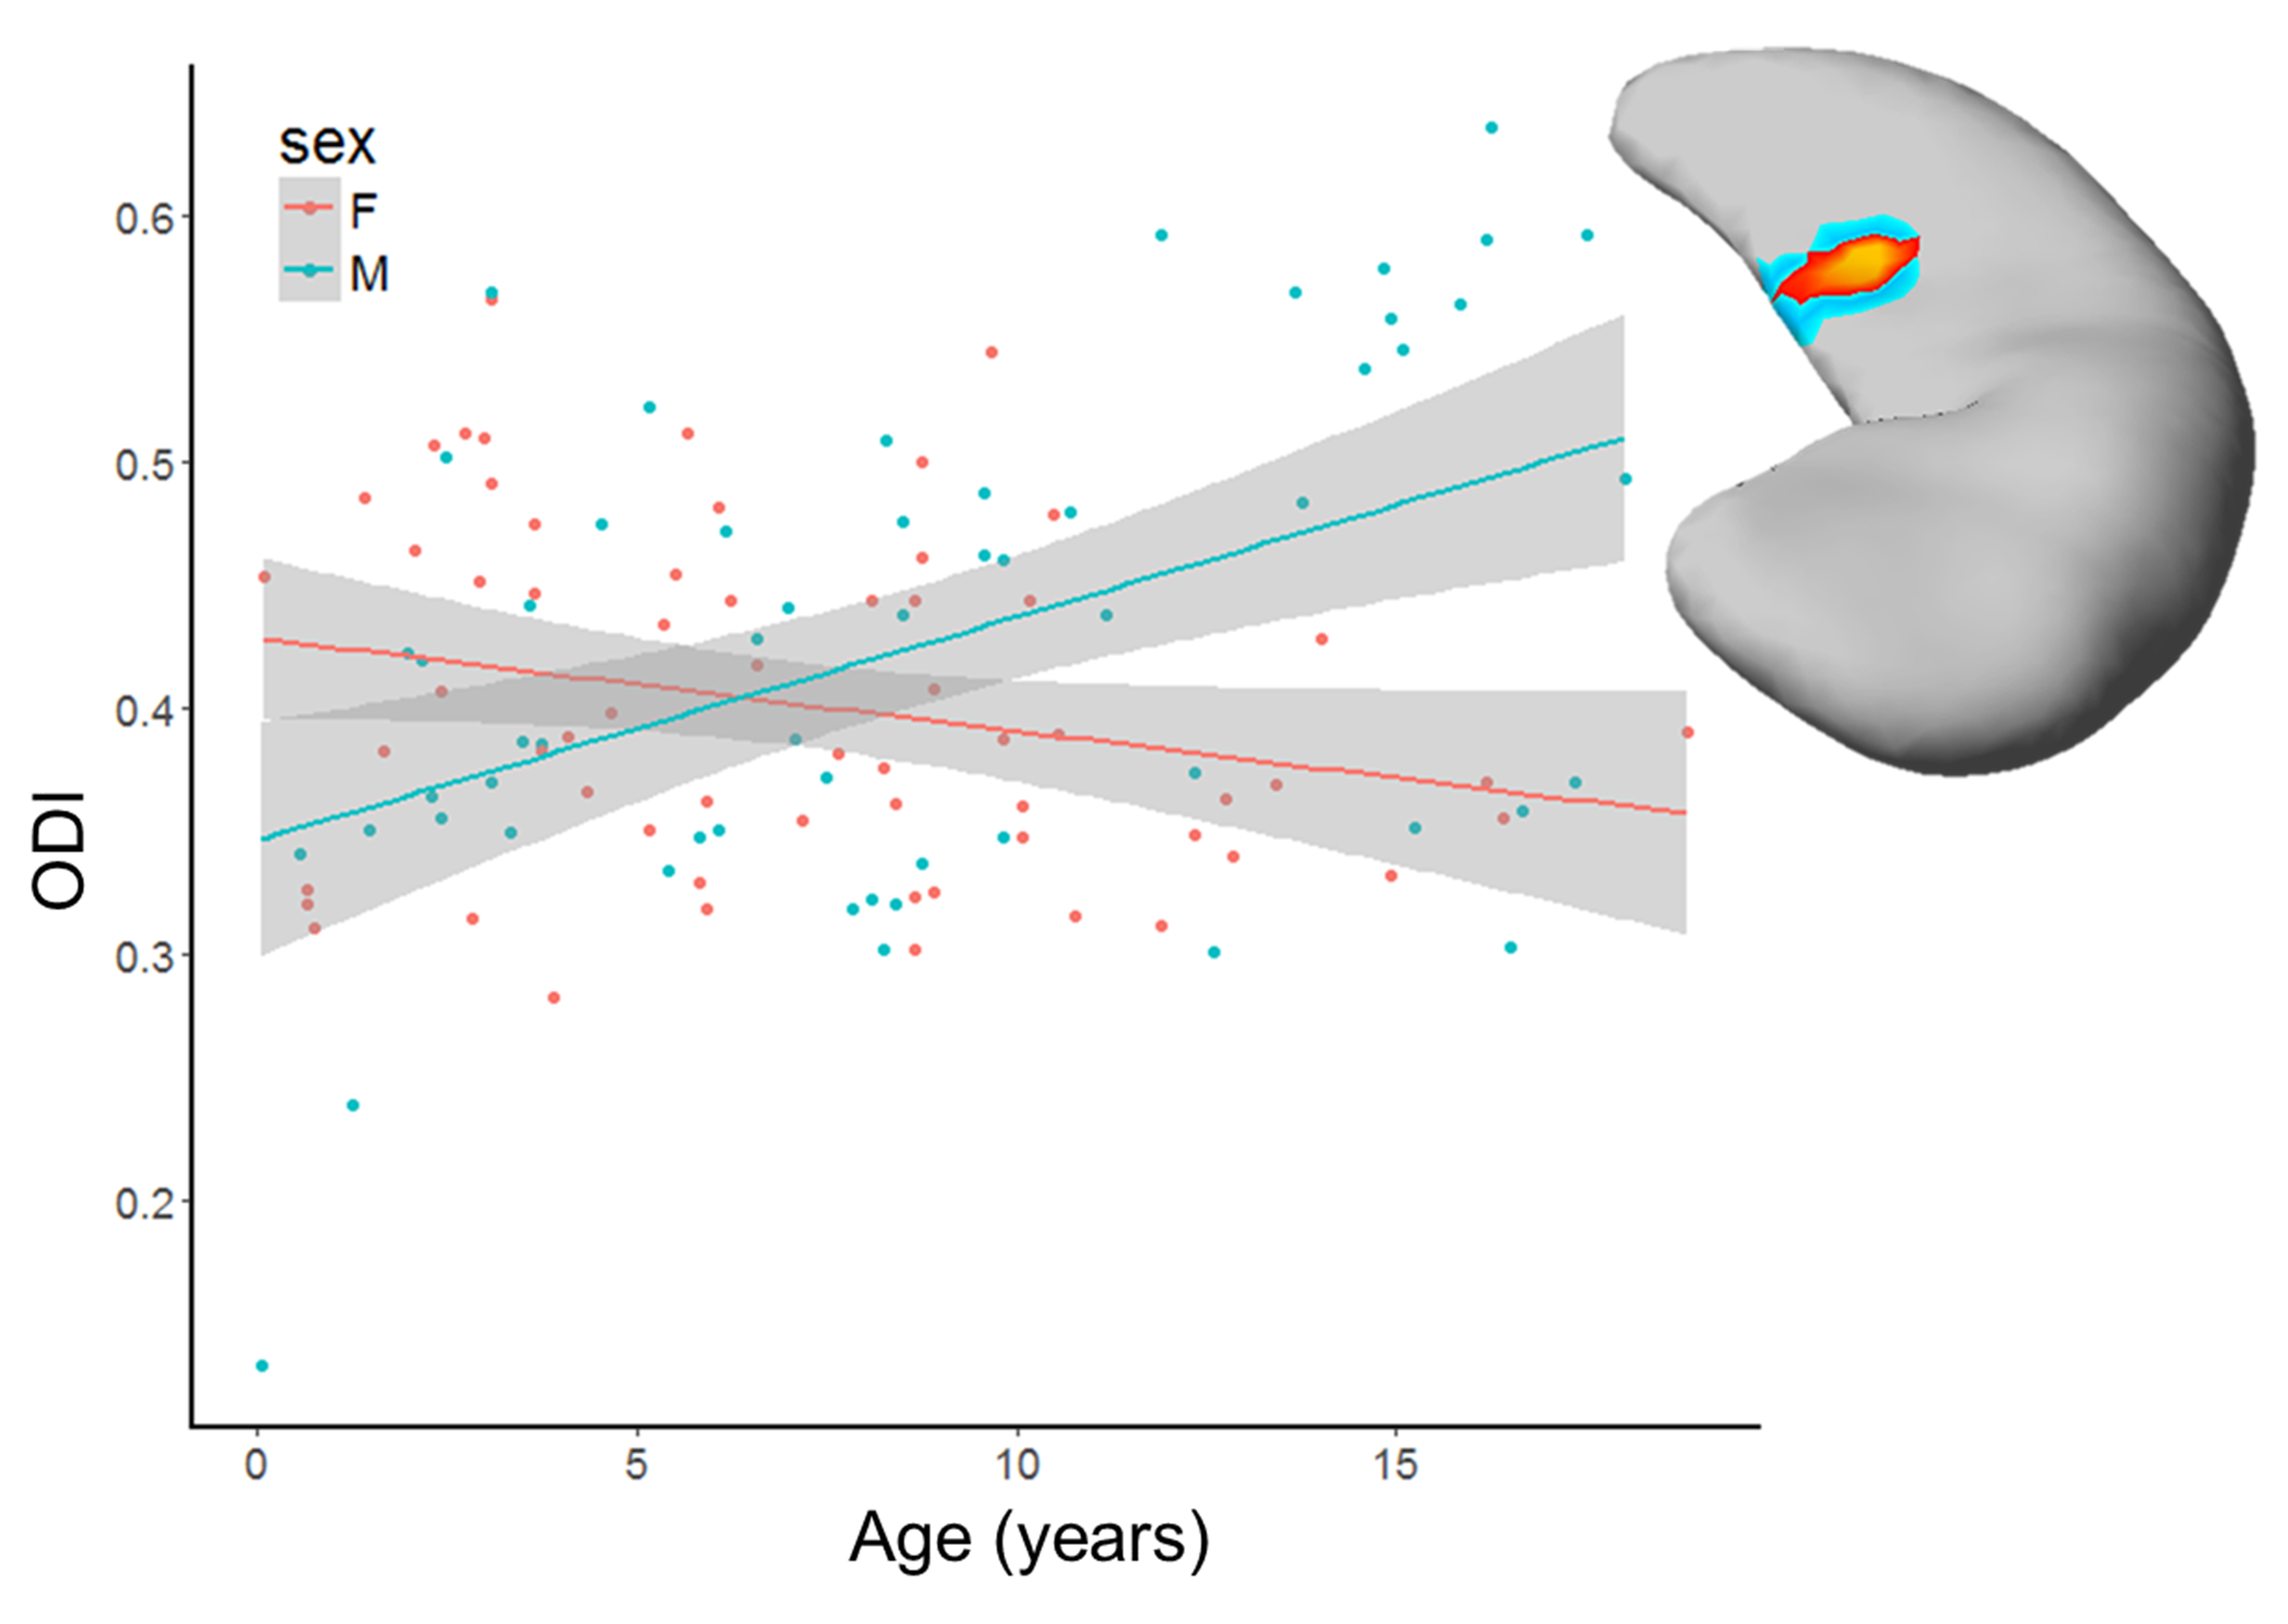
Average NDI and ODI hippocampal surface maps are shown in Figure 2. NDI is highest along the mesial inferior posterior body and lowest in the head and lateral body. ODI exhibits an approximately inverted pattern, with the head and inferior body showing the highest values and posterior superior body showing the lowest values. A main effect of age on regional NDI was observed bilaterally within the majority of the hippocampus when controlling for sex and ICV (Figure 3). Hippocampal ODI showed an age*sex interaction within the posterior superior mesial body (Figure 4).Discussion
Our results show that combining shape analysis with multi-shell diffusion models reveals distinct microstructural patterns within the hippocampus. In children and adolescents, NDI is highest in the mesial hippocampus, which likely reflects the CA2-4/DG subfields. Because neurogenesis occurs within the DG postnatally10, it is possible that this elevated NDI reflects increased neurite density. Age-related changes in NODDI parameters within the hippocampus are in line with other studies showing overall maturation of the entire hippocampus11, particularly in the posterior regions2. Regarding ODI, the different maturational trajectories between males and females within the left mesial body may reflect the differential influence of gonadal hormones on the hippocampus, particularly the DG12,13.Conclusion
Shape analysis techniques and dMRI microstructure models provide invaluable tools to probe specific anatomical features – the microstructure-mesh projection pipeline provides the framework to combine both techniques to explore regional changes in hippocampal microstructure. This tool enables visualization of parameter distributions within the hippocampus by displaying these features on the hippocampal surface. By providing one-to-one correspondence of the surfaces, multivariate analyses may then be carried out to explore how regional hippocampal microstructure changes in aging and diseased states.Acknowledgements
This project is supported by the National Institutes of Health Grants R00HD065832, R01MH094343, P41EB015922, and U54EB020406. The content is solely the responsibility of the authors and does not necessarily represent the official views of the NIH.
Data presented in this work was obtained from the database known as Cincinnati MR Imaging of NeuroDevelopment (C-MIND), provided by the Pediatric Functional Neuroimaging Research Network at https://research.cchmc.org/c-mind/. This Network and the resulting C-MIND database was supported by contract from the Eunice Kennedy Shriver National Institute of Child Health and Human Development (HHSN275200900018C).
References
[1] Kempermann, G., Krebs, J., & Fabel, K. (2008). The contribution of failing adult hippocampal neurogenesis to psychiatric disorders. Curr Opin Psychiatry. 21:290–295.
[2] Gogtay, N., Nugent, T.F., Herman, D.H., Ordonez, A., Greenstein, D., Hyashi, K.M., Clasen, L., Toga, A.W., Giedd, J.N., Rapoport, J.L., & Thompson, P.M. (2006). Dynamic Mapping of Normal Human Hippocampal Development. Hippocampus. 16:664–672.
[3] Lin, M., Fwu, P.T., Buss, C., Davis, E.P., Head, K., Muftuler, L.T., Sandman, C.A., & Su M-Y. (2013). Developmental changes in hippocampal shape among preadolescent children. Int J Dev Neurosci. 31(7):473–481.
[4] Costafreda, S.G., Dinov, I.D., Tu, Z., Shi, Y., Liu, C.Y., Kloszewska, I., Mecocci, P., Soininen, H., Tsolaki, M., Vellas, B., Wahlund, L.O., Spenger, C., Toga, A.W., Lovestone, S., Simmons, A., 2011. Automated hippocampal shape analysis predicts the onset of dementia in mild cognitive impairment. Neuroimage 56(1):212–219
[5] Zhang, H., Schneider, T., Wheeler-Kingshott, C.A., & Alexander, D.C. (2012). NODDI: practical in vivo neurite orientation dispersion and density imaging of the human brain. Neuroimage. 61(4):1000–1016
[6] Shi, Y, Lai, R, Morra, J. H., Dinov, I., Thompson, P. M., & Toga, A. W. (2010) Robust surface reconstruction via Laplace-Beltrami eigen-projection and boundary deformation. IEEE Trans Med Imaging, 29(12):2009-22.
[7] Shi, Y., Lai, R., Wang, D.J, Pelletier, D., Mohr, D., Sicotte, N., & Toga, A. W. (2014). Metric optimization for surface analysis in the Laplace-Beltrami embedding space. IEEE Trans Med Imaging, 33(7):1447-63.
[8] Cao, J. & Worsley, K.J. (1999). The detection of local shape changes via the geometry of Hotelling’s T2 fields. Ann Stat. 27:925–942.
[9] Friston, K.J. (1997). Testing for Anatomically Specified Regional Effects. Hum Brain Mapp. 5:133–136.
[10] Spalding, K.L., Bergmann, O., Alkass, K., Bernard, S., Salehpour, M., Huttner, H.B., Boström, E., Westerlund, I., Vial, C., Buchholz, B.A., Possnert, G., Mash, D.C., Druid, H., Frisén, J., 2013. Dynamics of Hippocampal Neurogenesis in Adult Humans. Cell 153(6):1219–1227.
[11] Uematsu A, Matsui M, Tanaka C, Takahashi T, Noguchi K, Suzuki M, Nishijo H. 2012. Developmental Trajectories of Amygdala and Hippocampus from Infancy to Early Adulthood in Healthy Individuals. PLoS One. 7:e46970.
[12] Wise PM. 2006. Estrogen therapy: Does it help or hurt the adult and aging brain? Insights derived from animal models. Neuroscience. 138:831–835.
[13] Bean LA, Ianov L, Foster TC. 2014. Estrogen receptors, the hippocampus, and memory. Neuroscientist. 20:534–545.
Figures