5248
Effects of tissue microstructure on water resonance line-shape in post-mortem rat brain1Department of Radiology, University of Chicago, Chicago, IL, United States, 2Department of Organismal Biology and Anatomy, University of Chicago, Chicago, IL, United States
Synopsis
Many neurodegenerative diseases are characterized by microstructural changes in white matter, including demyelination and cell loss. Such changes have been demonstrated to produce measurable effects on the MR signal. This work examines these effects from post-mortem fixed rat brain on voxel-wise, high-resolution water spectra acquired using a multi-gradient echo pulse sequence. Results demonstrate that components of the spectra are differentially affected by both white matter orientation relative to B0 as well as tissue microstructure. This suggests that water proton spectra may be sensitive to the tissue microenvironment and could serve as potential MRI based biomarkers of neurodegenerative diseases.
Introduction
Many neurodegenerative diseases, such as ALS and MS, are characterized by microstructural changes in white matter. While these changes occur anatomically at a scale that is much smaller than typical imaging resolutions used in clinical MRI, their effects on the measured MR signal have been widely reported.1, 2 In this work, multi-gradient echo (MGE) data were acquired, producing voxel-wise, high spectral resolution water spectra from post-mortem fixed rat brain. Asymmetry of the voxel-wise water proton spectra was quantified to investigate whether microstructural variations produce measureable changes in the water resonance.Methods
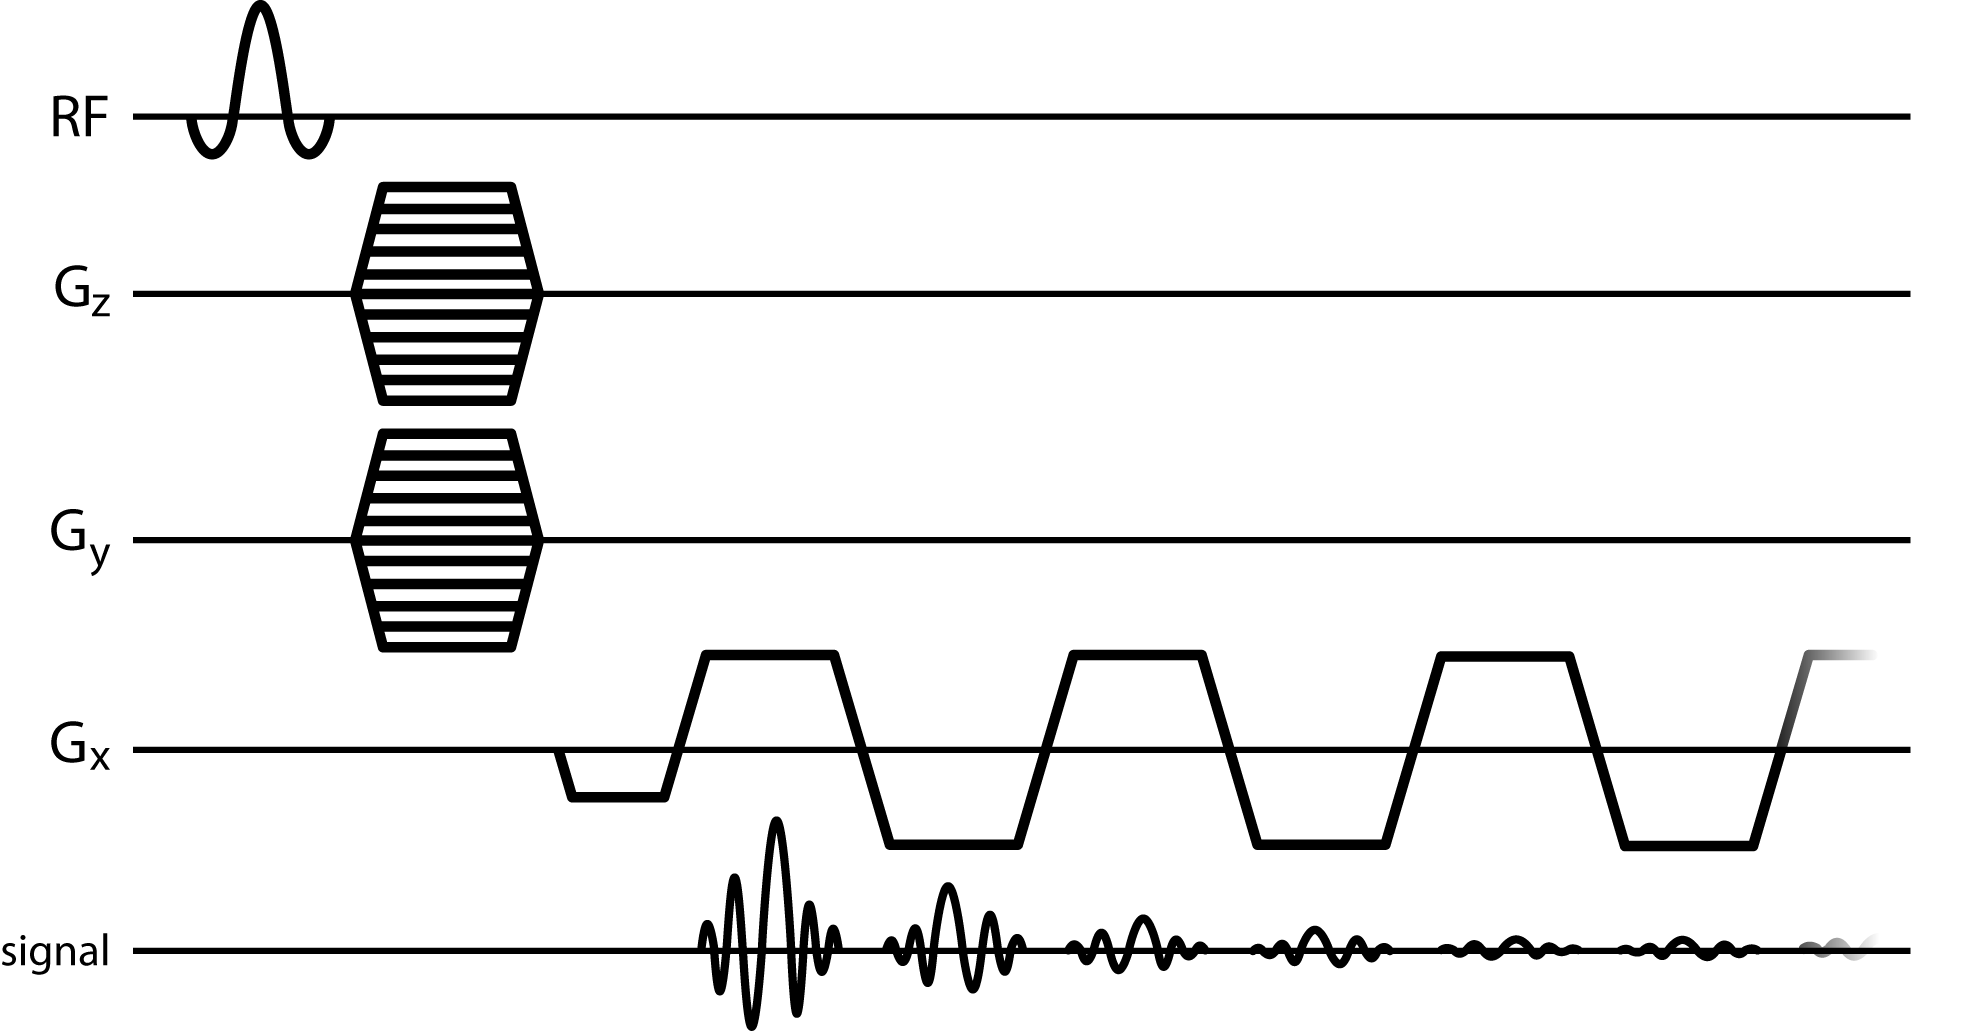
Perfusions fixed, resected rat brains (n=4) were imaged at 9.4 Tesla using a 20cm horizontal bore scanner (Bruker). DTI data were acquired with 150um isotropic resolution using a diffusion-weighted 3D spin-echo sequence. 3D-MGE (Fig 1) data were acquired with 150um isotropic resolution with 2.9Hz spectral resolution and 128 echoes.
Data were processed and analyzed with IDL, Matlab, and FSL.
3D-MGE data were Fourier transformed across all dimensions and phased to produce pure absorption spectra. Voxel-wise spectral asymmetry was computed by subtracting the integral of the high-field half of the spectrum (relative to the main water peak) from the integral of the low-field half of the spectrum, and normalizing by the total spectrum integral.3 Water peak height (PH) images were constructed, where image contrast was produced by the maximum voxel-wise signal intensity of the water spectrum. Each mean b = 0 s/mm2 dataset from the DTI data was registered to the respective PH image via affine transformation using FLIRT.4
Fractional anisotropy (FA) was computed using DTIFIT and thresholded to produce grey and white matter masks. Principal (PDD) and secondary diffusion direction estimates were computed (BEDPOSTX) and probabilistic tractography of the anterior commissure (AC) was performed (PROBTRACKX2).5 Tractography results were thresholded by a minimum streamline count and binarized to create an AC ROI. The voxel-wise solid angle of the PDD (Γ) about B0 was computed over the AC by calculating the arccosine of the PDD vector component that was parallel to B0. All statistics were computed using a Student’s T-test.
Results
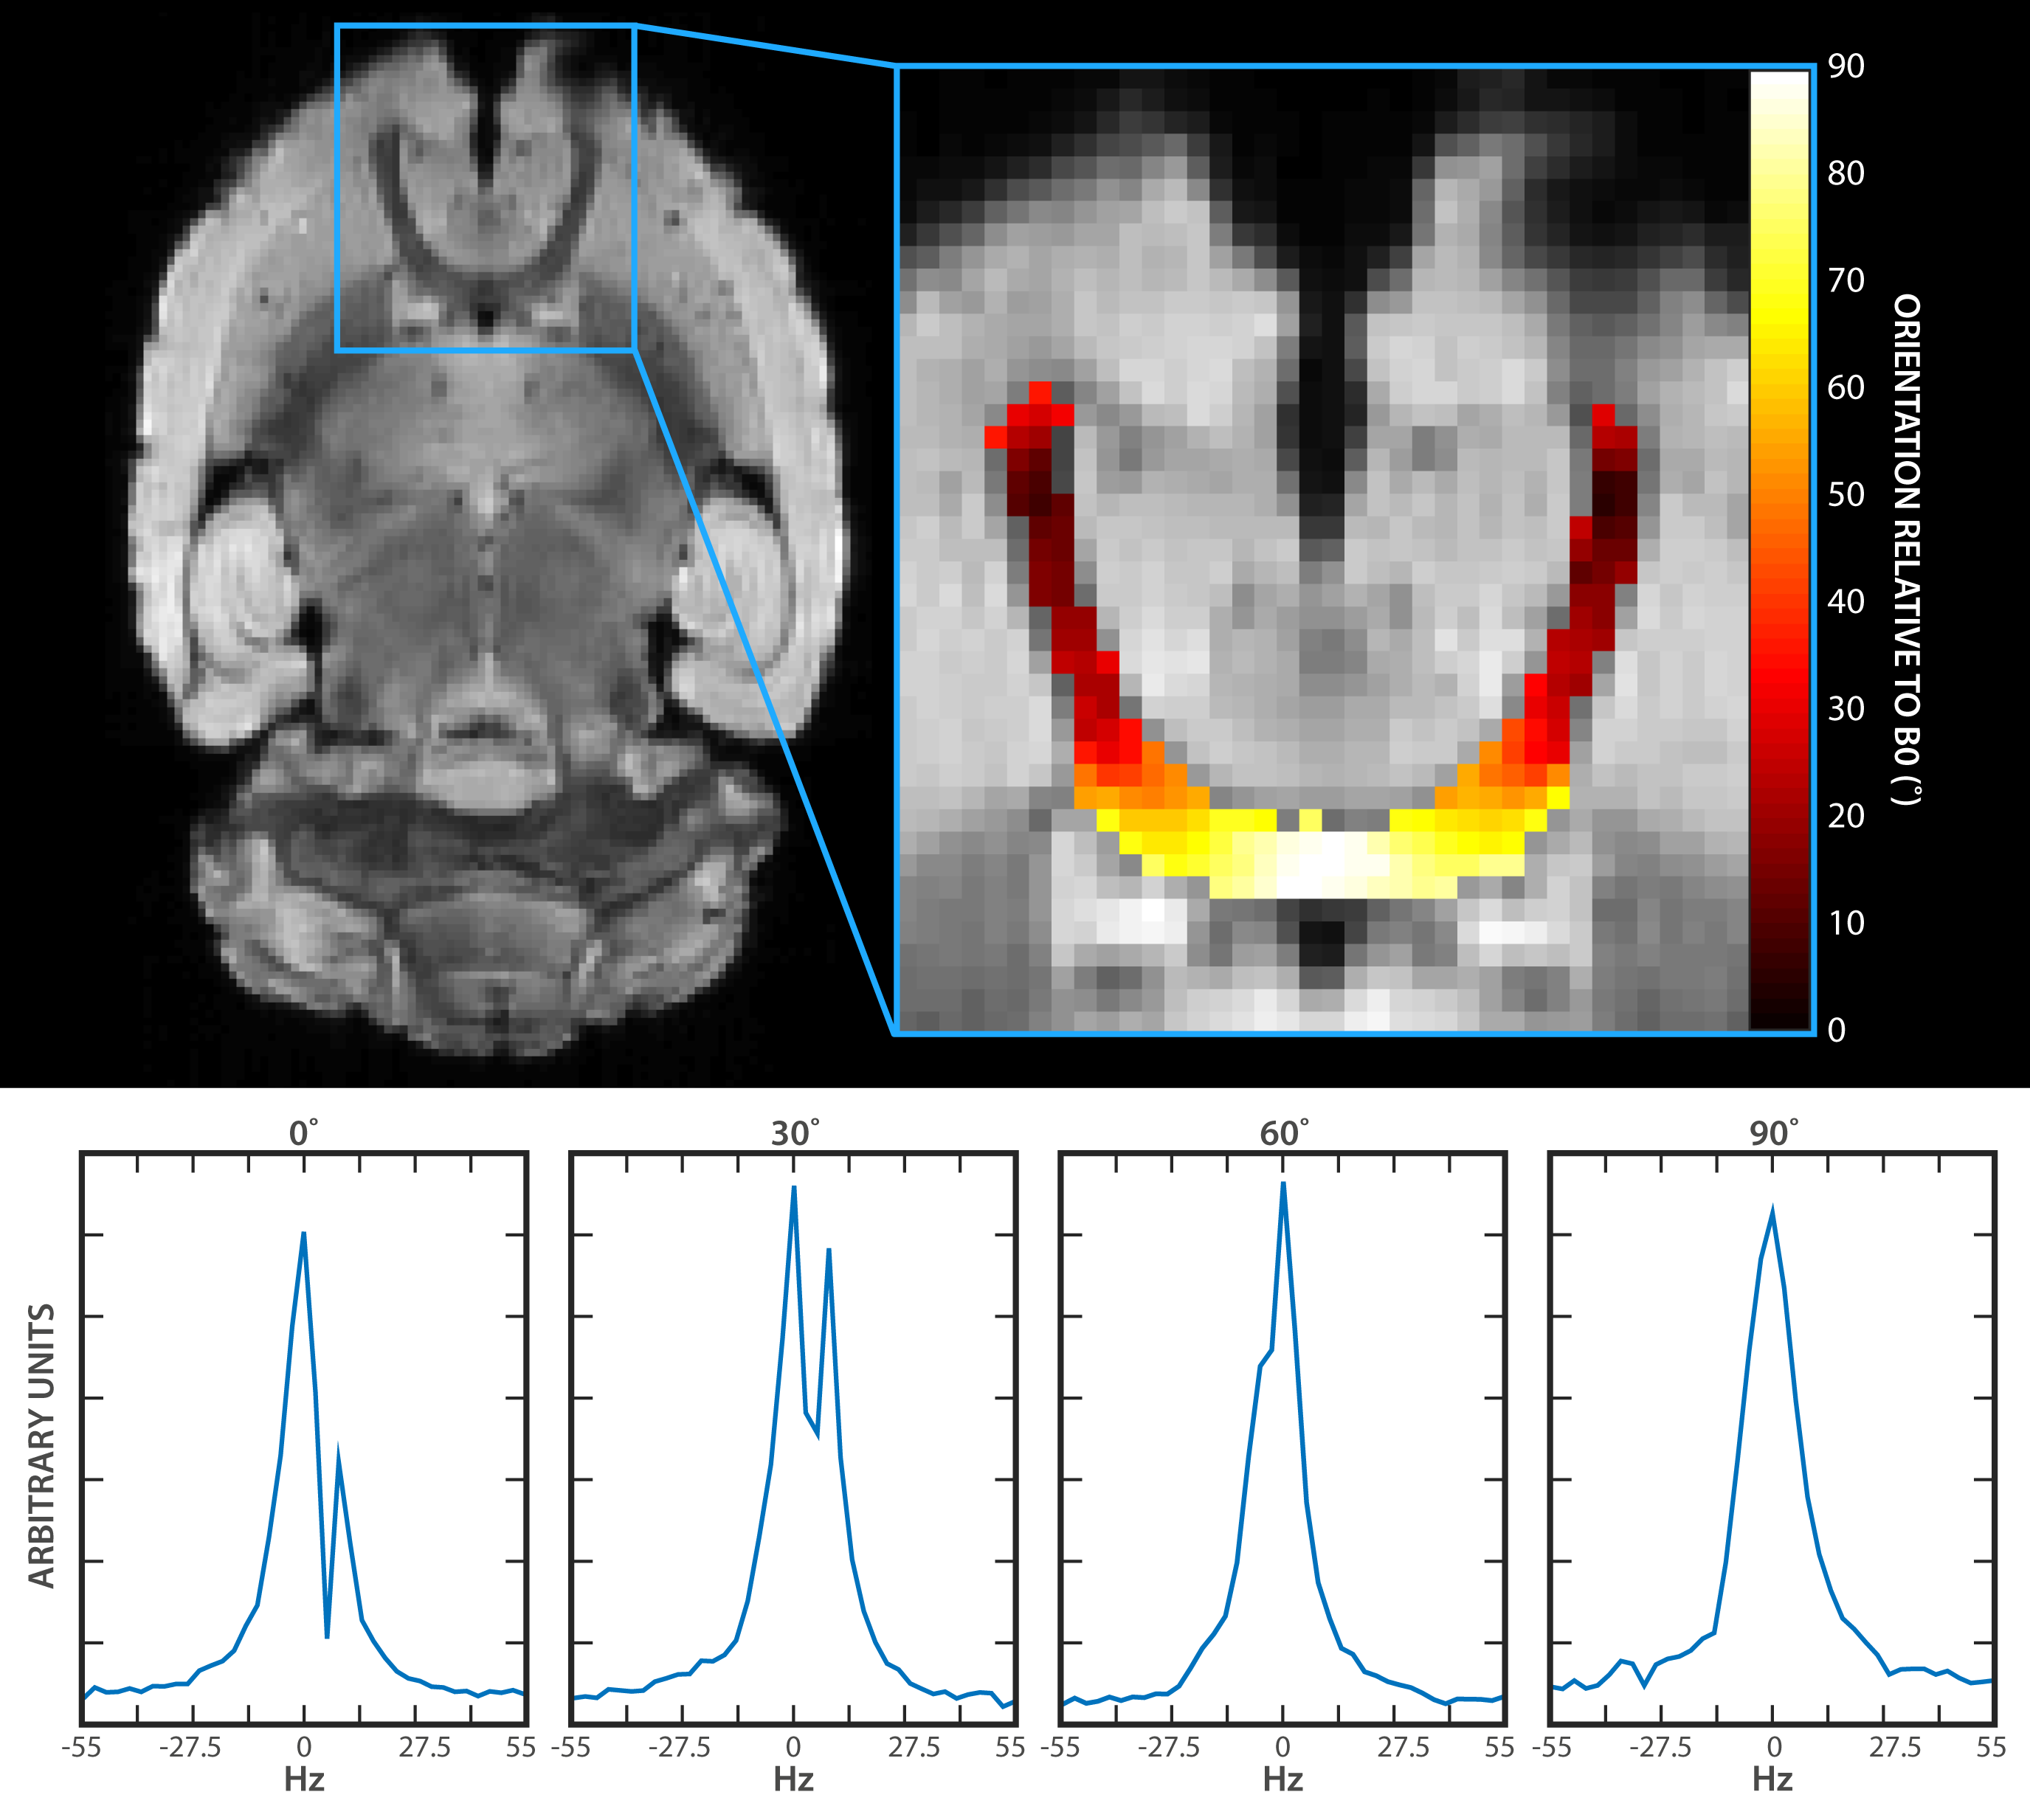
Asymmetric broadening of water spectra was differentially affected as a function of Γ (Fig 2). Typical results demonstrate that two distinct peaks are resolved at 0˚ and 30˚ (Figs 2b and 2c). The peaks become less distinguishable from one another as the axon orientation approaches 90˚ (Figs 2d and 2e).
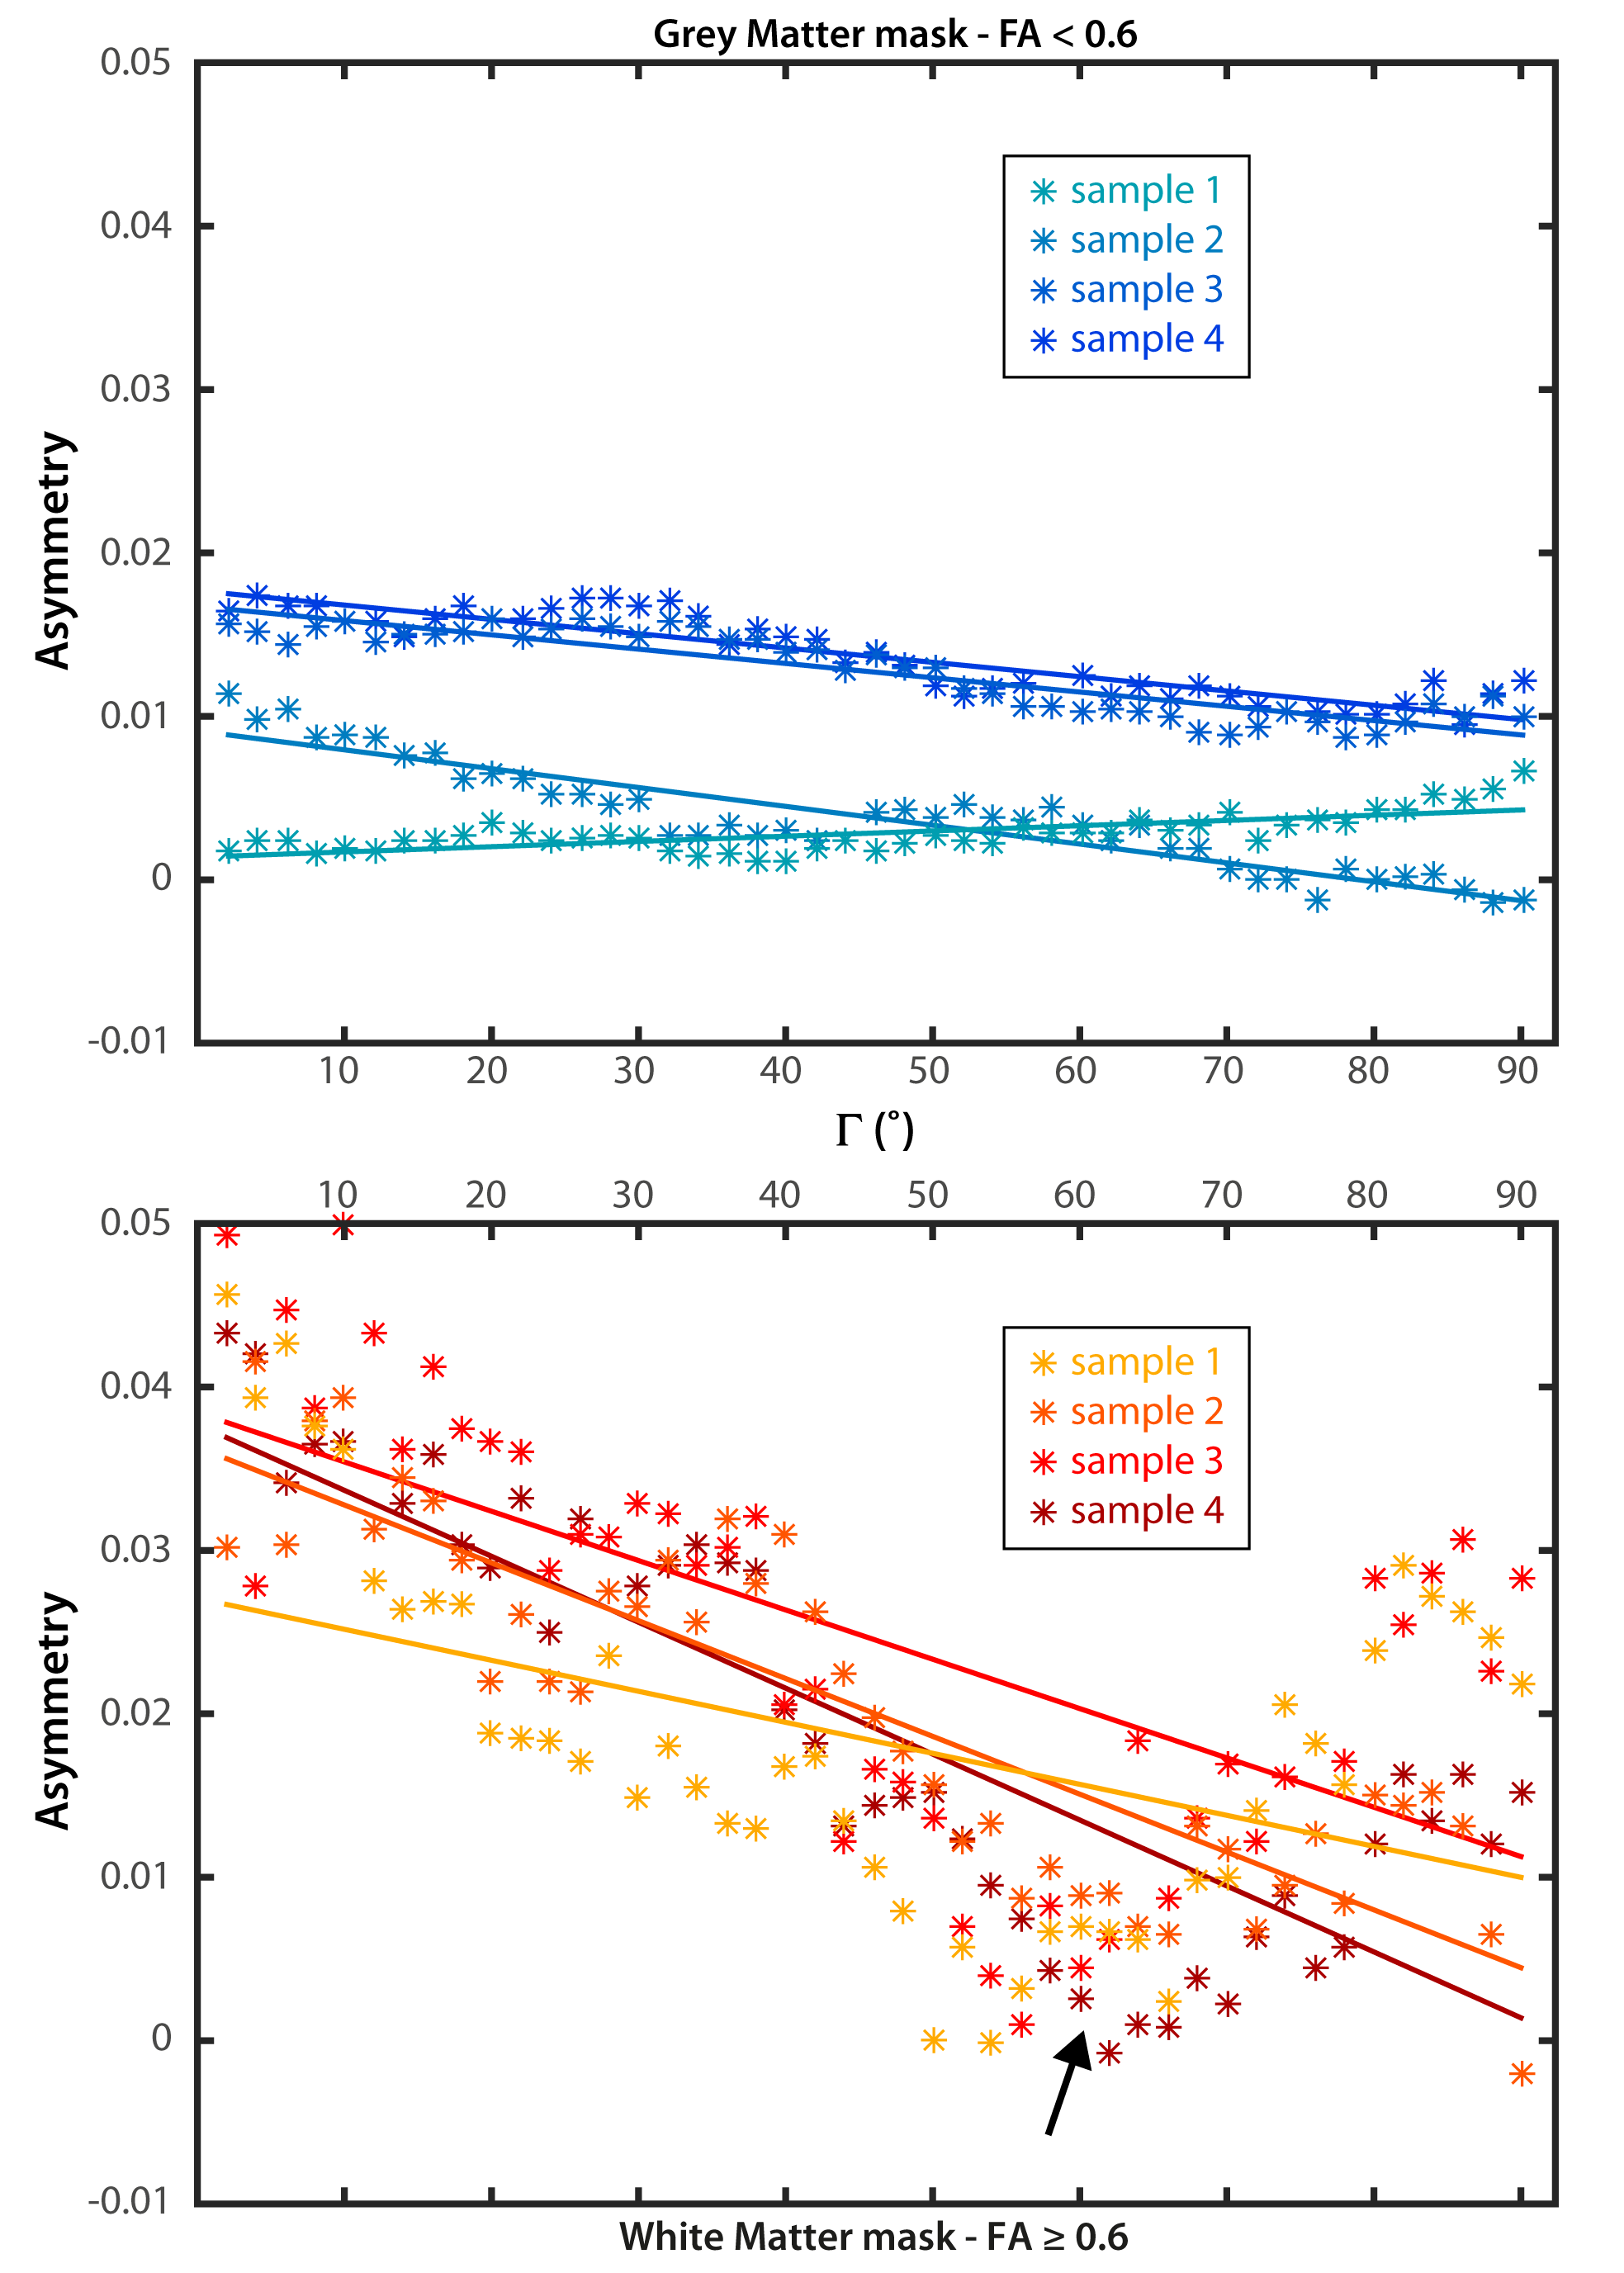
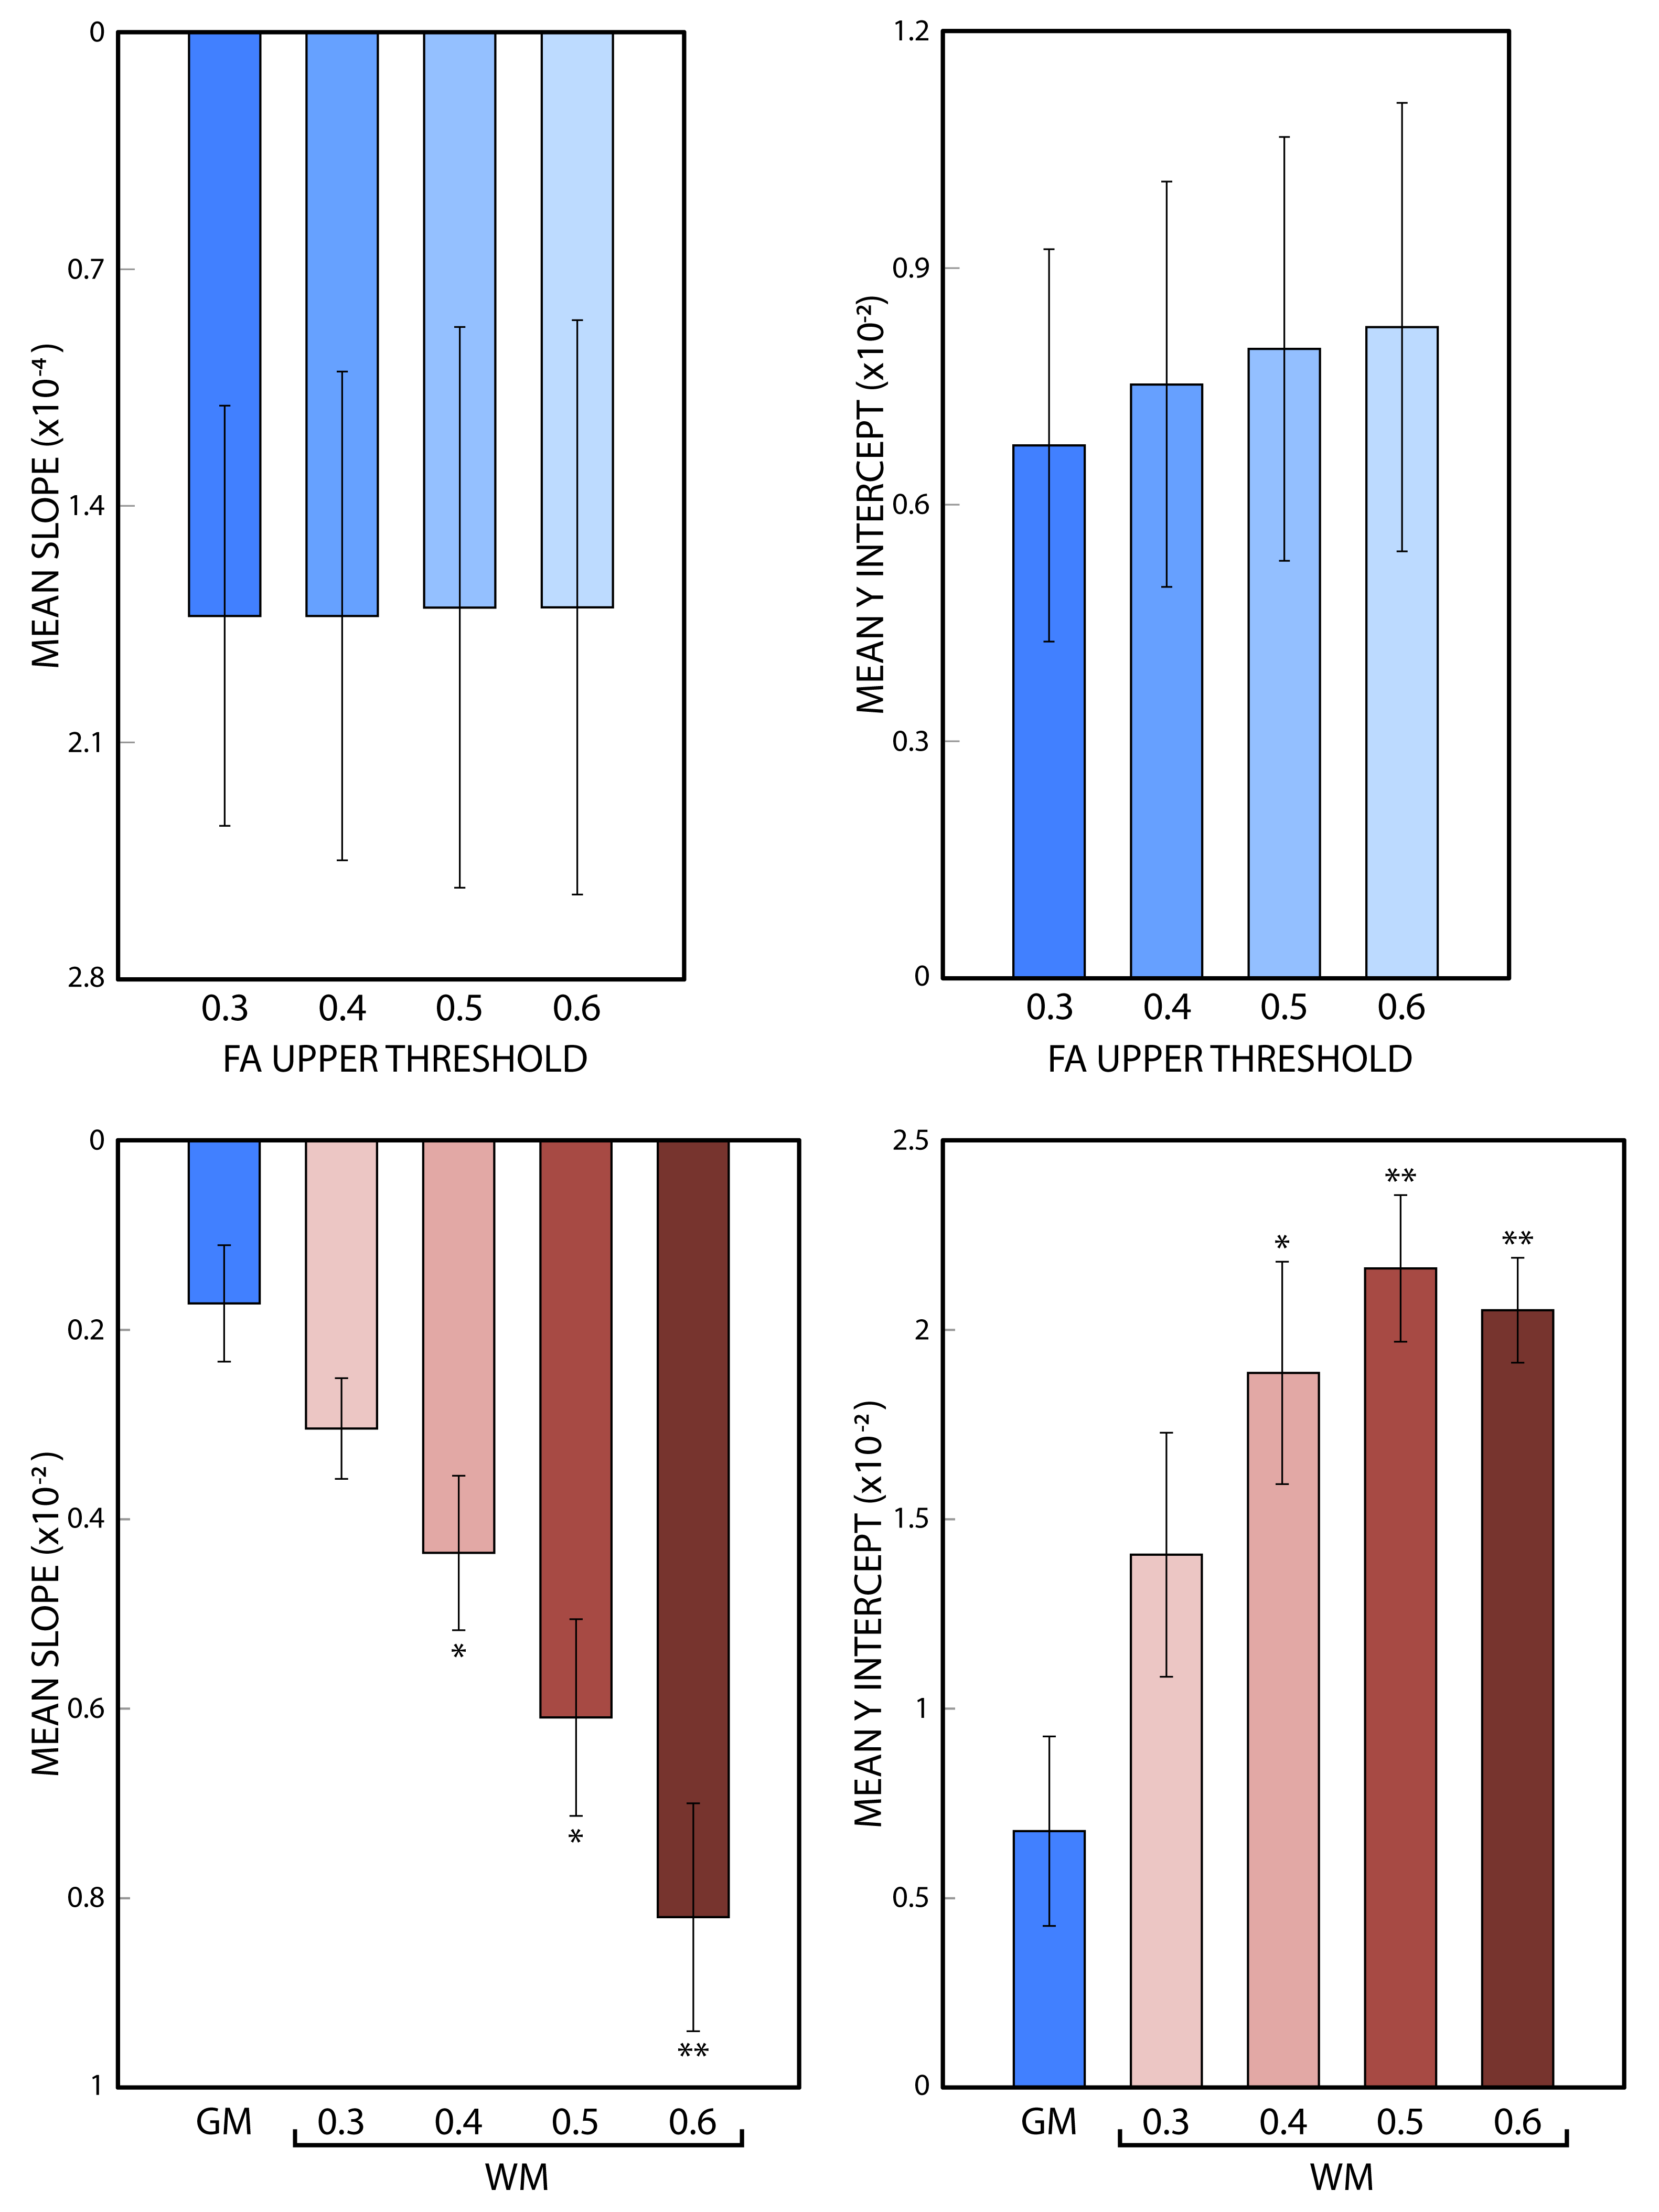
The changes in mean asymmetry with Γ are demonstrated in Figures 3a and 3b, for grey and white matter, respectively (colored asterisks). Plots also include experiment-wise linear fits (solid lines). There is a minimum in the white matter plot across subjects near 55˚ (arrow, Fig 3b). An FA threshold value of 0.6 was used to segment grey and white matter (below and above the threshold, respectively). The slope and y-intercept for the fits to white matter are larger than those of grey matter across all subjects. Slopes and y-interecepts were pooled across subjects and mean values were computed for FA threshold values of 0.3, 0.4, 0.5, and 0.6. Histograms in figure 4 show that as the threshold value increases, the magnitude of the mean slope and y-intercept in white matter increases, while those of grey matter remain unchanged.
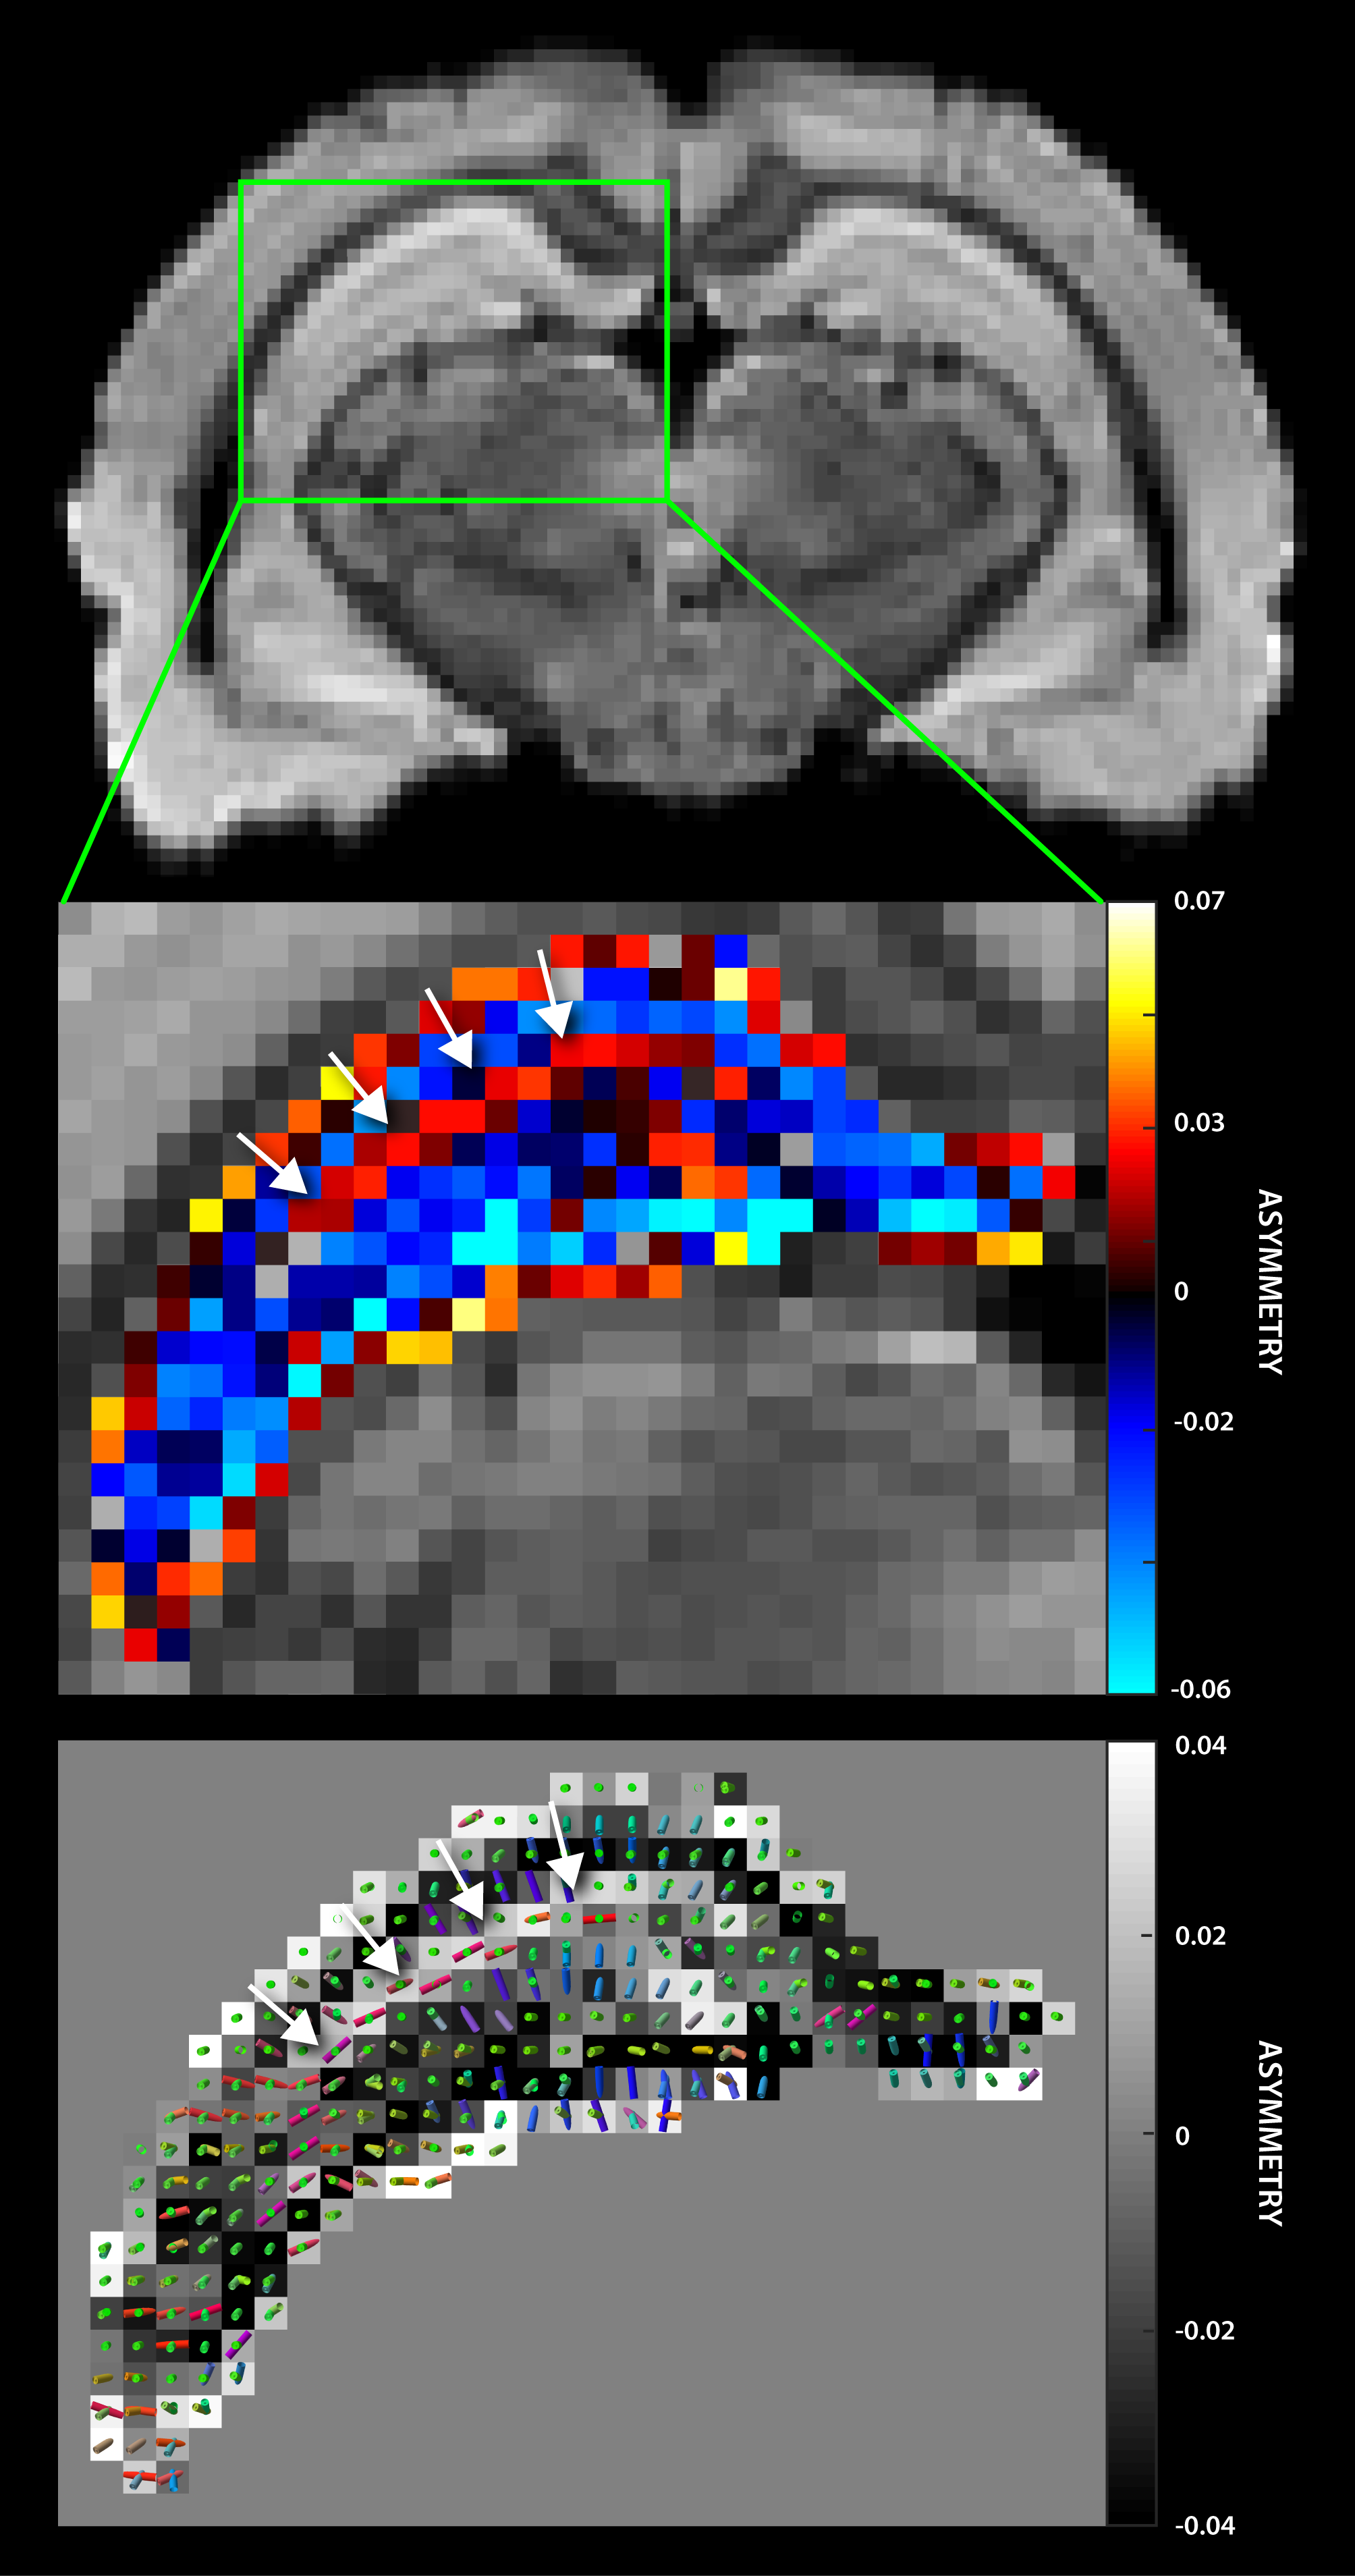
Figure 5a shows a typical axial PH image of the hippocampus. The asymmetry map (Fig 5b) indicates characteristic layered architecture of the hippocampus, where the sign of the asymmetry metric differentiates contiguous laminar structures. The positive asymmetry layer (arrows) corresponds with the principal/secondary fiber estimates (Fig 5c) suggesting the stratum lacunosum moleculare, which contains Schaffer collaterals from CA1 neurons and perforant fibers from the entorhinal cortex.6
Discussion
Changes in both tissue orientation and composition were shown to produce measurable and variable asymmetrical broadening of the spectrum. Present results are consistent with studies of both phantoms and simulations. Chu et al.7 clearly demonstrated the effect that of orientation has on spectra produced from cylindrically compartmentalized paramagnetic hyperfine shift-reagent phantoms. Nested cylinders that specifically modeled white matter produced spectral features that depended on local structure and changed with Γ.8-11 In this regard it is interesting to note that asymmetry reported here is at a minimum when the orientation of white matter tracts is near 55˚, suggesting a |cos2θ -1/3| dependence.12Conclusion
The experimental results reported here compliment aforementioned results, demonstrating that structural variations in tissue architecture, especially orientation of white matter relative to B0, cause characteristic, reproducible changes in the water resonance shape. This suggests that water spectra are sensitive to cytoarchitectural variations in brain tissue and may provide MRI-based biomarkers for pathological changes in the microstructural environment.Acknowledgements
No acknowledgement found.References
1. Rovira A, Wattjes MP, Tintore M, Tur C, Yousry TA, Sormani MP, De Stefano N, Filippi M, Auger C, Rocca MA, Barkhof F, Fazekas F, Kappos L, Polman C, Miller D, Montalban X, group Ms. Evidence-based guidelines: MAGNIMS consensus guidelines on the use of MRI in multiple sclerosis-clinical implementation in the diagnostic process. Nat. Rev. Neurol. 2015;11(8):471-482.
2. Turner MR, Agosta F, Bede P, Govind V, Lule D, Verstraete E. Neuroimaging in amyotrophic lateral sclerosis. Biomark. Med. 2012;6(3):319-337.
3. Foxley S, Fan X, Mustafi D, Haney C, Zamora M, Markiewicz E, Medved M, Wood AM, Karczmar GS. Sensitivity to tumor microvasculature without contrast agents in high spectral and spatial resolution MR images. Magn. Reson. Med. 2009;61(2):291-298.
4. Jenkinson M, Bannister P, Brady M, Smith S. Improved optimization for the robust and accurate linear registration and motion correction of brain images. NeuroImage 2002;17(2):825-841.
5. Behrens TE, Woolrich MW, Jenkinson M, Johansen-Berg H, Nunes RG, Clare S, Matthews PM, Brady JM, Smith SM. Characterization and propagation of uncertainty in diffusion-weighted MR imaging. Magn. Reson. Med. 2003;50(5):1077-1088.
6. Shepherd TM, Ozarslan E, King MA, Mareci TH, Blackband SJ. Structural insights from high-resolution diffusion tensor imaging and tractography of the isolated rat hippocampus. NeuroImage 2006;32(4):1499-1509.
7. Chu SC, Xu Y, Balschi JA, Springer CS, Jr. Bulk magnetic susceptibility shifts in NMR studies of compartmentalized samples: use of paramagnetic reagents. Magn. Reson. Med. 1990;13(2):239-262.
8. Chen WC, Foxley S, Miller KL. Detecting microstructural properties of white matter based on compartmentalization of magnetic susceptibility. NeuroImage 2013;70:1-9.
9. Sati P, van Gelderen P, Silva AC, Reich DS, Merkle H, de Zwart JA, Duyn JH. Micro-compartment specific T2* relaxation in the brain. NeuroImage 2013;77:268-278.
10. Xu T, Foxley S, Kleinnijenhuis M, Chen WC, Miller KL. The effect of realistic geometries on the susceptibility-weighted MR signal in white matter. Magn. Reson. Med. 2017.
11. Wharton S, Bowtell R. Fiber orientation-dependent white matter contrast in gradient echo MRI. Proc Natl Acad Sci. 2012;109(45):18559-18564.
12. Chappell KE, Robson MD, Stonebridge-Foster A, Glover A, Allsop JM, Williams AD, Herlihy AH, Moss J, Gishen P, Bydder GM. Magic angle effects in MR neurography. AJNR Am J Neuroradiol. 2004;25(3):431-440.
Figures