5246
Mapping Normative Mean Apparent Propagator Derived Microstructural Parameters1NICHD, National Institutes of Health, Bethesda, MD, United States, 2Biomedical Engineering, University of Arizona, Rockville, MD, United States, 3NIBIB, National Institutes of Health, Bethesda, MD, United States, 4NINDS, National Institutes of Health, Bethesda, MD, United States, 5CC, National Institutes of Health, Bethesda, MD, United States
Synopsis
This work establishes preliminary data as well as a processing pipeline to generate normative MAP-MRI parameter maps. This normative data can be used to better understand the values and variation of different diffusion-derived microstructural parameters found in healthy humans. This information can then be used as a baseline for future research or clinical projects.
Introduction
Diffusion MRI is a non-invasive imaging technique that probes the microstructure of tissues. One diffusion MRI technique, Mean Apparent Propagator (MAP) MRI1, efficiently estimates the average 3D net displacement distribution, or propagator, of water molecules, and allows for the estimation of a family of new microstructural tissue parameters that show promise as quantitative clinical biomarkers of structural changes in the presence of disease. In addition to its efficiency, MAP-MRI is model-free, meaning that no assumptions about the underlying tissue structure must be made, making it well-suited for detecting and characterizing subtle tissue changes that occur in disease. However, for MAP-MRI to be useful clinically, the statistics of these MAP-MRI derived parameters must also be characterized in a healthy population. The purpose of this work is to establish normative values and variation of several MAP-derived microstructural parameters within the brains of a population of healthy subjects. These values could serve as a reference for future studies, and as a basis for potential clinical applications.Methods
Data Collection:
11 Healthy subjects were scanned on a clinical 3T MRI scanner. The diffusion acquisition consisted of 482 noncollinear diffusion directions with b-values of 1000, 2000, 3000, 4000, 5000, and 6000 s/mm2. The imaging matrix size was 70x70 with 42 slices, and a spatial resolution of 3mm isotropic. The readout was a standard EPI with a SENSE factor of 2, TR/TE = 6000/93.9 ms for a total acquisition time of 48 minutes. A high-resolution 3D MPRAGE was also collected as an anatomical reference.
Data Preprocessing:
DWIs were corrected for EPI distortion using FSL’s TOPUP2, eddy currents using FSL’s eddy3, denoised using an in house implementation of LPCA denoising4, and corrected for signal intensity bias using ANTs’ N4 technique5.
Data Analysis: From the corrected DWIs we computed diffusion tensors using weighted linear least squares, and MAP coefficients using Laplacian regularized linear fitting6. MAP parameters were calculated from the MAP basis functions and coefficients using in house Python code. FreeSurfer was used to parcellate the T1-weighted images into anatomical regions-of-interest, which were then registered to the diffusion MRIs using FSL’s boundary-based registration technique. The FreeSurfer parcellation was used to define several grey and white matter regions of interest (ROIs) within which average MAP-derived parameter values were calculated.
Results
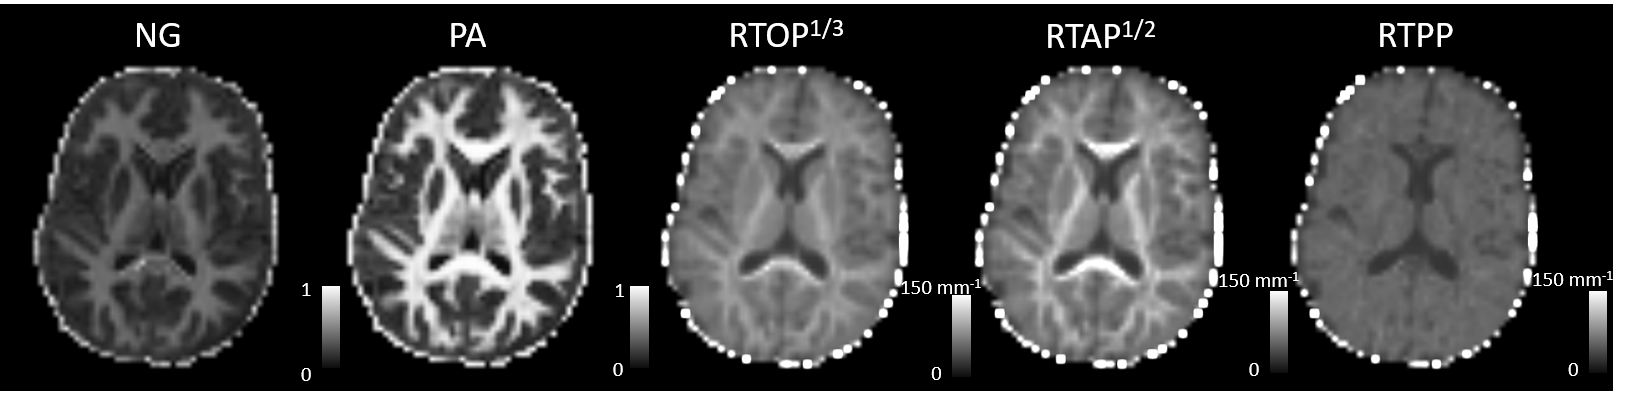
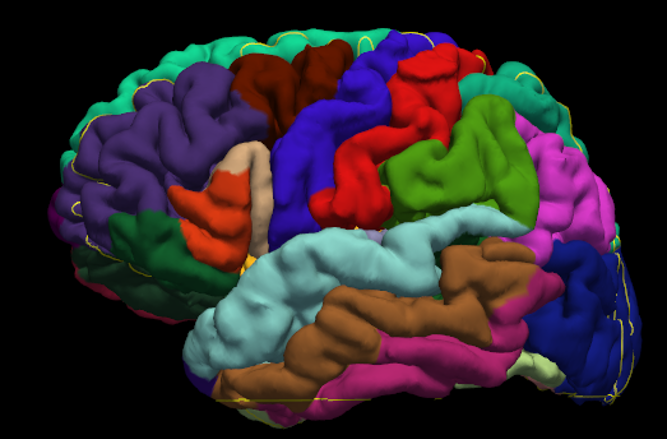
Figure 1 shows representative maps of MAP-derived parameters from the same representative subject including nongaussianity (NG), propagator anisotropy (PA), and return-to-origin (RTOP), return-to-axis (RTAP), and return-to-plane (RTPP) probabilities. Figure 2 shows an example parcellation of the structural T1 image, where each different color demarcates a different region. Finally, Figure 3 depicts the average values and variation of the above parameters. Blue bars indicate structures in the left hemisphere of the brain, and orange bars indicate structures in the right hemisphere, and the error bars indicate the standard deviation of the average parameter value in each region across all subjects. Finally, the plots are separated into gray and white matter regions with gray matter regions on the left and white matter on the right.Discussion
This preliminary work demonstrates the feasibility of determining the distribution of MAP-derived parameters for a given population. Of note, the standard deviation of the parameter values in different regions is quite small in both gray and white matter regions, suggesting that these MAP-derived parameters are relatively consistent across subjects. In addition, there is little variation of the parameters across all gray matter regions, particularly in the RTOP, RTAP, and RTPP maps. While we recognize that this is only a pilot study, future work will include: variation of parameters with age and gender, scanner specific parameters, and comparison of data obtained using different experimental designs. Nonetheless, the highly consistent results reported here, for instance the high left-right symmetry, augur that this pipeline can be expanded upon and be used as a platform to generate normative MAP-MRI data of sufficient quality to make publicly available to others for research and clinical studies.Acknowledgements
This work was supported by the Center for Neurodegeneration and Regenerative Medicine(CNRM) within the auspices of the Department of Defense (DoD) and the Henry JacksonFoundation (HJF) grant number 308049-8.01-60855, and by the Intramural Research Program (IRP) of the National Institute of Biomedical Imaging and Bioengineering (NIBIB) within the NationalInstitutes of Health (NIH).References
- Ozarslan E, Koay CG, Shpherd TM, Komlosh ME, Irfanoglu MO, Pierpaoli C, Basser PJ. Mean apparent propagator (MAP) MRI: a novel diffusion imaging method for mapping tissue microstructure. Neuroimage. 2013 Sep; 78:16-32
- J.L.R. Andersson, S. Skare, J. Ashburner How to correct susceptibility distortions in spin-echo echo-planar images: application to diffusion tensor imaging. NeuroImage, 20(2):870-888, 2003.
- Jesper L. R. Andersson and Stamatios N. Sotiropoulos. An integrated approach to correction for off-resonance effects and subject movement in diffusion MR imaging. NeuroImage, 125:1063-1078, 2016.
- Manjon JV, Coupe P, Concha L, Buades A, Collins DL, Robles M. Diffusion Weighted Image Denoising Using Overcomplete Local PCA. PLoS One. 2013 Sep 3;8(9).
- N. Tustison et al., N4ITK: Improved N3 Bias Correction, IEEE Transactions on Medical Imaging, 29(6):1310-1320, June 2010.
- Fick RHJ, Wassermann D, Sanguinetti G, Deriche R. Laplacian-regularized MAP-MRI: Improving axonal caliber estimation.
Figures