5244
Axon Diameter Mapping Independent of Crossing Structures using Spherical Mean Technique1Radiology, Massachusetts General Hospital, Boston, MA, United States, 2Neurology, Massachusetts General Hospital, Boston, MA, United States
Synopsis
Current approaches to axonal size estimation by diffusion MRI assume a single fiber bundle, which limits its application to a few white matter tracts in the healthy human brain. We introduce a new approach to per-voxel axon diameter and volume fraction estimation inspired by the spherical mean framework that is robust to fiber crossings and orientation dispersion. We use this technique to estimate whole brain axon diameter and volume fraction in 6 healthy subjects scanned on the 3T Connectome scanner and demonstrate the utility of this approach to characterize white matter pathology in a patient with multiple sclerosis.
Introduction
Approaches for estimating microstructural tissue properties such as compartment size and volume fractions in white matter (WM) by diffusion MRI are continually evolving, with efforts to address crossing fibers and orientation dispersion still ongoing[1-4]. Generalization of these approaches to whole brain analyses is important to study trends in compartment size regardless of fiber crossings and also to gain insight into pathological processes affecting WM, in which fiber orientation may not be preserved. Here, we present a new method for axon diameter mapping in the whole in vivo human brain independent of fiber crossings. Our approach is inspired by and expands upon the Spherical Mean Technique (SMT)[5,6] by incorporating compartment size estimation. We demonstrate the ability of our method to provide axon diameter, volume fraction, and hindered diffusivity measurements using whole brain data acquired with 300mT/m maximum gradient strength in 6 healthy subjects and a patient with multiple sclerosis (MS).Theory
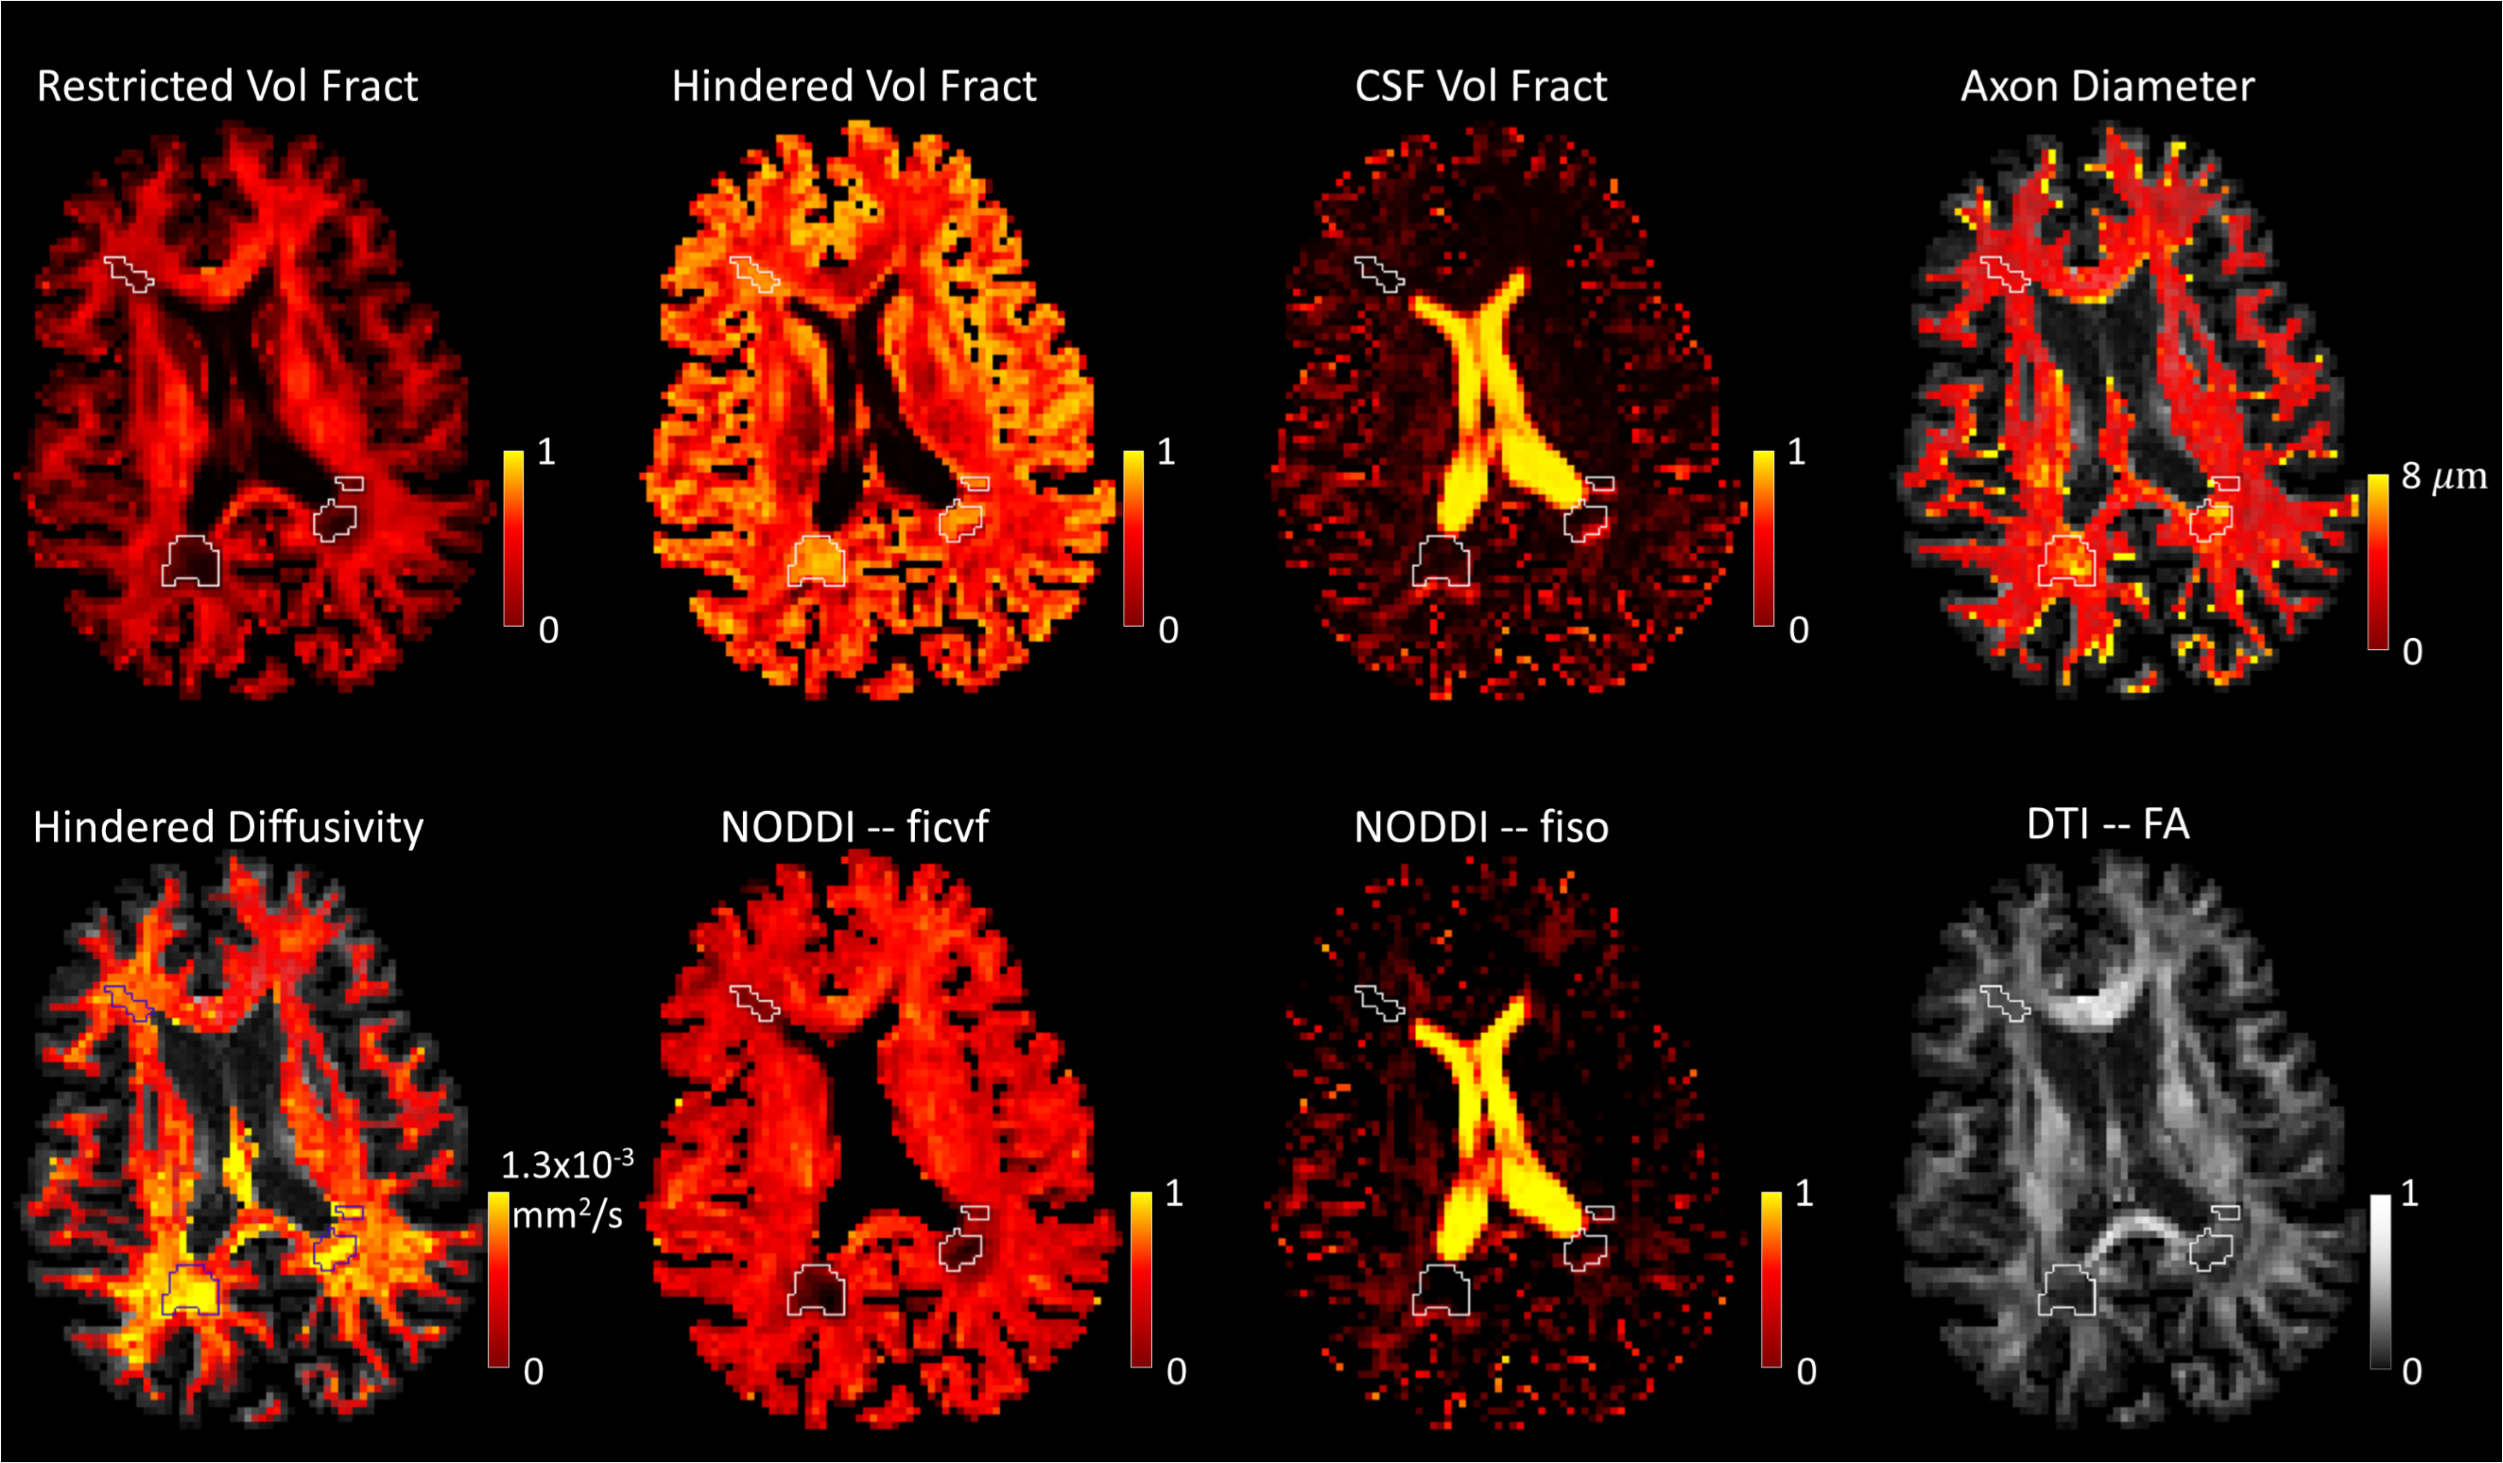
The spherical mean approach to axon diameter estimation models white matter as composed of three compartments: restricted diffusion in cylindrical axons modeled using the Gaussian phase distribution approximation[7], extra-axonal hindered diffusion modeled as Gaussian diffusion with parallel diffusivity of 1.7x10⁻³mm2/s and fitted transverse diffusivity, and free Gaussian diffusion in CSF with diffusivity of 3x10⁻³mm2/s. The signal was then integrated over all gradient directions following the derivation in [8] to obtain the signal independent of fiber orientation and crossing structures.Method
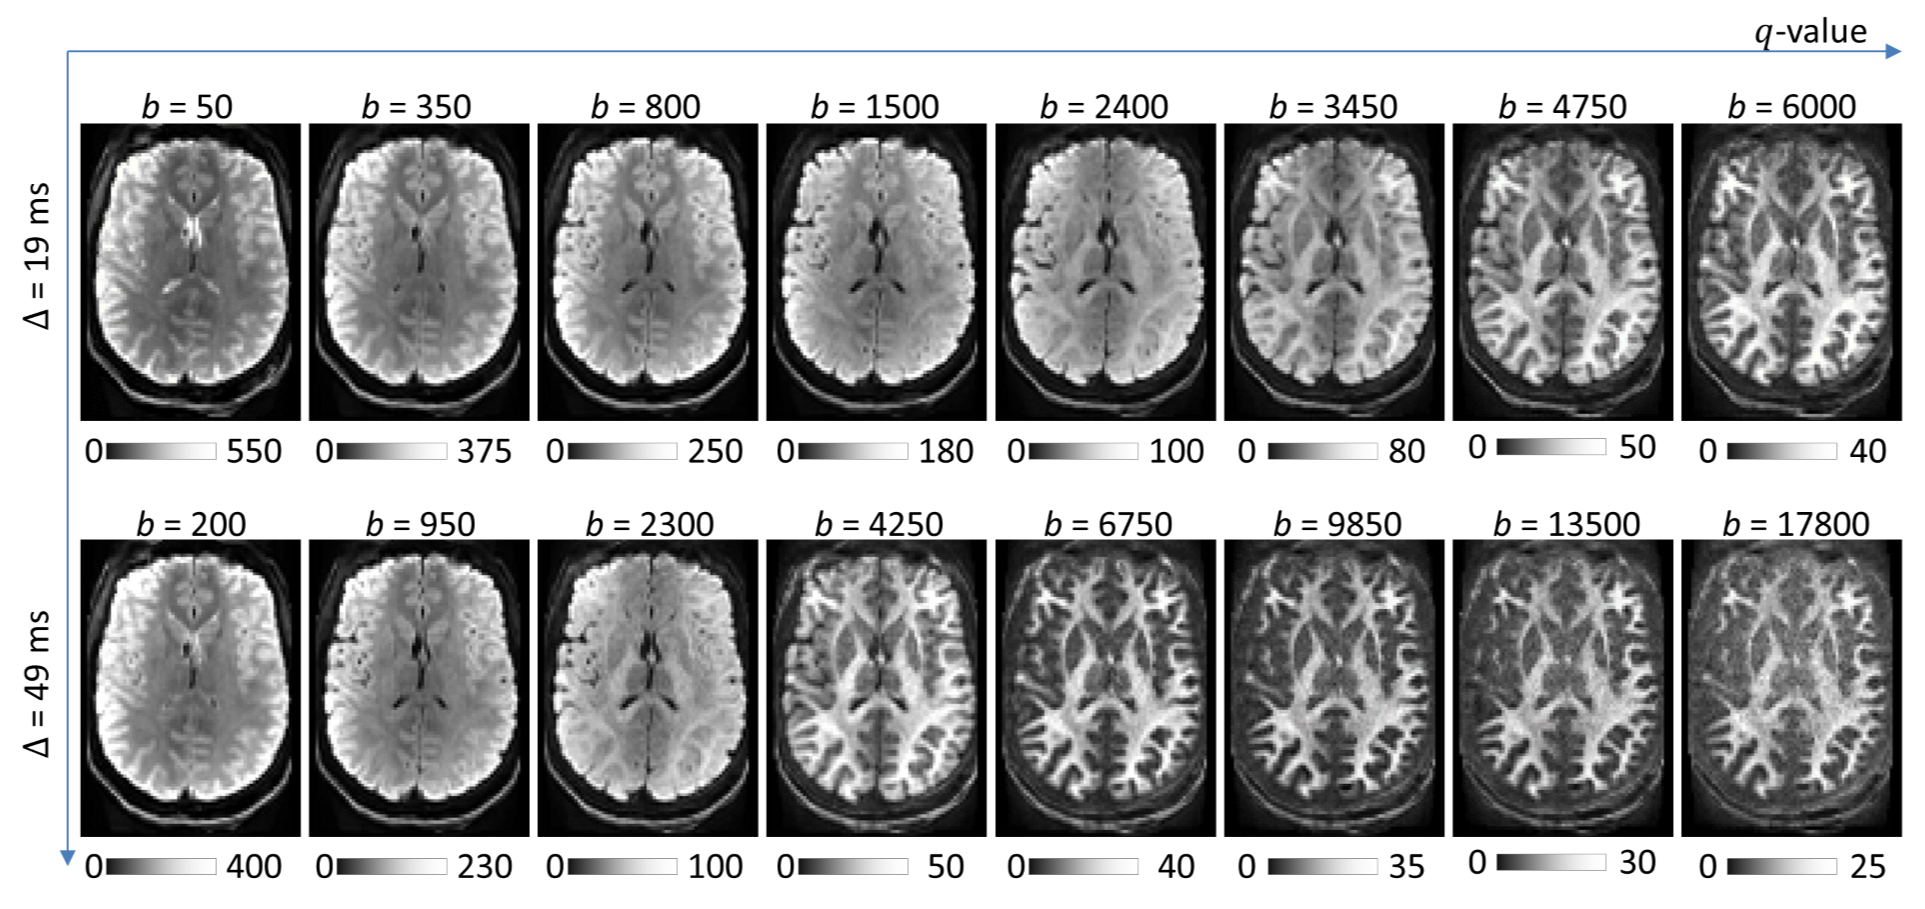
Six healthy subjects (29±12yro, 6F) and one patient with MS were scanned on the 3T Connectome scanner with 300mT/m maximum gradient strength using a custom-made 64-channel head coil[9]. Real-valued diffusion data was acquired to avoid buildup of the noise floor[10]. Sagittal 2-mm isotropic resolution diffusion-weighted spin-echo EPI images were acquired with whole brain coverage. The following parameters were used: TR/TE=4000/77ms, δ=8ms, Δ=19/49ms, 8 diffusion gradient strengths linearly spaced from 30-290mT/m per Δ, 32-64 diffusion directions, parallel imaging (R=2) and simultaneous multislice (MB=2). Representative spherical mean images are shown in Figure 1.
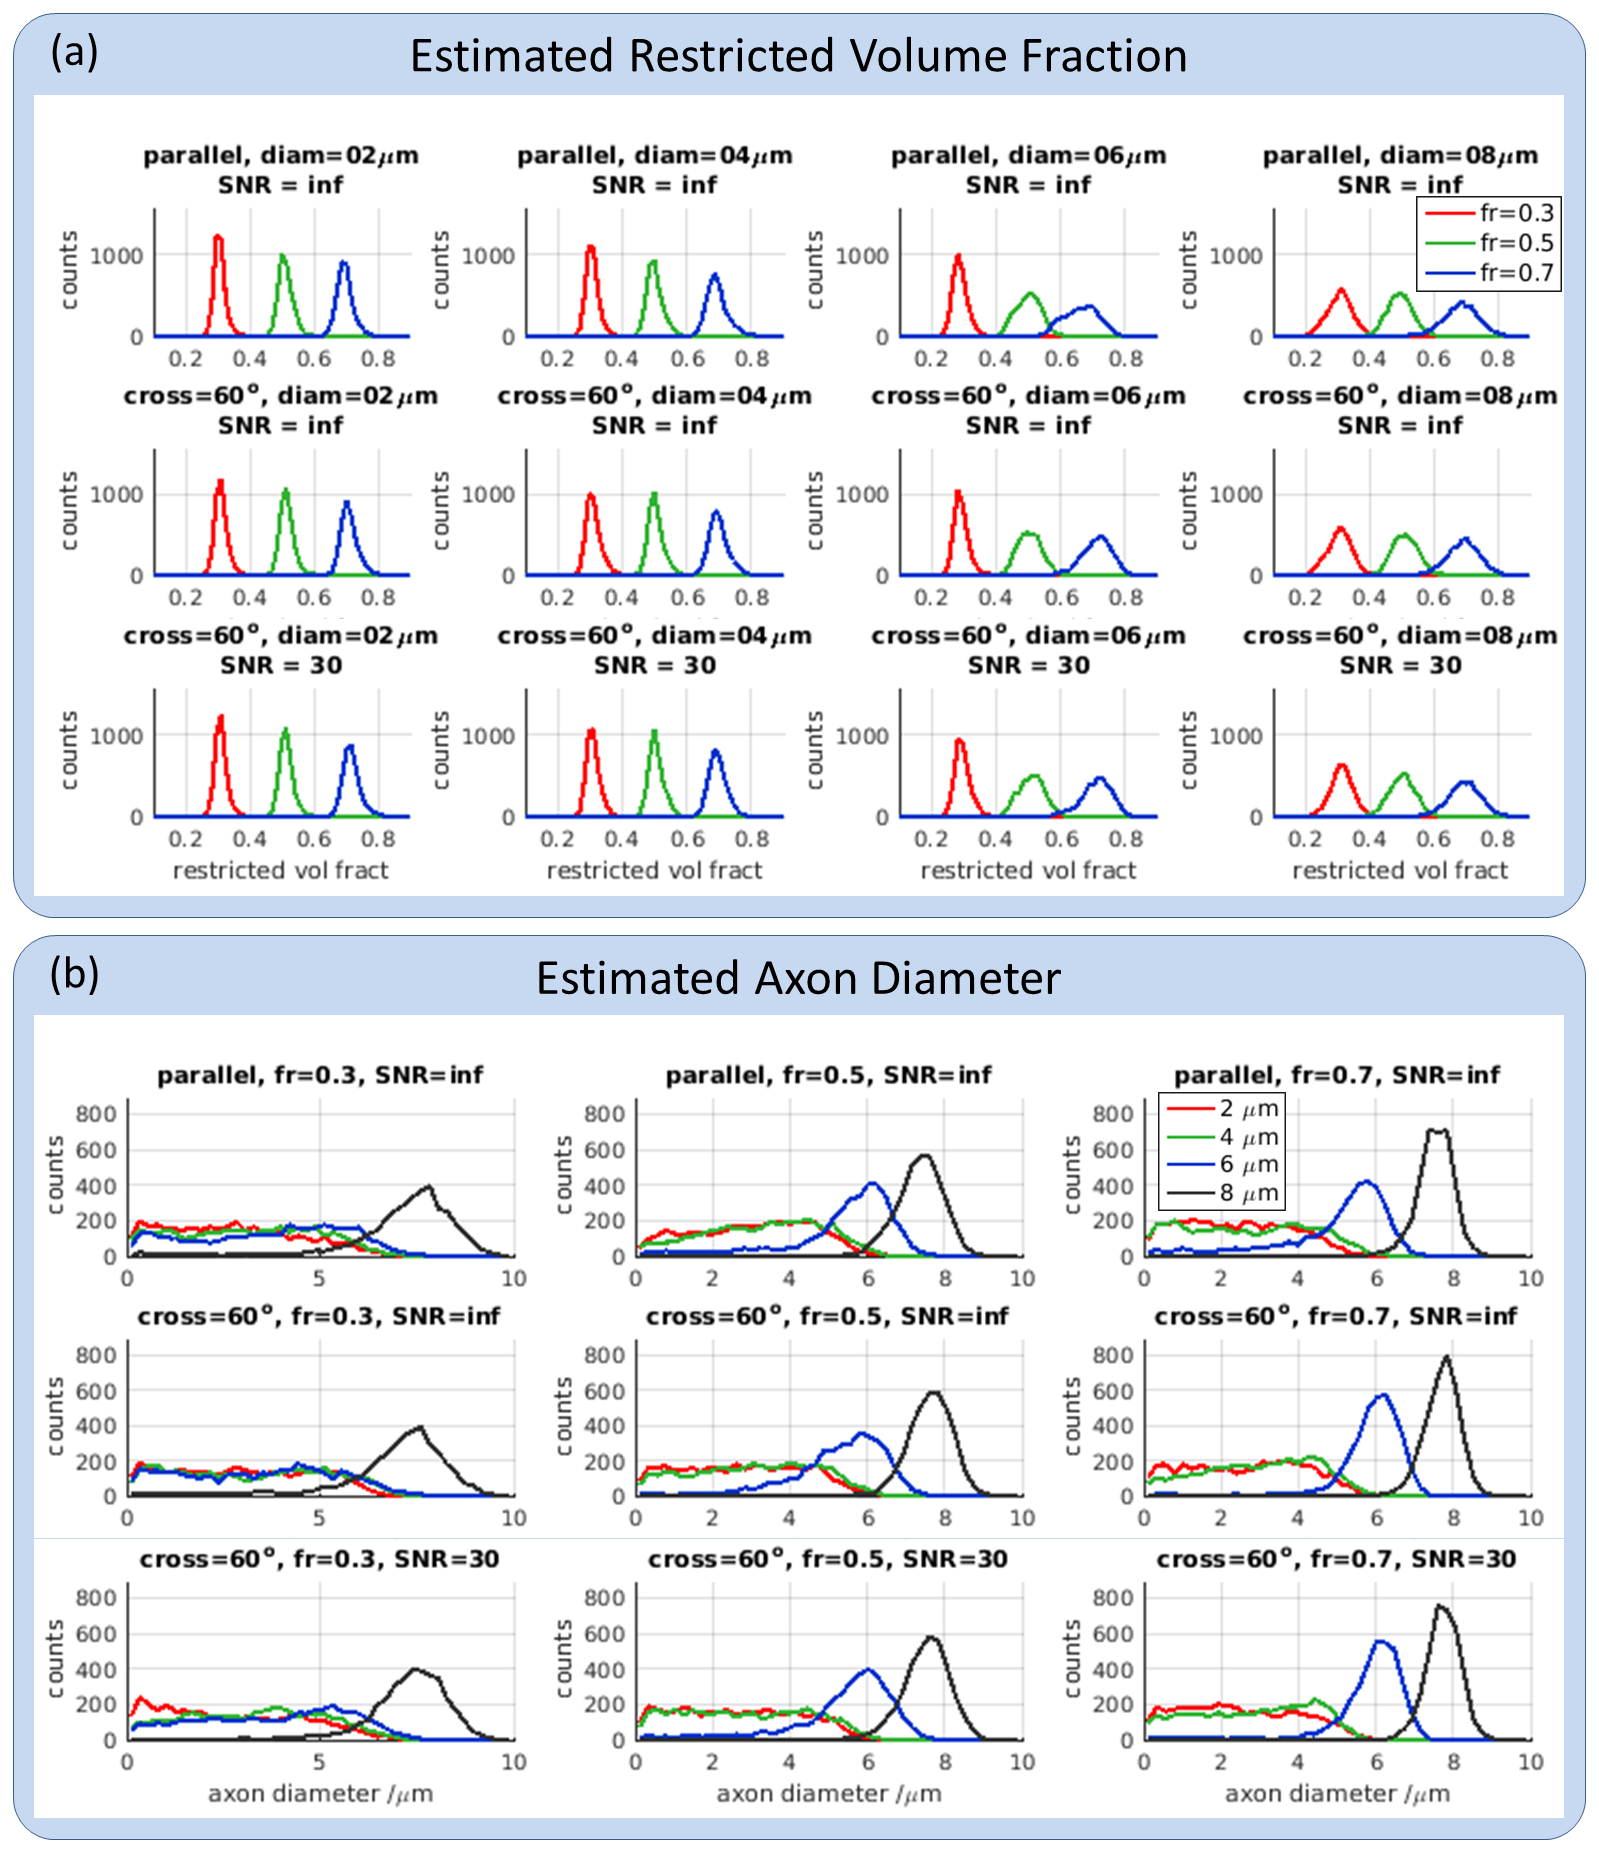
Synthetic data was generated using the Camino[11] diffusion simulator[12] within impermeable cylinders with uniform diameters (2-8μm) and a range of intra-axonal volume fractions (0.3-0.7). Simulations were performed using the diffusion MRI parameters outlined above.
Diffusion data were corrected for susceptibility and eddy current distortions using the TOPUP[13] and EDDY[14,15] tool in FSL. Voxel-wise fitting for axon diameter, restricted and hindered volume fraction, and hindered diffusivity according to the above model was performed using Markov Chain Monte Carlo (MCMC) sampling. The JHU white-matter tractography atlas[16] was used to create WM ROIs in individual native space to report tract-averaged statistics.
Results
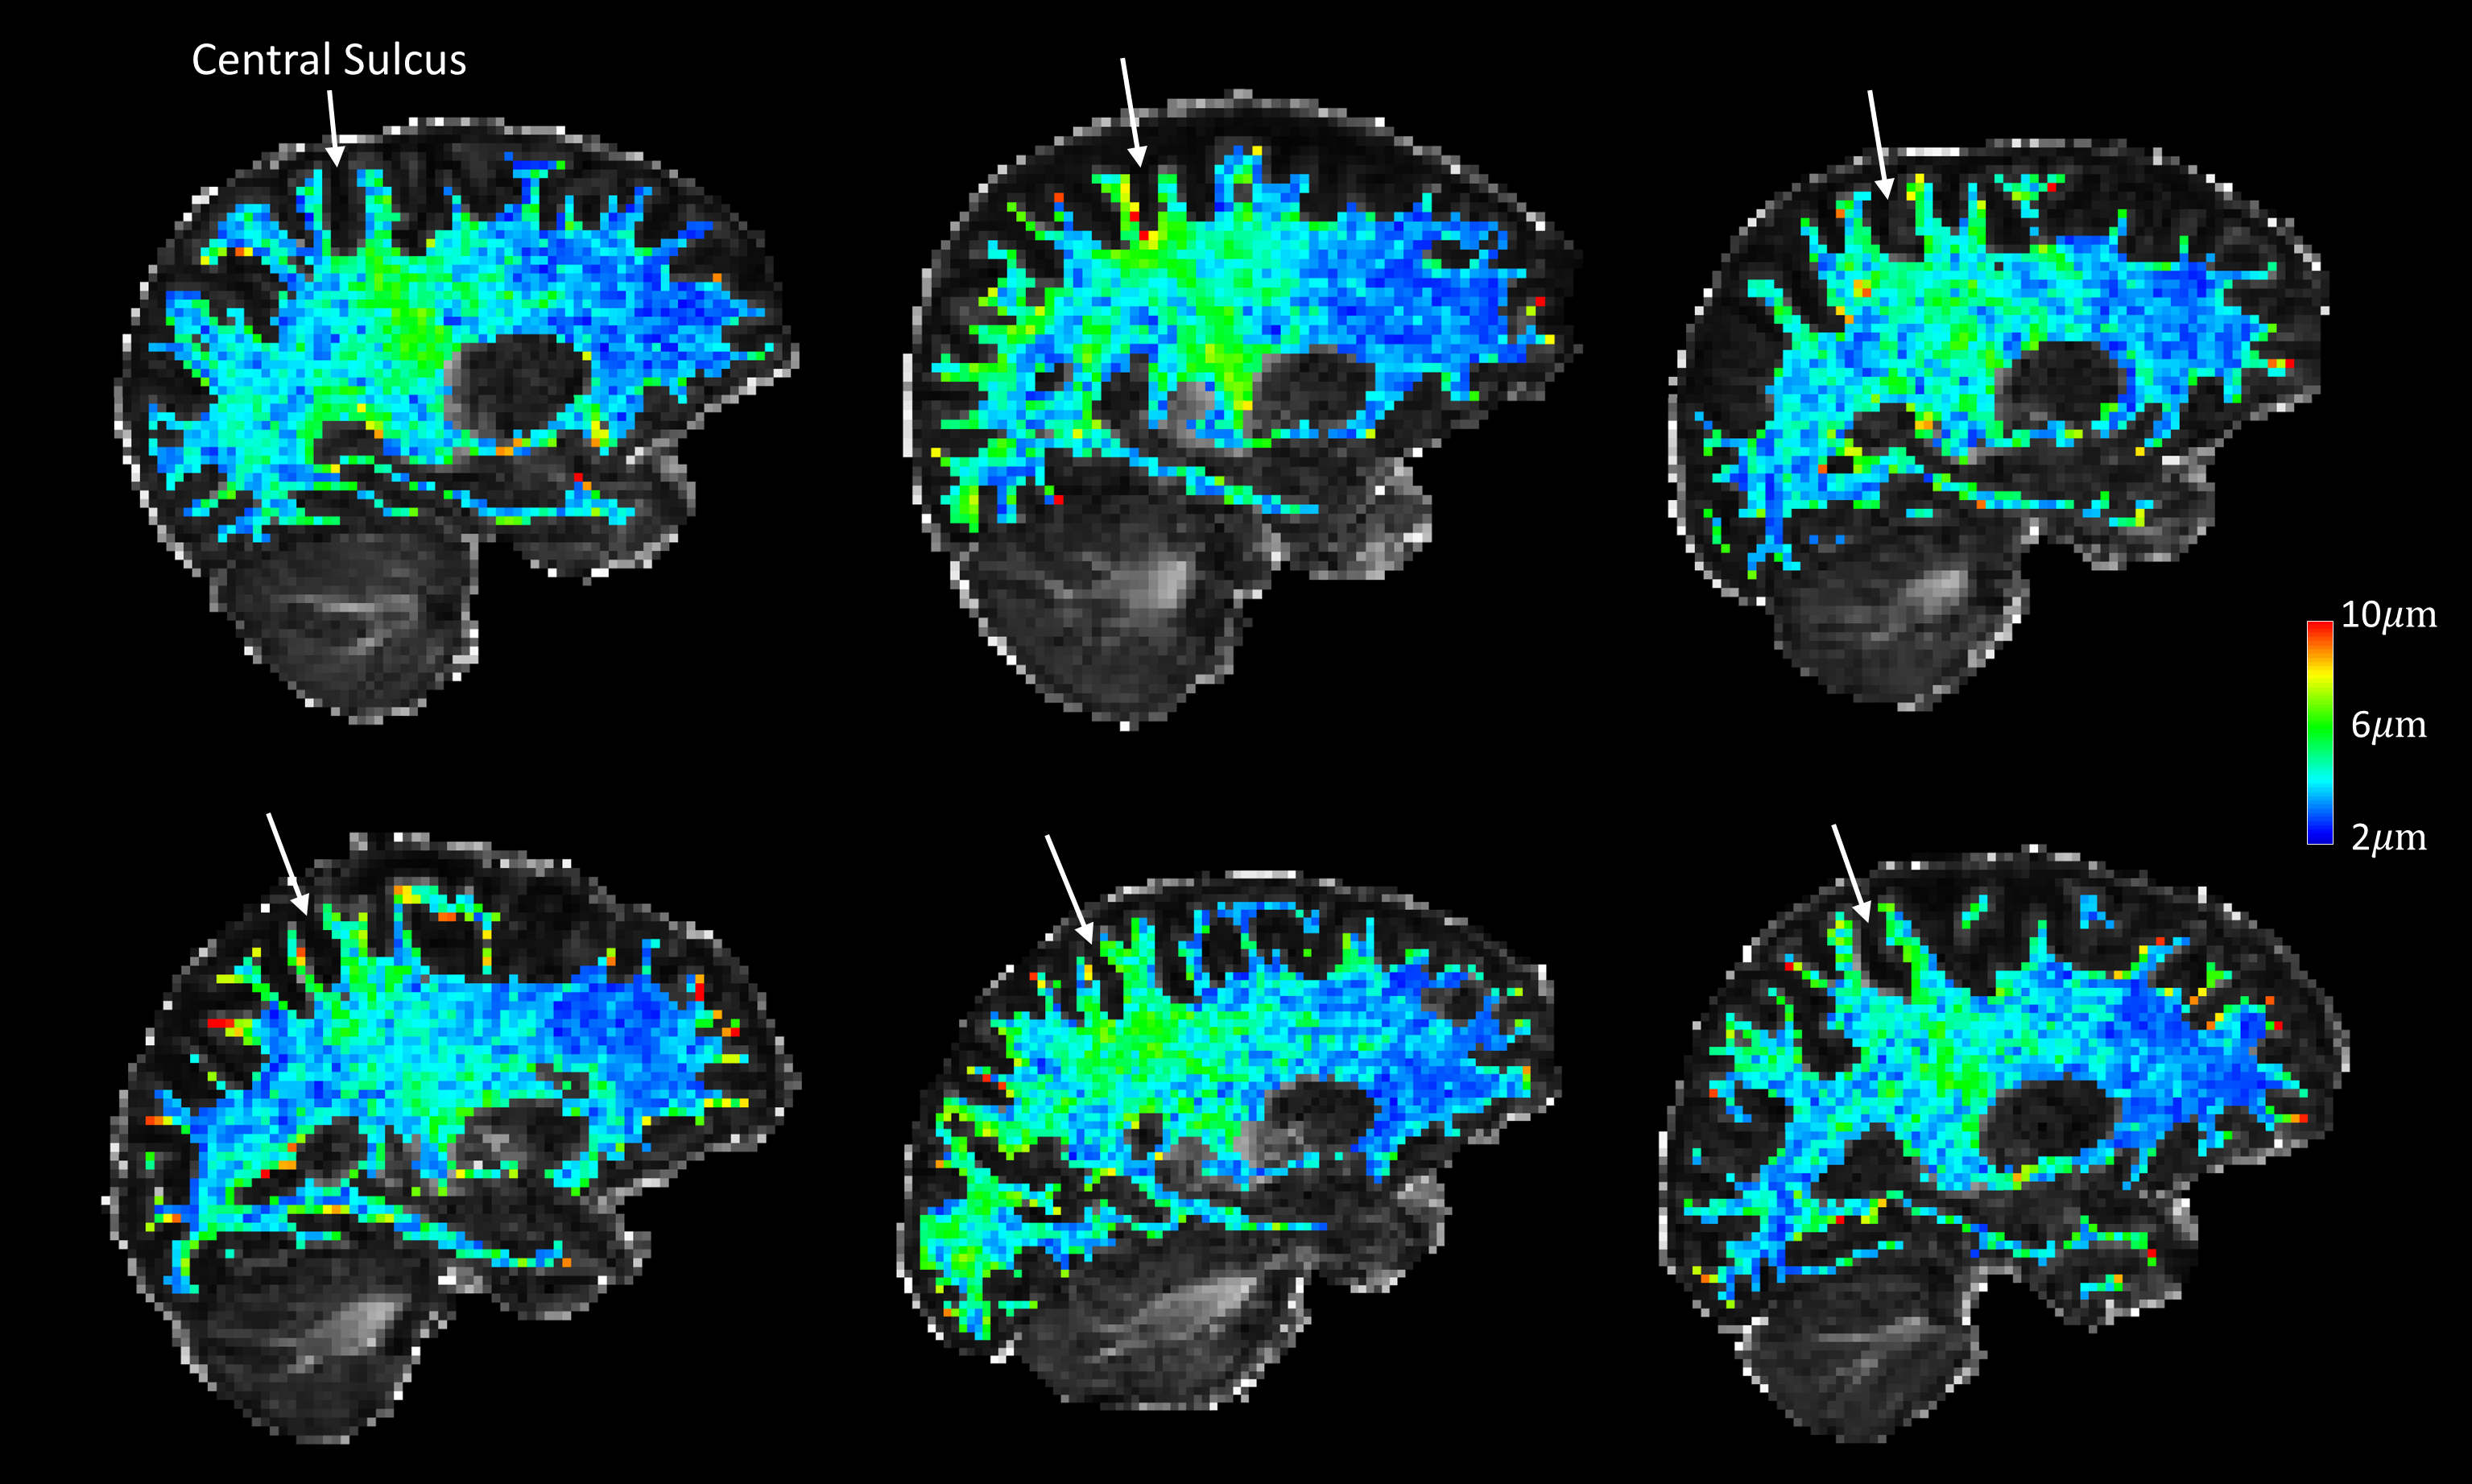
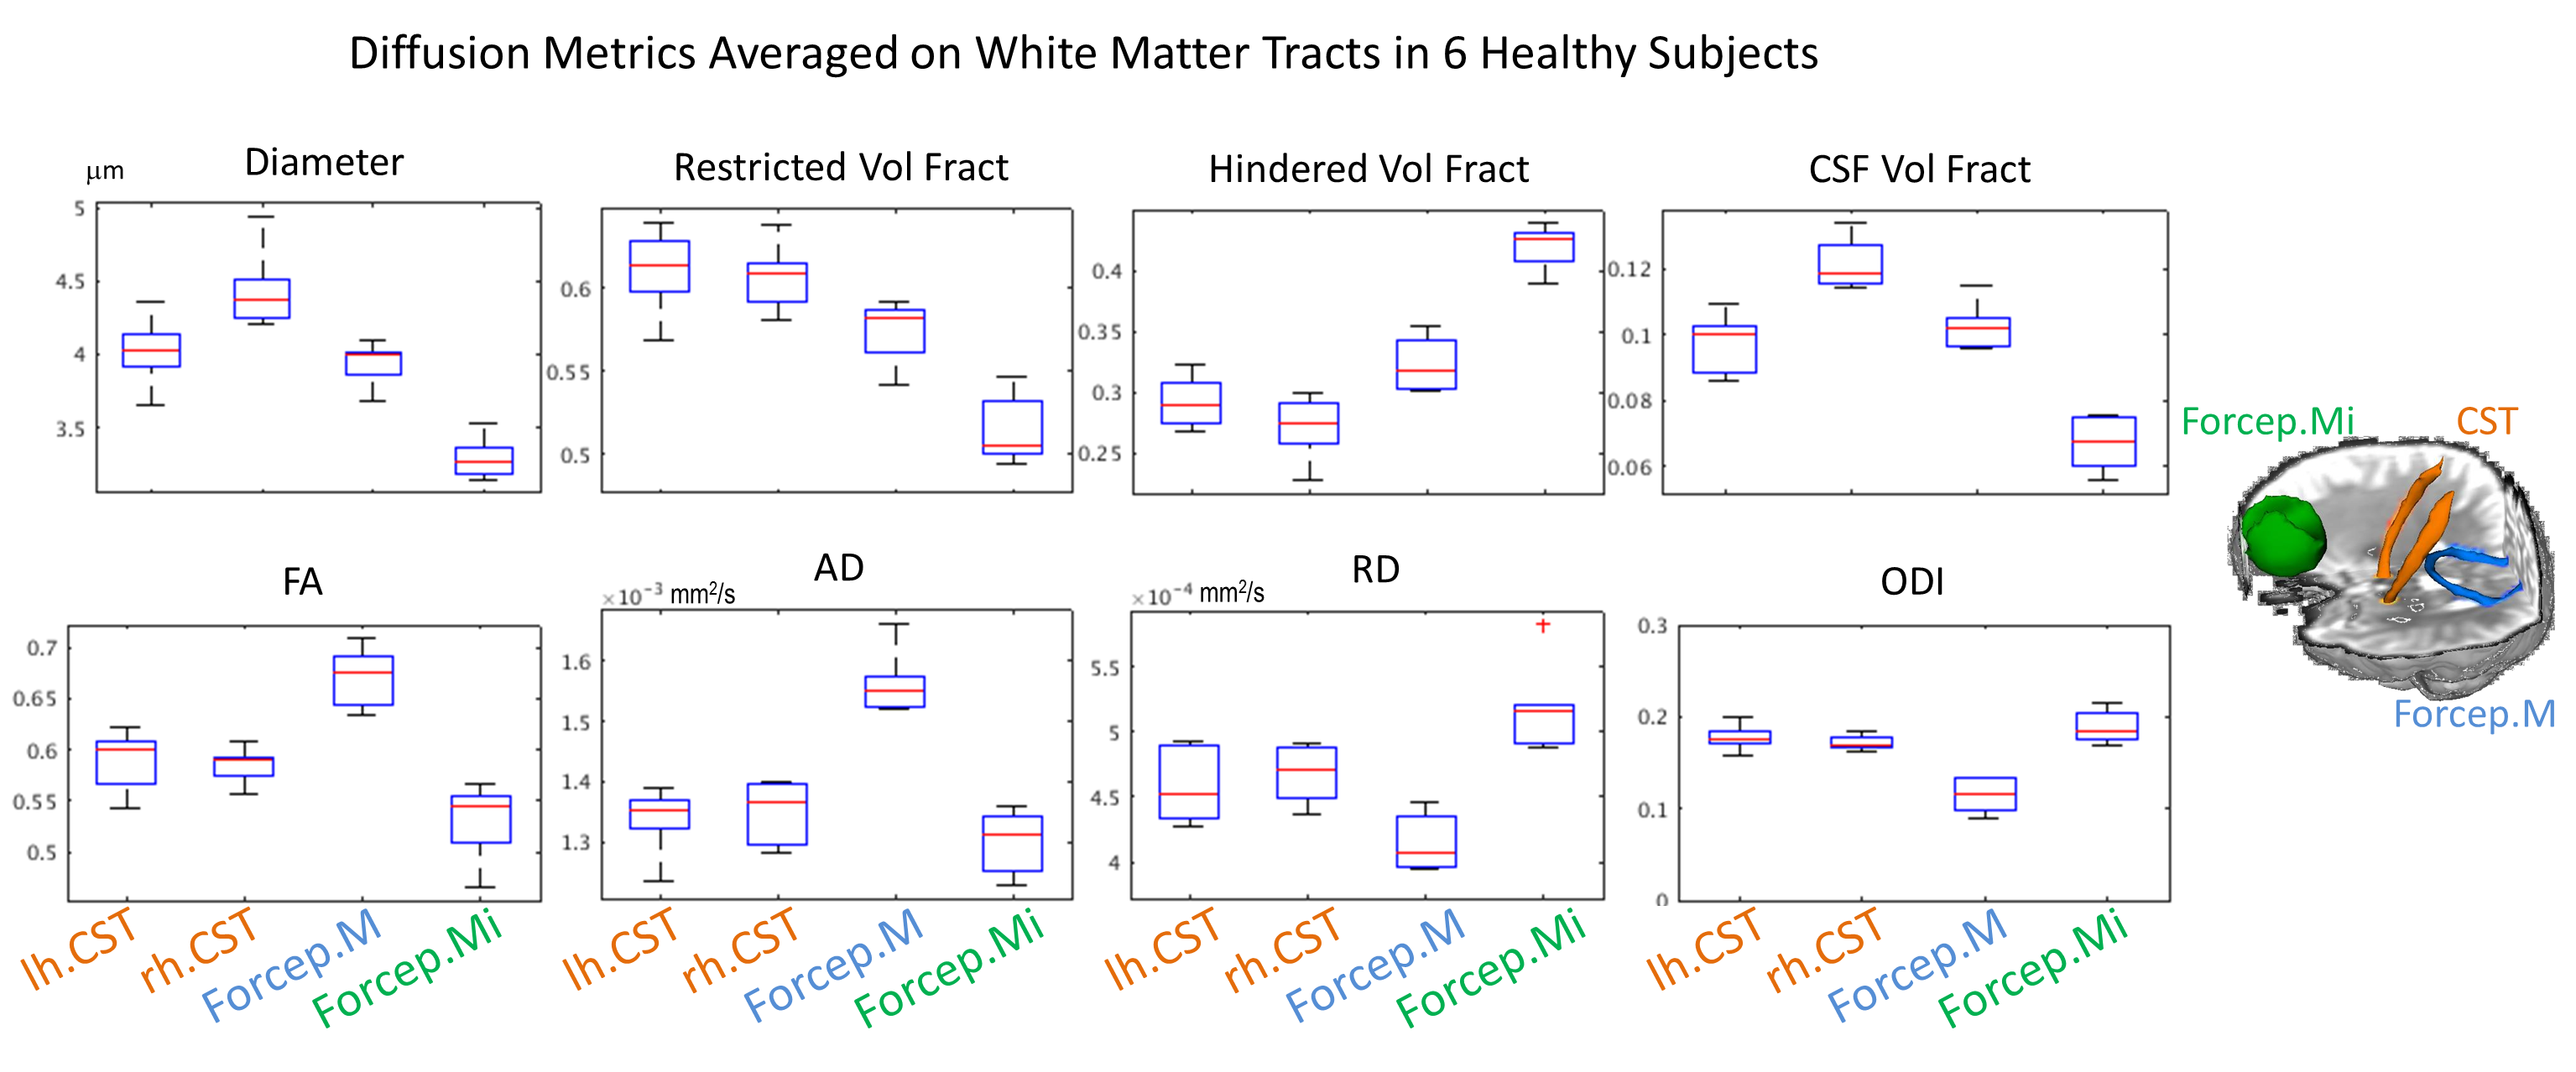
The spherical mean approach showed robust estimation of restricted volume fraction and was able to differentiate fibers>4um for restricted volume fractions>0.5 (Figure 2). Axon diameter maps for 6 healthy subjects illustrated the consistency of axon diameter estimation in different brain regions (Figure 3). For example, the corticospinal tracts showed larger axon diameters while the frontal lobe showed smaller axon diameters, in agreement with histology findings[17]. Figure 4 shows boxplots quantifying differences in microstructural metrics in select fiber tracts. The microstructural metrics for axonal size and volume fraction appeared to be relatively independent of orientation dispersion. Figure 5 shows the application of our method in a patient with MS. Within focal WM lesions, the restricted volume fraction decreased and hindered volume fraction and diffusivity increased, in contrast to CSF volume fraction, which remained similar to background WM in the lesions. Axon diameter within the lesions was heterogeneous, with the largest lesions showing increased diameter centrally and diameter more similar to surrounding non-lesioned white matter peripherally.Discussions and Conclusions
We propose a method for measurement of compartment size and volume fraction that is robust to fiber crossings. A major strength of the method is to resolve microstructural properties in the presence of complex fiber configurations without increasing the number of parameters to the signal model. SMT improves the SNR for axon diameter mapping by averaging over DW directions. In particular, the use of real-valued diffusion data is essential to unbiased estimates by suppressing noise floor buildup. Our current approach is limited by: 1) reporting the ensemble average of axon diameter and restricted volume fractions shared by multiple fiber bundles, thus lacking specificity for individual fiber tracts; and 2) limited resolution for small diameters (i.e., 2μm vs. 4μm).
In summary, our results indicate that we can estimate compartment size and restricted volume fraction without the inherent bias introduced by crossing structures. The approach can be applied to whole brain analyses to reveal microstructural abnormalities in pathology such as MS where the distribution of lesions in WM is heterogeneous.
Acknowledgements
This work was funded by an NIH Blueprint for Neuroscience Research Grant: U01MH093765, as well as NIH funding from NCRR P41EB015896, NIBIB R01EB006847, NIBIB R00EB015445, NINDS K23NS096056, NINDS K23NS078044, NIH/NCRR/NIBIB P41EB015896 and Instrumentation Grants S10-RR023401, S10-RR023043, and S10-RR019307. Funding support was also received from the National Multiple Sclerosis Society, the American Heart Association Postdoctoral Fellowship Award (17POST33670452), a Radiological Sciences of North America Research Resident Grant, the Conrad N. Hilton Foundation and the MGH Executive Committee on Research Fund for Medical Discovery Fellowship Award.References
1. Assaf, Y., et al., AxCaliber: a method for measuring axon diameter distribution from diffusion MRI. Magn Reson Med, 2008. 59(6): p. 1347-54.
2. Barazany, D., P.J. Basser, and Y. Assaf, In vivo measurement of axon diameter distribution in the corpus callosum of rat brain. Brain, 2009. 132(Pt 5): p. 1210-20.
3. Alexander, D.C., et al., Orientationally invariant indices of axon diameter and density from diffusion MRI. Neuroimage, 2010. 52(4): p. 1374-89.
4. Huang, S., et al. TractCaliber: Axon diameter estimation across white matter tracts in the in vivo human brain using 300 mT/m gradients. in In: Proc. 23rd Annual Meeting of the ISMRM. 2015. Toronto, Canada.
5. Kaden, E., et al., Multi-compartment microscopic diffusion imaging. Neuroimage, 2016. 139: p. 346-359.
6. Kaden, E., F. Kruggel, and D.C. Alexander, Quantitative mapping of the per-axon diffusion coefficients in brain white matter. Magn Reson Med, 2016. 75(4): p. 1752-63.
7. van Gelderen, P., C.T. Moonen, and J.H. Duyn, Susceptibility insensitive single shot MRI combining BURST and multiple spin echoes. Magn Reson Med, 1995. 33(3): p. 439-42.
8. Panagiotaki, E., et al., Compartment models of the diffusion MR signal in brain white matter: a taxonomy and comparison. Neuroimage, 2012. 59(3): p. 2241-54.
9. Setsompop, K., et al., Pushing the limits of in vivo diffusion MRI for the Human Connectome Project. Neuroimage, 2013. 80: p. 220-33.
10. Eichner, C., et al., Real diffusion-weighted MRI enabling true signal averaging and increased diffusion contrast. Neuroimage, 2015. 122: p. 373-84.
11. Cook, P.A., et al. Camino: Open-Source Diffusion-MRI Reconstruction and Processing. in Proc. ISMRM. 2006. Seattle.
12. Hall, M.G. and D.C. Alexander, Convergence and parameter choice for Monte-Carlo simulations of diffusion MRI. IEEE Trans Med Imaging, 2009. 28(9): p. 1354-64.
13. Andersson, J.L., S. Skare, and J. Ashburner, How to correct susceptibility distortions in spin-echo echo-planar images: application to diffusion tensor imaging. Neuroimage, 2003. 20(2): p. 870-88.
14. Andersson, J.L. and S.N. Sotiropoulos, An integrated approach to correction for off-resonance effects and subject movement in diffusion MR imaging. Neuroimage, 2016. 125: p. 1063-78.
15. Andersson, J.L.R., et al., Incorporating outlier detection and replacement into a non-parametric framework for movement and distortion correction of diffusion MR images. Neuroimage, 2016. 141: p. 556-572.
16. Mori, S., et al., Stereotaxic white matter atlas based on diffusion tensor imaging in an ICBM template. Neuroimage, 2008. 40(2): p. 570-82.
17. Tomasi, S., R. Caminiti, and G.M. Innocenti, Areal differences in diameter and length of corticofugal projections. Cereb Cortex, 2012. 22(6): p. 1463-72.
Figures