5243
Quantification of white matter pathologies by a diffusion MRI technique modeling both intra- and extra-axonal compartments1Biomedical Engineering, Washington University in St. Louis, st louis, MO, United States, 2Radiology, Washington University School of Medicine, St louis, MO, United States, 3Radiology, Washington University School of Medicine, St Louis, MO, United States
Synopsis
A new diffusion MRI histology (D-Histo) is proposed to model both intra- and extra-axonal diffusion as well as isotropic diffusion components within an image voxel. Both Monte-Carlo simulation, in vivo MRI of EAE mouse optic nerve, and post-MRI histology were used to validate this approach. The intra-axonal fraction derived from D-Histo more accurately assessed fiber fraction, and the intra-axonal axial diffusivities (AD) it derives more sensitively reflected axonal injury.
Introduction
Diffusion-weighted imaging (DWI) is a widely used method for non-invasive investigation of white matter disease such as multiple sclerosis (MS)1-3. We have previously developed diffusion basis spectrum imaging (DBSI)3 to distinguish the co-existing pathologies in both patient and animal models of MS1. However, DBSI models both the intra- and extra-axonal diffusion as one anisotropic tensor, which fails to distinguish intra- and extra-axonal diffusion characteristics. In this work, we propose diffusion MRI histology (D-Histo) to model independently intra- and extra-axonal diffusion compartments. Both in silico simulation and experimental measurements suggested that D-Histo can be used to better estimate the fiber fraction in complicated pathological environment and provided an improved biomarker of axonal loss in disease than previously developed DBSI.Material and Methods
D-Histo: The model adopts a tissue model that distinguishes three types of microstructural environment in an image voxel: 1) intra-axonal diffusion 2) surrounding extra-axonal diffusion3) isotropic diffusion with various diffusivities. The full normalized signal S can be described by the equation: $$$ s_N=\sum^{N_{Aniso}}_{i=1}{f_{i_{intra}}}e^{-\left|\overrightarrow{b_N}\right|\left({\lambda }_{||i\_intra}\right){cos}^2{\theta }_{i,N}}+\sum^{N_{Aniso}}_{i=1}{f_{i_{extra}}}{e^{-\left|\overrightarrow{b_N}\right|{\lambda }_{\bot i\_extra}}e}^{-\left|\overrightarrow{b_N}\right|\left({\lambda }_{||i\_extra}-{\lambda }_{\bot i\_extra}\right){cos}^2{\theta }_{i,N}}+\int^b_a{f\left(D\right)}e^{-\left|{\overrightarrow{b}}_N\right|.D}d\left(D\right)\ \ $$$
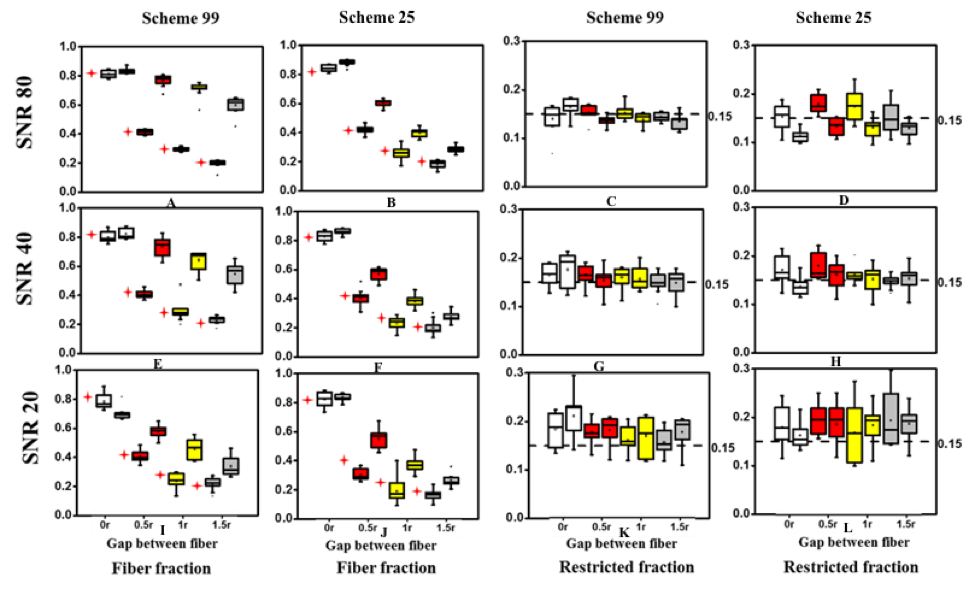
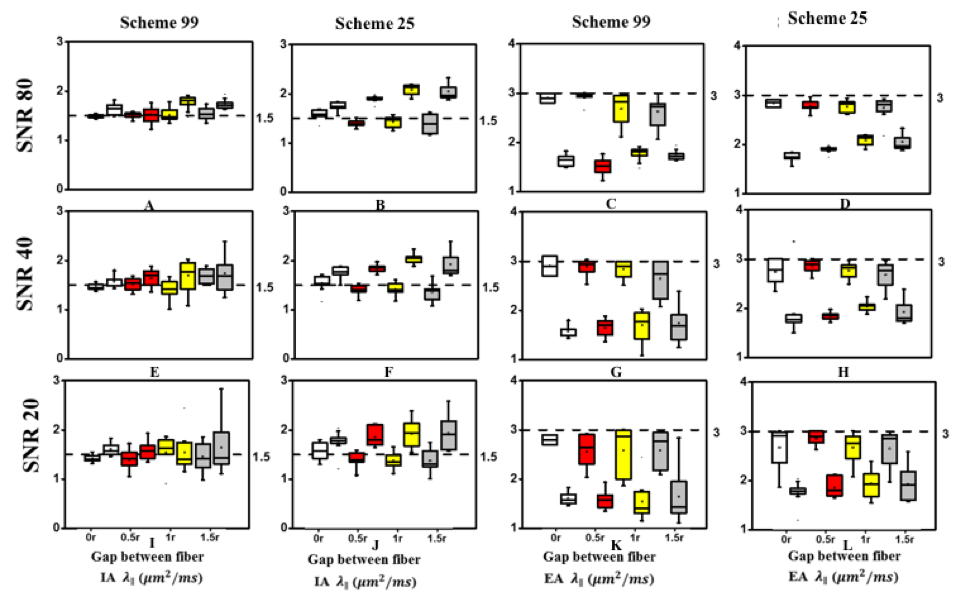
Monte-Carlo simulation: The simulation was performed by allowing water molecules (1 × 10⁶, initially randomly distributed)to undergo random walk in an unlimited simulated optic nerve model space. The size of the axon and cells were adapted according to literature2. The number of water molecules inside cells (other than axons) is fixed at 15% of total spins. Axonal loss was mimicked by increasing the gap between axons, gap = 0, 0.5, 1, 1.5 axon radius. Diffusivity for free water was set to be 1.5 μm2/ms inside axon (mimicking axonal injury) and 3 μm2/ms outside. Simulation MRI parameters were corresponding to parameters used in the in vivo mouse optic nerve measurements. Rician noise was added to the diffusion MRI signal at three levels: SNR = 20, 40, and 80. Each simulation was performed 10 times with each combination of SNR and gaps.
EAE mouse model of optic neuritis: Eight 10-week-old female C57BL/6 EAE mice with optic neuritis3 were scanned. Images of mouse optic nerves were acquired at pre-onset, onset, and post-onset of acute EAE optic neuritis.
In-Vivo DWI: An actively decoupled volume (transmit)/surface (receive) coil pair was used for MRI excitation and signal reception. A multi-echo spin-echo diffusion-weighted sequence4 with the 25-direction6 diffusion-encoding scheme combined with one b = 0 was employed. Acquisition parameters of MRI scanning were TR of 1.5 s, TE of 37ms, Δ =18ms, δ = 6 ms, max. b-value 2200 s/mm2. Slice thickness 0.8 mm, and in-plane resolution 117 μm×117μm (before zerofilled).
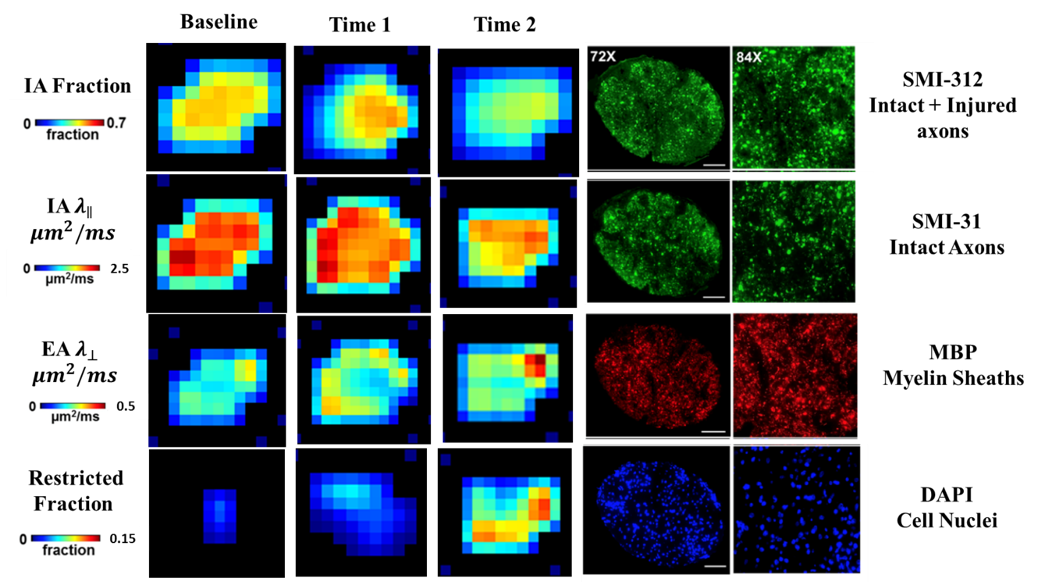
Immunohistochemistry: Mice were perfusion fixed5 immediately after the in vivo diffusion MR measurements for immunohistochemical (IHC) staining, including SMI-312, MBP, DAPI, and SMI-31.
Data analysis: A lab-developed D-Histo and DBSI code was run on the diffusion weighted MR data.
Results and discussion
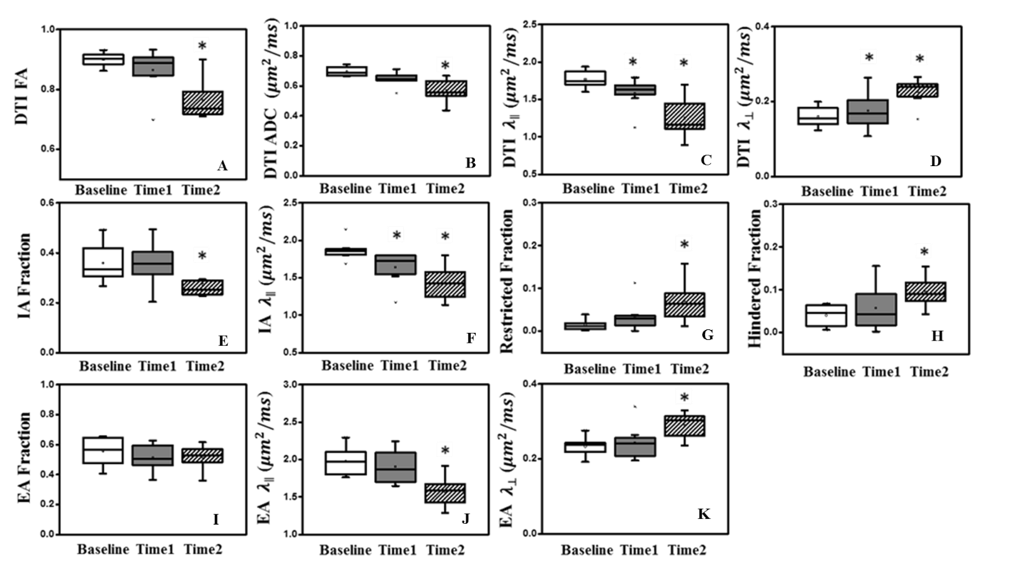
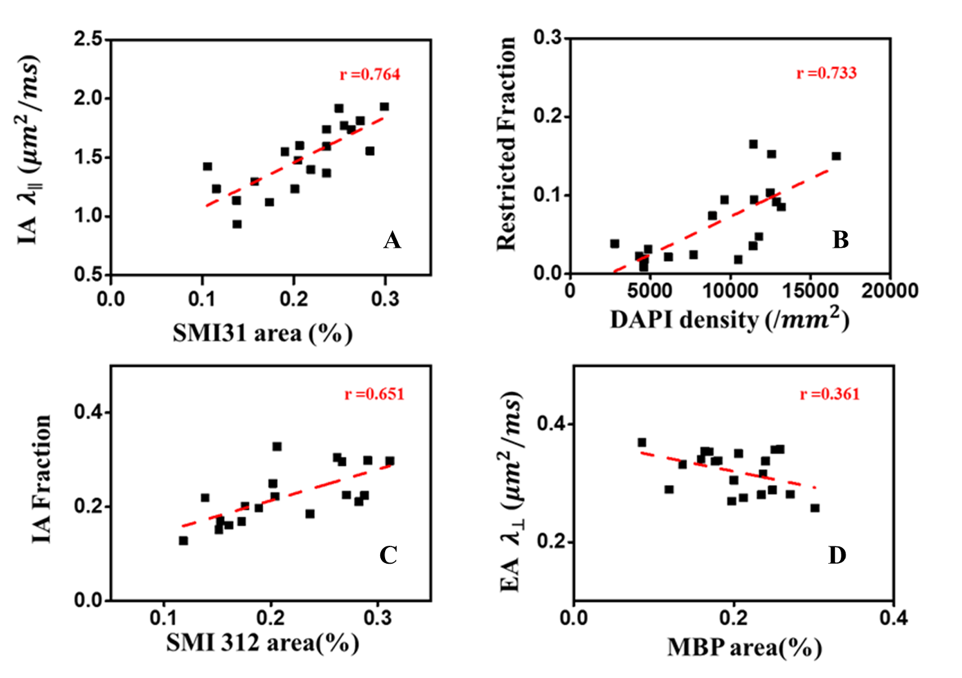
D-Histo modeling recovered the true fiber (Fig. 1A, B, E, F) and restricted (Fig. 1C, D, G, H, K, L) fractions from 25-directions diffusion encoded Monte-Carlo simulation data at SNR = 40. Different pathologies or structures were differentiated by their individual diffusion profiles through D-Histo analysis. Axon loss and injury can be correctly reflected by the D-Histo intra-axonal fraction (Fig. 1A, B, E, F), and the intra- and extra-axonal axial diffusivities (Fig. 2) in the presence of noise. D-Histo quantitatively differentiated and assessed multiple coexisting pathologies based on their unique diffusion signatures in EAE optic nerve accurately monitoring disease progression (Fig. 3E, F, G, J, K). Correlations between D-Histo metrics and individual histopathological components indicated that D-Histo is able to quantitatively assess coexisting pathology.Conclusion
D-Histo detected, distinguished, and quantified co-existing axonal pathologies in EAE mouse optic nerve at pre-onset, onset and post-onset of acute EAE optic neuritis, as confirmed by post-MRI quantitative IHC. D-Histo can monitor disease progression by quantifying the extent of axonal injury, demyelination, inflammation, and irreversible axonal loss. Monte-Carlo simulations also confirmed D-Histo utilities.Acknowledgements
This work was supported in part by NIH R01-NS047592, P01-NS059560, U01-EY025500, National Multiple Sclerosis Society (NMSS) RG 4549A4/1, RG-1507-05315.References
1. Wang Y, Wang Q, Song SK et al. Quantification of increased cellularity during inflammatory demyelination. Brain. 2011; 134: 3590–601.
2. Stanisz, G.J., Szafer, A., Wright, G.A.et al., 1997. An analytical model of restricted diffusion in bovine optic nerve. Magn. Reson. Med. 37(1997), 103–111.
3. Chiang CW, Wang Y, Sun P et al. Quantifying white matter tract diffusion parameters in the presence of increased extra-fiber cellularity and vasogenic edema. Neuroimage. 2014; 101:310–9.
4. Tu TW, Budde MD, Xie M et al. Phasealigned multiple spin-echo averaging: a simple way to improve signal-tonoise ratio of in vivo mouse spinal cord diffusion tensor image. Magn Reson Imaging. 2014;32: 1335–43
5. Blewitt ES, Pogmore T, Talbot IC. Double embedding in agar/paraffin wax as an aid to orientation of mucosal biopsies. J Clin Pathol. 1982; 35: 365.
6. Stanisz, G.J., Szafer, A., Wright, G.A.et al. 1997. An analytical model of restricted diffusion in bovine optic nerve. Magn. Reson. Med. 37(1997), 103–111.
Figures