5241
Revised NODDI model for diffusion MRI data with multiple b-tensor encodings1SAIMLAL, Sapienza, università di Roma, Rome, Italy, 2Institute for Complex Systems, CNR, Rome, Italy, 3Clinical Sciences Lund, Department of Radiology, Lund University, Lund, Sweden, 4Random Walk Imaging AB, Lund University, Lund, Sweden, 5Clinical Sciences Lund, Department of Medical Radiation Physics, Lund University, Lund, Sweden, 6Department of Computer Science & Centre for Medical Image Computing, University College London, London, United Kingdom
Synopsis
This work proposes a revision of the NODDI model to relate brain tissue microstructure to the new generation of diffusion MRI data with multiple b-tensor encodings. NODDI was developed originally for conventional multi-shell diffusion data acquired with linear tensor encoding (LTE). While adequate for LTE data, it has been shown to be incompatible with data using spherical tensor encoding (STE). We embed a different set of assumptions in NODDI, while retaining the tortuosity constraint, to accommodate both LTE and STE data. Experiments with human data with multiple b-tensor encodings confirm the efficacy of the revision.
Introduction
We present a revised NODDI model for relating neuronal tissue microstructure to diffusion MRI (dMRI) data with multiple b-tensor encodings1,2. NODDI was originally developed to infer various indices of neurite morphology from conventional multi-shell dMRI measurements. The model has had a rapid uptake in the past years3-8 due to its relative simplicity and feasibility for explaining data from now widely-adopted two-shell acquisitions. However, its simplicity has relied on imposing several constraints. While these constraints have not prevented the model from explaining conventional data, they were shown to impede the model’s ability to describe measurements with multiple b-tensor encodings9. This work proposes revision to accommodate this new generation of data.Methods
Modelling
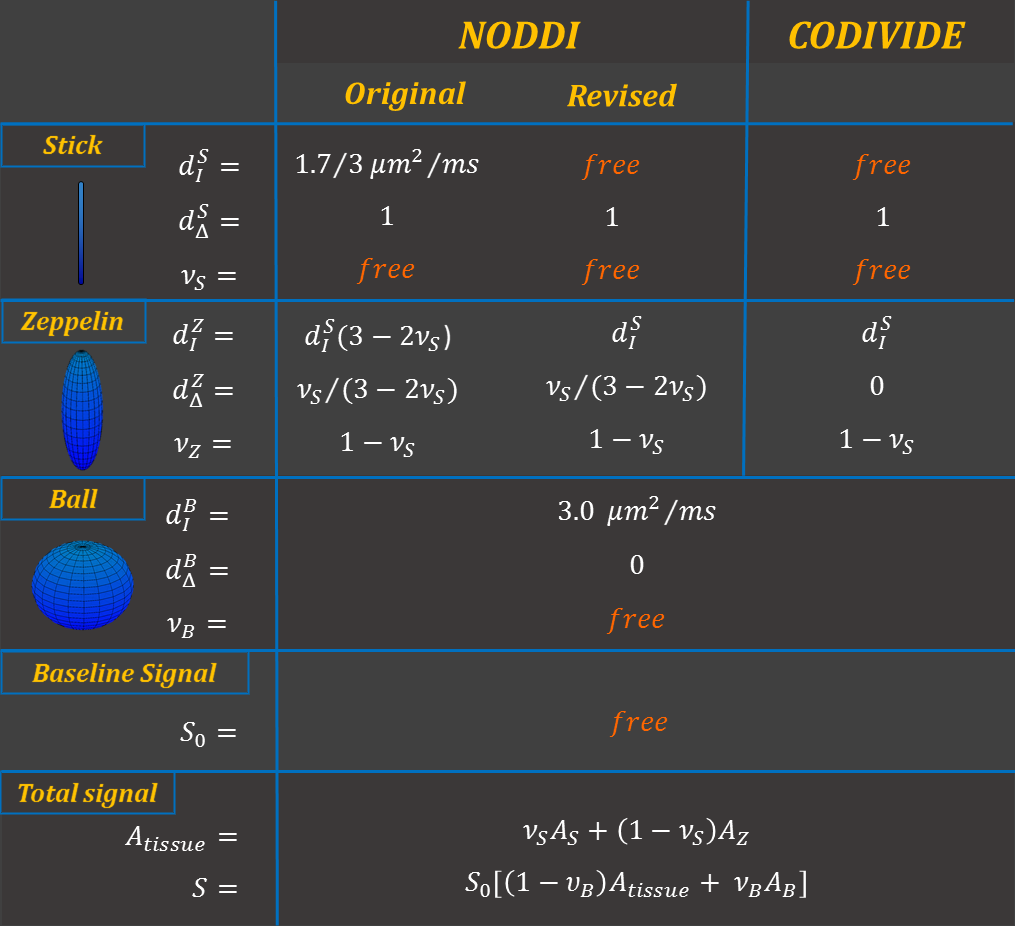
The proposed revision (Figure 1) inherits most of NODDI’s original features. It remains a three-compartment model, including two compartments for tissue: a stick (impermeable zero-radius cylinder), representing the intra-neurite space; a zeppelin (cylindrically symmetric tensor), describing the extra-neurite space. The third compartment is a ball (spherical tensor), representing free water contamination.
Two changes were made to support both conventional data, acquired with what is known as linear tensor encoding (LTE) in the terminology of b-tensor encoding, and data with spherical tensor encoding (STE)10-12. In particular, the new model aims to be compatible with the empirical observation, from STE data, that the stick and zeppelin compartments have similar isotropic diffusivities9. First, we forgo the original assumption that the bulk diffusivities of stick and zeppelin are identical. This, together with the tortuosity constraint imposed to relate the radial diffusivity of the zeppelin to its bulk diffusivity, prevents the two compartments to share a common value of isotropic diffusivity. Second, we instead assume that the isotropic diffusivities of the tissue compartments are identical and designate this shared quantity as a new parameter, in place of the shared bulk diffusivity assumed in the original model. This new parameter will be estimated from data with multiple b-tensor encodings directly.
The revised model is distinct from the CODIVIDE model9 by retaining the tortuosity constraint to induce diffusion anisotropy in the extra-neurite space, without increasing model complexity3,9,13.
Data
We used data from four healthy volunteers acquired with both LTE and STE on a 3T MAGNETOM Prisma (Siemens Healthcare GmbH, Erlangen, Germany) with a prototype spin-echo sequence that enables variable b-tensor encoding. Imaging parameters were: TR=7s, TE=90ms, resolution 2x2x2mm3, b=(100,500,1000,1500,2000) s/mm2, number of gradient directions=6,10,12,16,20. Gradient waveforms were Maxwell-compensated14 and optimized numerically12.
Analysis
Following motion and eddy-current distortion correction15, the revised NODDI was fitted to the powder-averaged data as described previously9. For comparison, the data was also fitted to CODIVIDE; the LTE data to the original NODDI. To determine the regional variation of parameter estimates, we segmented the brain parenchyma into grey matter (GM), white matter (WM) and CSF, with FAST16.
Results
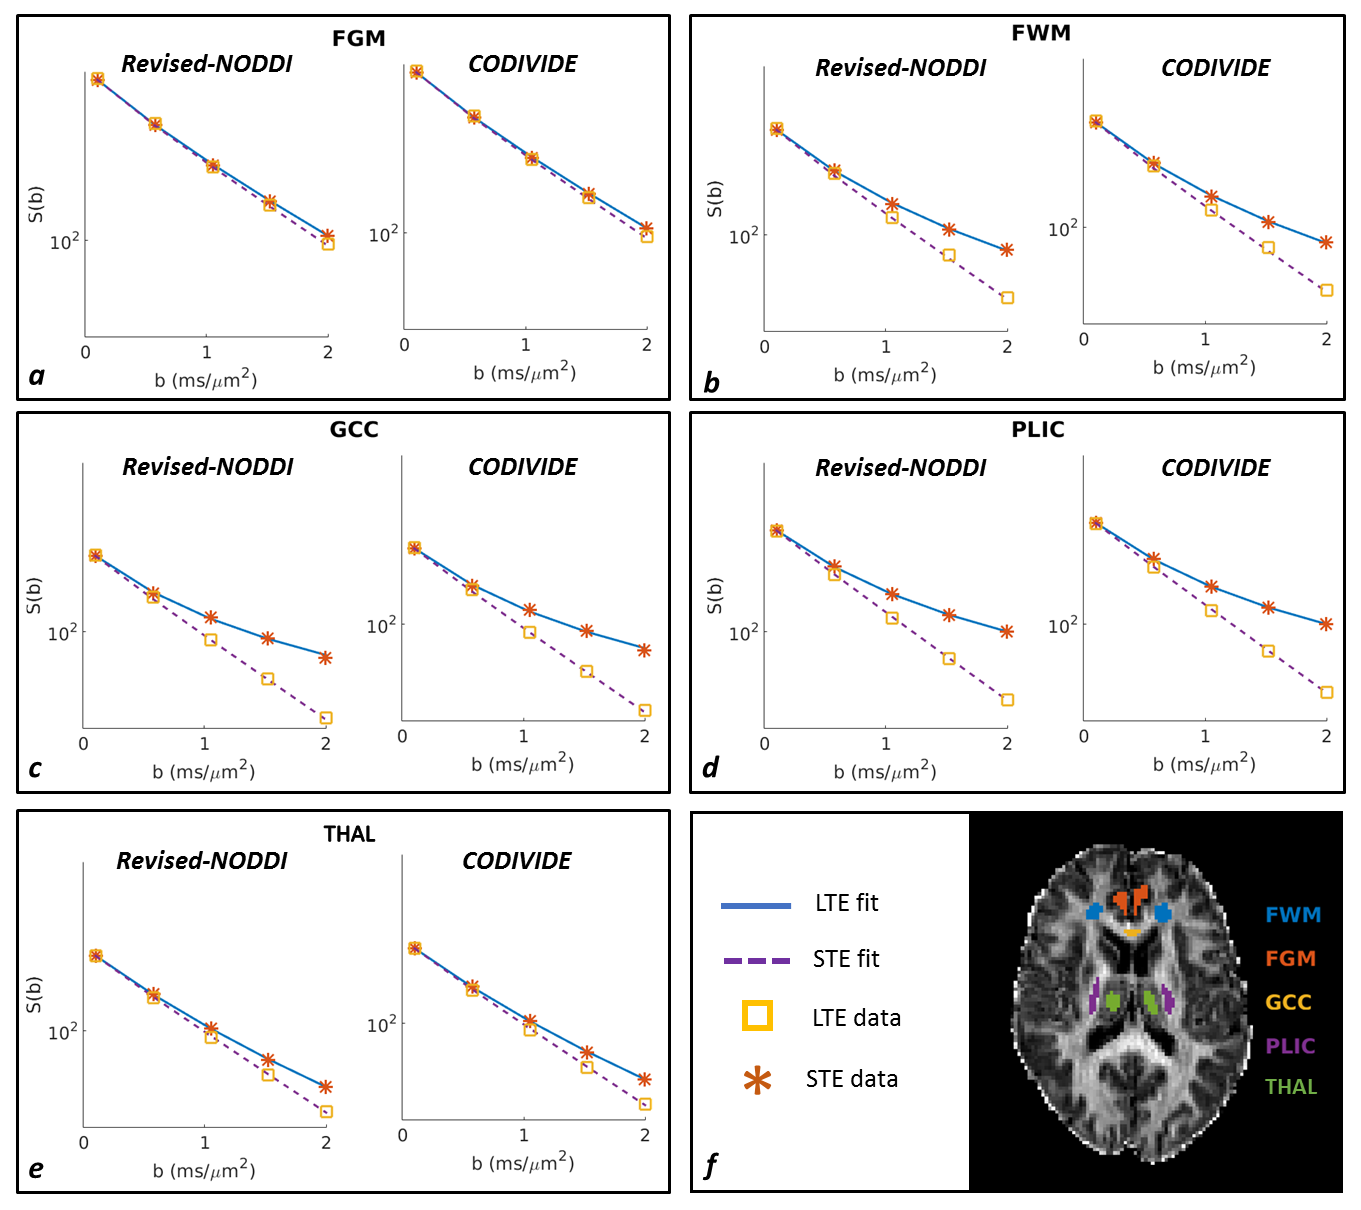
Figure 2 shows qualitatively that the revised NODDI can explain LTE and STE data equally well, in both GM and WM regions, comparable to CODIVIDE, which has been specifically designed for this purpose.
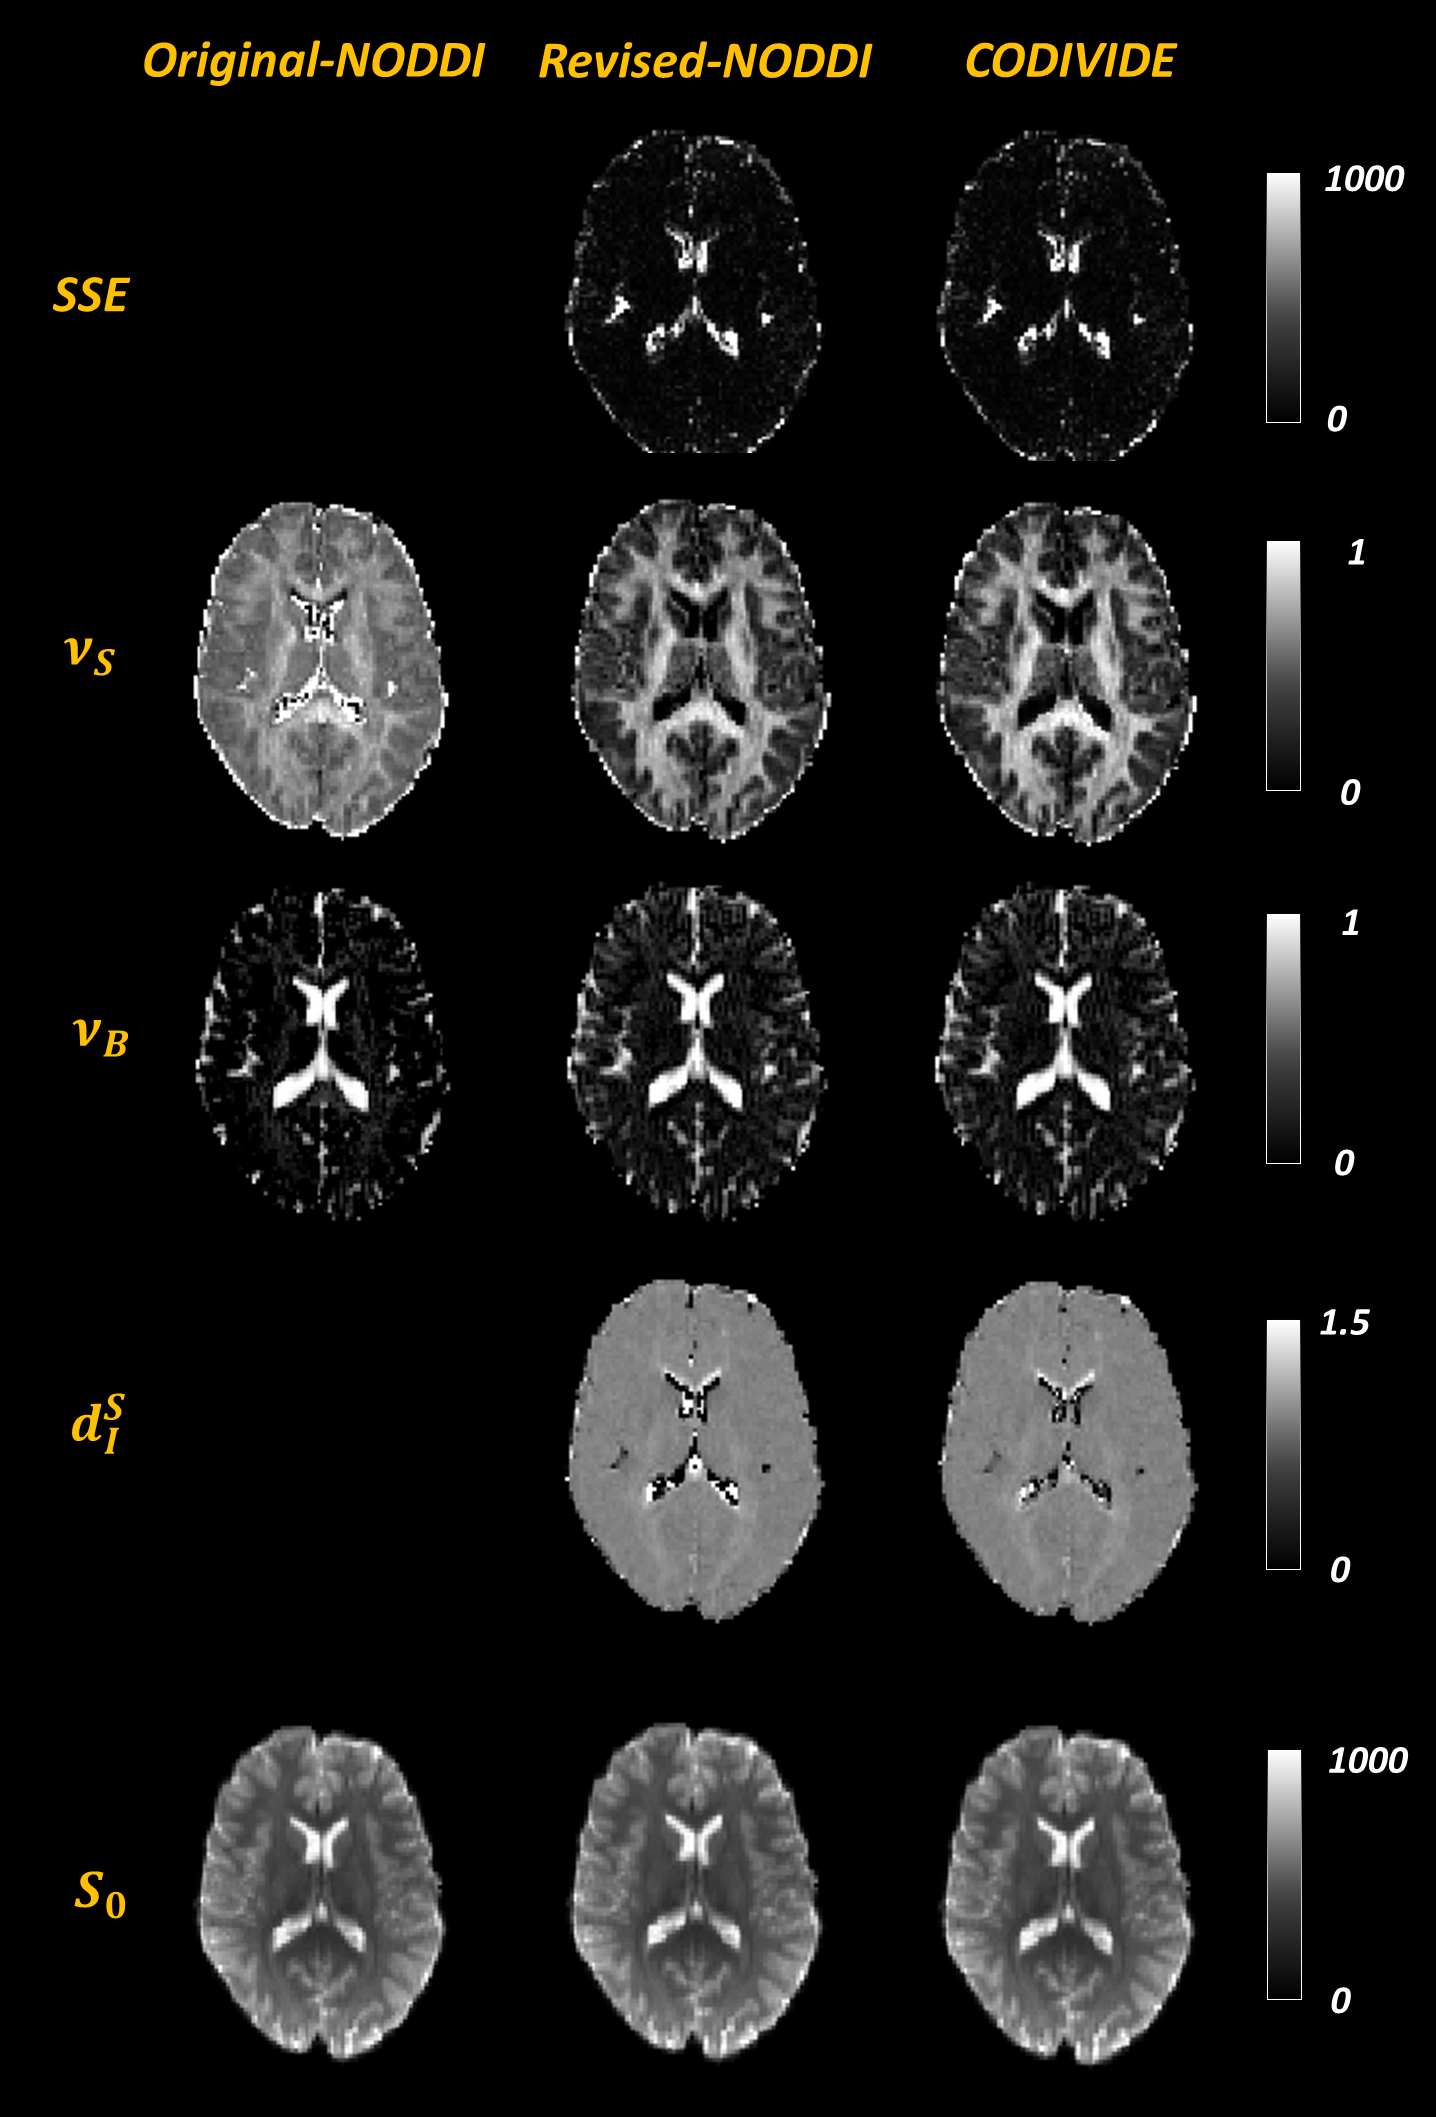
Figure 3 confirms that the two models explain the data similarly well over a representative slice, with the sum-of-squared errors (SSE) of fitting, given that the models have the same number of parameters. It also shows the parametric maps of the revised NODDI and CODIVIDE, which are visually very similar.
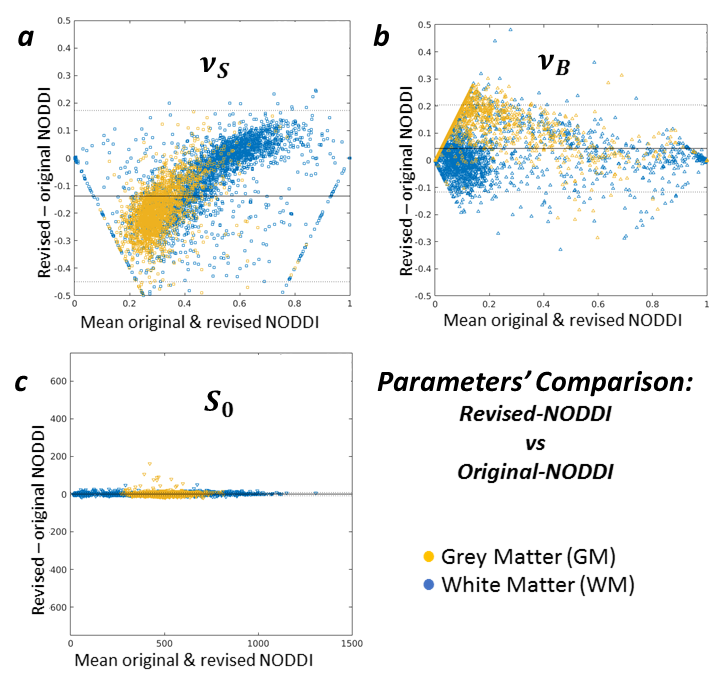
Figure 3 additionally shows the maps from fitting the original NODDI, but to LTE data only, revealing substantial differences in parameter values compared to the revised version, especially in GM. Figure 4 confirms this quantitatively.
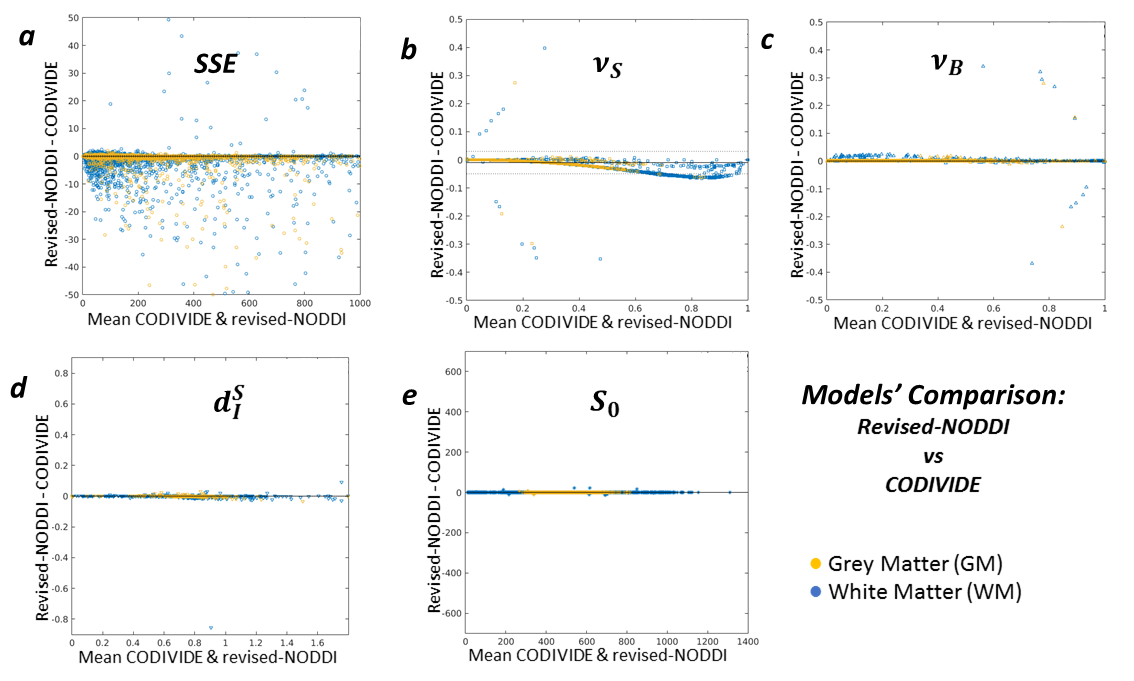
Figure 5 compares the revised NODDI and CODIVIDE quantitatively. Panel 5a shows that there are no statistically significant differences in fitting quality, assessed with a non-parametric Wilcoxon rank-signed test, separately for GM (p=0.86) and WM (p=0.53). Panel 5b reveals a slight but systematic difference in the estimated stick fractions between the models. Panels 5c-e confirm that all other parameter values are practically identical.
Discussion
We show that NODDI can be extended to data with multiple b-tensor encodings. A key finding is that this compatibility can be achieved by adopting a new assumption that the two tissue compartments share a common isotropic diffusivity, without forgoing the tortuosity constraint, as done in CODIVIDE.
Our results also show that, while the parameter estimates from the revised NODDI and CODIVIDE are nearly identical, the corresponding values from the original NODDI are substantially different, especially in GM. Independent histological assessment will be needed to inform the model choice in practice and the interpretation of the obtained parameters.
Acknowledgements
This work was supported by EPSRC (EP/L022680/1, EP/N018702/1).References
1 Westin, C.-F. et al. Q-space trajectory imaging for multidimensional diffusion MRI of the human brain. NeuroImage 135, 345-362 (2016).
2 Topgaard, D. Multidimensional diffusion MRI. Journal of magnetic resonance 275, 98-113 (2017).
3 Zhang, H., Schneider, T., Wheeler-Kingshott, C. A. & Alexander, D. C. NODDI: practical in vivo neurite orientation dispersion and density imaging of the human brain. NeuroImage 61, 1000-1016, doi:10.1016/j.neuroimage.2012.03.072 (2012).
4 Billiet, T. et al. Age-related microstructural differences quantified using myelin water imaging and advanced diffusion MRI. Neurobiology of aging 36, 2107-2121, doi:10.1016/j.neurobiolaging.2015.02.029 (2015).
5 Chang, Y. S. et al. White matter changes of neurite density and fiber orientation dispersion during human brain maturation. PloS one 10, e0123656 (2015).
6 Churchill, N. W., Caverzasi, E., Graham, S. J., Hutchison, M. G. & Schweizer, T. A. White matter microstructure in athletes with a history of concussion: Comparing diffusion tensor imaging (DTI) and neurite orientation dispersion and density imaging (NODDI). Human brain mapping (2017).
7 Cox, S. R. et al. Ageing and brain white matter structure in 3,513 UK Biobank participants. Nature communications 7, 13629 (2016).
8 Deligianni, F., Carmichael, D. W., Zhang, G. H., Clark, C. A. & Clayden, J. D. NODDI and Tensor-Based Microstructural Indices as Predictors of Functional Connectivity. PloS one 11, e0153404 (2016).
9 Lampinen, B. et al. Neurite density imaging versus imaging of microscopic anisotropy in diffusion MRI: A model comparison using spherical tensor encoding. NeuroImage 147, 517-531 (2017).
10 Wong, E. C., Cox, R. W. & Song, A. W. Optimized isotropic diffusion weighting. Magnetic resonance in medicine 34, 139-143 (1995).
11 Eriksson, S., Lasic, S. & Topgaard, D. Isotropic diffusion weighting in PGSE NMR by magic-angle spinning of the q-vector. Journal of magnetic resonance 226, 13-18 (2013).
12 Sjölund, J. et al. Constrained optimization of gradient waveforms for generalized diffusion encoding. Journal of magnetic resonance 261, 157-168 (2015).
13 Szafer, A., Zhong, J., Anderson, A. W. & Gore, J. C. Diffusion‐weighted imaging in tissues: theoretical models. NMR in biomedicine 8, 289-296 (1995).
14 Szczepankiewicz, F. N., M. Maxwell-compensated waveform design for asymmetric diffusion encoding. Submitted to: Proceedings of the International Society for Magnetic Resonance in Medicine (2018).
15 Nilsson, M., Szczepankiewicz, F., van Westen, D. & Hansson, O. Extrapolation-based references improve motion and eddy-current correction of high b-value DWI data: application in Parkinson’s disease dementia. PloS one 10, e0141825 (2015).
16 Zhang, Y., Brady, M. & Smith, S. Segmentation of brain MR images through a hidden Markov random field model and the expectation-maximization algorithm. IEEE transactions on medical imaging 20, 45-57 (2001).
17 Bland, J. M. & Altman, D. Statistical methods for assessing agreement between two methods of clinical measurement. The lancet 327, 307-310 (1986).
18 Eriksson, S., Lasič, S., Nilsson, M., Westin, C.-F. & Topgaard, D. NMR diffusion-encoding with axial symmetry and variable anisotropy: Distinguishing between prolate and oblate microscopic diffusion tensors with unknown orientation distribution. The Journal of chemical physics 142, 104201 (2015).
Figures