5240
Constrained analysis of b-tensor encoding diffusion data with multiple echo times allows estimation of compartment-specific T2 relaxation times in white matter.1Clinical Sciences Lund, Medical Radiation Physics, Lund University, Lund, Sweden, 2Random Walk Imaging AB, Lund, Sweden, 3Clinical Sciences Lund, Diagnostic Radiology, Lund University, Lund, Sweden, 4Physical Chemistry, Lund University, Lund, Sweden, 5Clinical Sciences Malmö, Clinical Memory Research, Lund University, Lund, Sweden
Synopsis
We used b-tensor encoding and multiple echo times to estimate the separate T2 relaxation times and apparent fractions of white matter compartments. Nineteen elderly subjects were imaged, and data were analyzed using a constrained ‘ball-and-stick’ diffusion-relaxation model. Results show that the ‘ball’ T2 relaxation time is inversely related to the fraction of ‘sticks’ in white matter lesions, and that the ‘stick’ T2 relaxation time may be sensitive to the axonal diameter. The approach could be useful to characterize white matter damage.
Introduction
Biophysical modeling in
diffusion MRI aims to estimate the volume fractions of cellular compartments. However,
multiple effects can bias this interpretation, including compartmental
differences in relaxation times. While such differences may be near negligible
in the healthy brain1-3, this cannot
be expected in conditions with increased extracellular water, such as ischemic
white matter lesions4. Estimation of compartment-specific relaxation
times could not only improve compartment fraction estimates, but also yield
additional microstructural information since relaxation times depend on the chemical
composition and surface-to-volume ratio of cellular structures5-6. However,
estimating specific relaxation times for tissue compartments is generally
challenging7. Here, we address
the issue by using a constrained ‘ball-and-stick’ model to analyze data
acquired with b-tensor encoding and multiple echo times (TE).Methods
Nineteen subjects (age 70±9 years, 6 females), thirteen of which had Parkinson’s disease, were examined on a MAGNETOM Prisma 3T system (Siemens Healthcare, Erlangen, Germany). A prototype spin-echo sequence was used to acquire data with both linear and spherical tensor encoding8-9, using TR/TE=5200/106 ms/ms and b=[0.1,0.5,1.0,1.5,2.0] ms/μm2 over up to 30 directions. Maxwell-compensated encoding waveforms10 were optimized numerically11. Additional data were acquired with linear b-tensors and multiple TE, using TR=6900 ms, TE=[50,85,120,155] ms and b=[0,0.5] ms/μm2. Image resolution was 2×2×4 mm3. Data were ‘powder-averaged’ across encoding directions8, and analyzed with a two-compartment ‘ball-and-stick’ model designed to capture compartment-specific T2 times in white matter. A connection between diffusion and relaxation was enforced by constraining the isotropic diffusivity of the ‘ball’ compartment using a tortuosity constraint: DI;B = 2.8(1 – fS) μm2/ms, where fS is the relaxation-corrected fraction of the ‘stick’ compartment. This fraction would ideally represent the axonal volume fraction, but is still a crude approximation due to MR invisible compartments like myelin and compartmental differences in water concentration. The isotropic diffusivity of sticks was fixed to 0.9 μm2/ms. Parameters maps were calculated within manually defined white matter masks. Parameters were extracted from regions of interest (ROIs) in white matter lesions and in normal white matter, comprising frontal white matter (FWM), the corticospinal tract (CST), and the corpus callosum (CC) genu, body and splenium. White matter lesions (WML) comprised ROIs placed in twenty-one lesions distributed among six subjects.Results
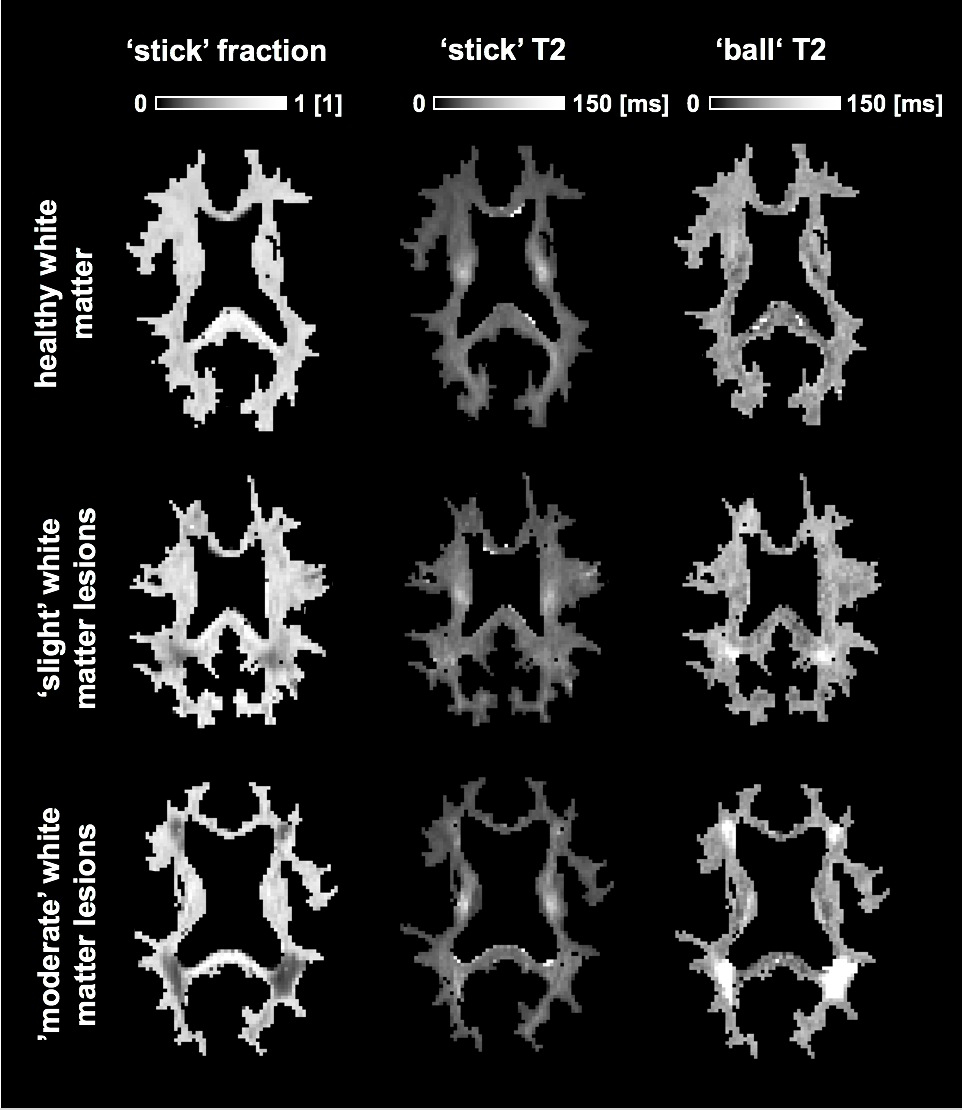
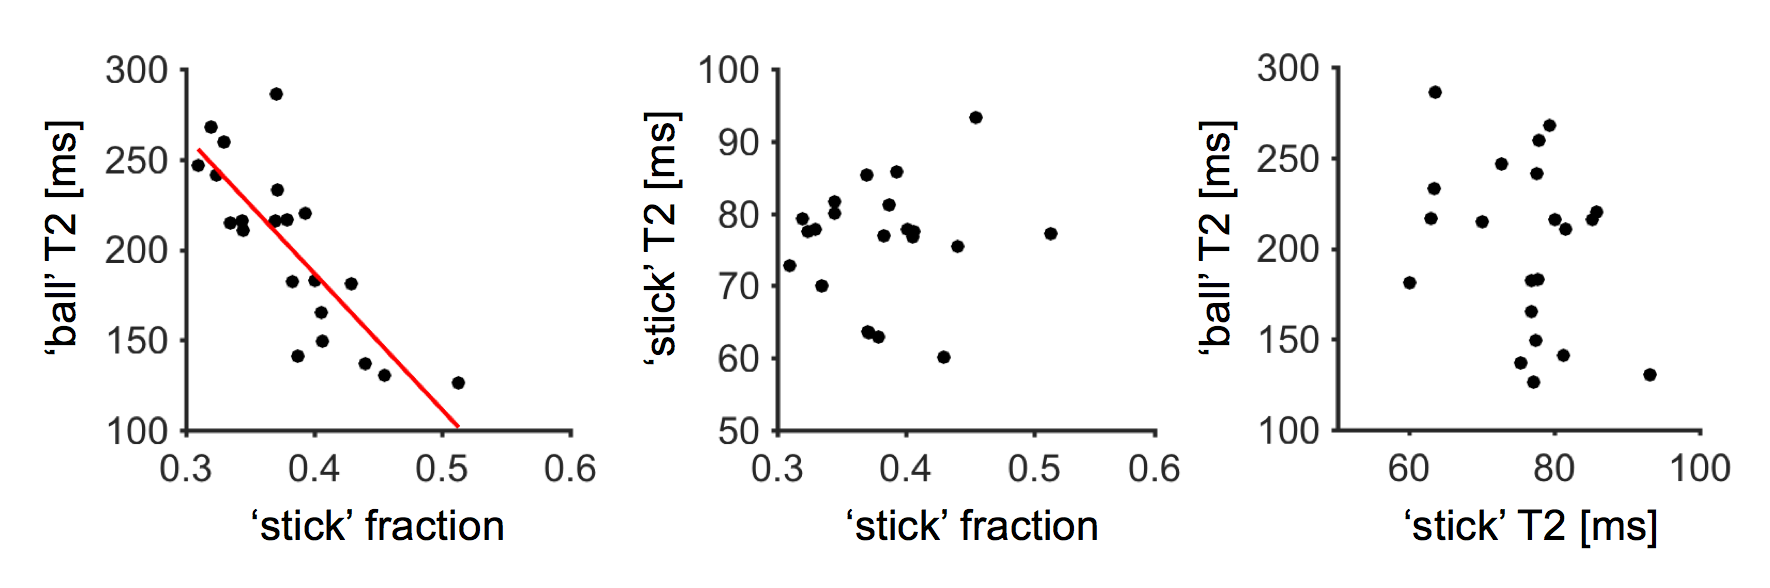
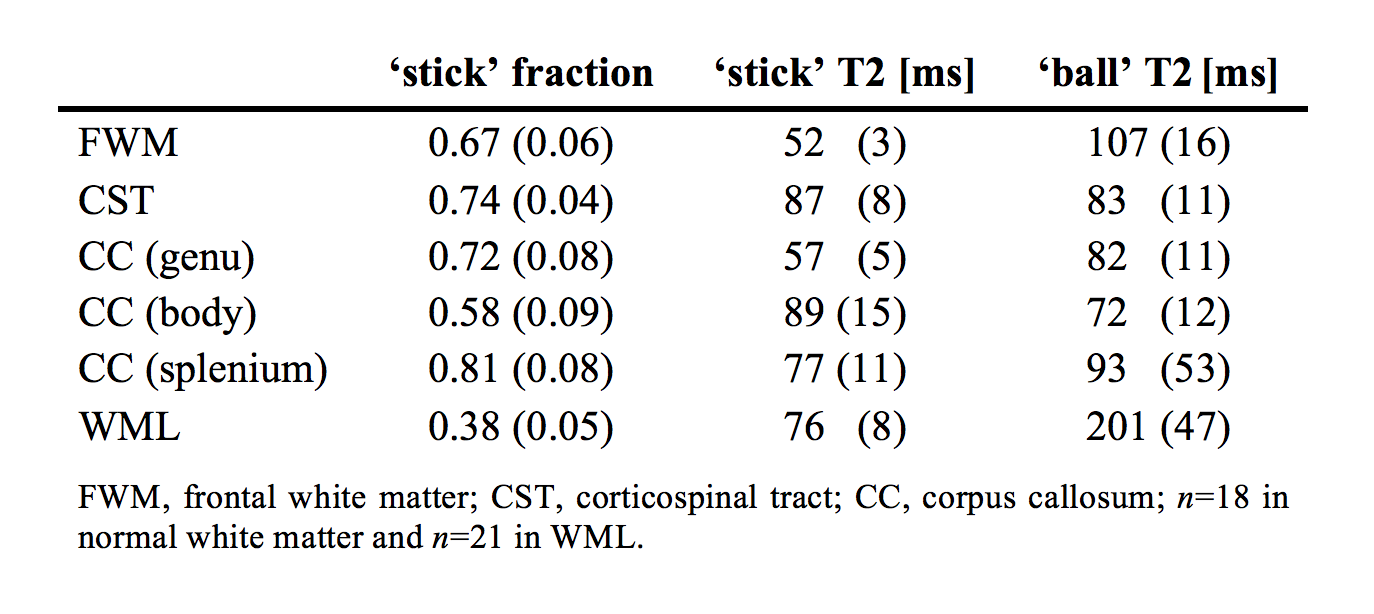
Figure 1 shows maps of the ‘stick’ fraction and the T2 relaxation times of the ‘stick’ and ‘ball’ compartments. Most maps featured a flat contrast across healthy white matter, but the corticospinal tract stood out with a longer T2 relaxation time of its ‘stick’ compartment and a shorter T2 time of its ‘ball’ compartment. In general, the T2 relaxation time was shorter in the ‘stick’ compartment or similar between compartments (Table 1). The corpus callosum exhibited a large variation in T2 relaxation times of ‘sticks’, which interestingly matches known variations in axon diameters12. The white matter lesions exhibited a reduced ‘stick’ fraction and an increased ‘ball’ T2 relaxation time (Fig. 1, Table 1). These changes were correlated and seemed to increase in tandem between lesions judged as ‘slight’ and ‘moderate’, while the ‘stick’ T2 relaxation time was comparatively unchanged (Fig. 1 and 2).Discussion
We used constrained analysis of b-tensor encoding data with multiple echo times to estimate compartment-specific T2 relaxation times and a relaxation-corrected ‘stick’ fraction. The results allowed a tentative interpretation of the ‘stick’ compartment as approximating axons and the ‘ball’ compartment as approximating extra-axonal space. That the T2 relaxation time of extra-axonal space should increase with a reduced axonal density, as suggested in Fig. 2, makes sense from the perspective of porous media science, since both T2 times and diffusivities generally increase when the volume fraction of solid materials decreases6. Furthermore, that the intra-axonal T2 relaxation times should be longer in regions with large axon diameters, as suggested in the cerebrospinal tract and the body of the corpus callosum, could be explained from a reduced axonal surface-to-volume ratio in large axons, with an associated decreased exposure of axonal water to lipids with exchangeable protons, which are abundant in brain lipid membranes13. The employed tortuosity constraint bears much similarity to a constraint that is commonly employed14-15, but also criticized16. Here, however, it was only employed in white matter and it relies on a relaxation-corrected fraction rather than on a relaxation-weighted signal fraction, which is a crucial distinction that makes the constraint more biophysically plausible. We acknowledge that the employed constraints could be incorrect and impact the estimation accuracy. However, the biophysical plausibility of our findings suggests that the error is small.Conclusions
Estimation of T2 relaxation times for separate tissue
compartments is possible in white matter using constrained modeling
of b-tensor encoding and multiple echo times, and could potentially be
useful for characterization of white matter damage.Acknowledgements
We thank Siemens Healthcare for providing access to the pulse programming environment.References
1. Chantal MW Tax, et al., Disentangling in two dimensions in the living human brain: Feasibility of relaxometry-diffusometry using ultra-strong gradients. Proceedings of the 25th Annual Meeting of ISMRM, Honolulu, Hawaii, USA, 2017. p. 838. 2017.
2. Mulkern, R.V., et al., Multi‐component apparent diffusion coefficients in human brain: Relationship to spin‐lattice relaxation. Magnetic resonance in medicine, 2000. 44(2): p. 292-300.
3. Clark, C.A. and D. Le Bihan, Water diffusion compartmentation and anisotropy at high b values in the human brain. Magnetic Resonance in Medicine, 2000. 44(6): p. 852-859.
4. Kalaria, R., I. Ferrer, and S. Love, Vascular disease, hypoxia and related conditions. Greenfield’s neuropathology, 2015. 9: p. 59-209.
5. Hills, B., K. Wright, and P. Belton, Proton NMR studies of chemical and diffusive exchange in carbohydrate systems. Molecular Physics, 1989. 67(6): p. 1309-1326.
6. Topgaard, D. and O. Söderman, Diffusion of water absorbed in cellulose fibers studied with 1H-NMR. Langmuir, 2001. 17(9): p. 2694-2702.
7. Veraart, J., E. Fieremans, and D. Novikov, Quantifying neuronal microstructure integrity with TE dependent Diffusion imaging (TEdDI). In Proceedings of the 25th Annual Meeting of ISMRM, Honolulu, HI, USA, 2017. p. 836. 2017.
8. Lasič, S., et al., Microanisotropy imaging: quantification of microscopic diffusion anisotropy and orientational order parameter by diffusion MRI with magic-angle spinning of the q-vector. Frontiers in Physics, 2014. 2: p. 11.
9. Westin, C.-F., et al., Q-space trajectory imaging for multidimensional diffusion MRI of the human brain. NeuroImage, 2016. 135: p. 345-362.
10. Szczepankiewicz, F. and M. Nilsson, Maxwell-compensated waveform design for asymmetric diffusion encoding. Submitted to Int. Soc. Magn. Reson. Med. Paris, France.
11. Sjölund, J., et al., Constrained optimization of gradient waveforms for generalized diffusion encoding. Journal of Magnetic Resonance, 2015. 261: p. 157-168.
12. Aboitiz, F., et al., Fiber composition of the human corpus callosum. Brain research, 1992. 598(1): p. 143-153.
13. O'Brien, J.S. and E.L. Sampson, Lipid composition of the normal human brain: gray matter, white matter, and myelin. Journal of lipid research, 1965. 6(4): p. 537-544.
14. Szafer, A., et al., Diffusion‐weighted imaging in tissues: Theoretical models. NMR in Biomedicine, 1995. 8(7): p. 289-296.
15. Zhang, H., et al., NODDI: practical in vivo neurite orientation dispersion and density imaging of the human brain. Neuroimage, 2012. 61(4): p. 1000-16.
16. Lampinen, B., et al., Neurite density imaging versus imaging of microscopic anisotropy in diffusion MRI: A model comparison using spherical tensor encoding. NeuroImage, 2017. 147: p. 517-531.
Figures