5235
Estimating axon diameter distributions beyond the physical limits of acquisition capabilities1CUBRIC, Cardiff University, Cardiff, United Kingdom
Synopsis
Estimation of axon diameter distributions (ADDs) is hindered by the fact that axon diameters below a certain limit, which are prevalent throughout the nervous system, are invisible to a diffusion MRI protocol. Here we propose a simple modification to the AxCaliber protocol where only the portions of the ADD that can feasibly generate a signal are modelled, by fitting to a truncated distribution. We show in simulations and human data acquired on a high-gradient (300mT/m) system that using this approach produces ADD estimates much closer to those observed in histology.
Introduction
Advanced diffusion MRI pipelines such as AxCaliber [1] and ActiveAx [2] allow the estimation of axon diameter distributions (ADDs) by varying diffusion times, Δ, and fitting the decay of the signal to different diffusion compartments. However, there is a fundamental limit to which axon diameters can be recovered with this technique, due to the smallest achievable value of Δ in an acquisition protocol [3]. In many brain structures, including the genu and splenium of the corpus calosum, the true ADDs [4] have an average diameter much smaller than can be measured in MRI. Here we propose a modification to the AxCaliber framework that addresses this limitation. Instead of fitting all parts of a theoretical distribution to the data, we truncate the distribution such that only points that can feasibly impact on the measured signal are fitted. We test this approach by fitting to a truncated distribution via simulation, and with human in vivo data obtained on a high gradient (300mT/m) system.Methods
Theory: The ADD is modelled by a continuous Poisson distribution:
$$P_{\mathrm{full}}(d)=\frac{\lambda^d e^{-\lambda}}{\Gamma(d+1)}$$
where d
is the axon diameter and λ is the
mean of the ADD. We use the limit derived in [3] to specify the point below which axon diameters do not contribute
to the signal:
$$d_{\mathrm{min}}=\left(\frac{768}{7}\frac{\sigma D_0}{\gamma^2\delta G_{\mathrm{max}}^2}\right)^{1/4}$$
where σ is the standard deviation of the noise, D0 is the diffusivity of free water (set to D0=2.92μm2/ms, γ is the gyromagnetic ratio, Gmax is the maximum gradient amplitude. Here we set σ=η where η is the noise parameter estimated from the AxCaliber model. The truncation of the ADD was performed by weighting with a logistic function centred on dmin.
$$S(d)=\frac{1}{1+e^{-k(d-d_{\mathrm{min}})}}$$
where k defines the steepness of the curve (k=12 in the current work). The truncated distribution is:
$$P_{\mathrm{trunc}}(d)=S(d)P_{\mathrm{full}}(d)$$
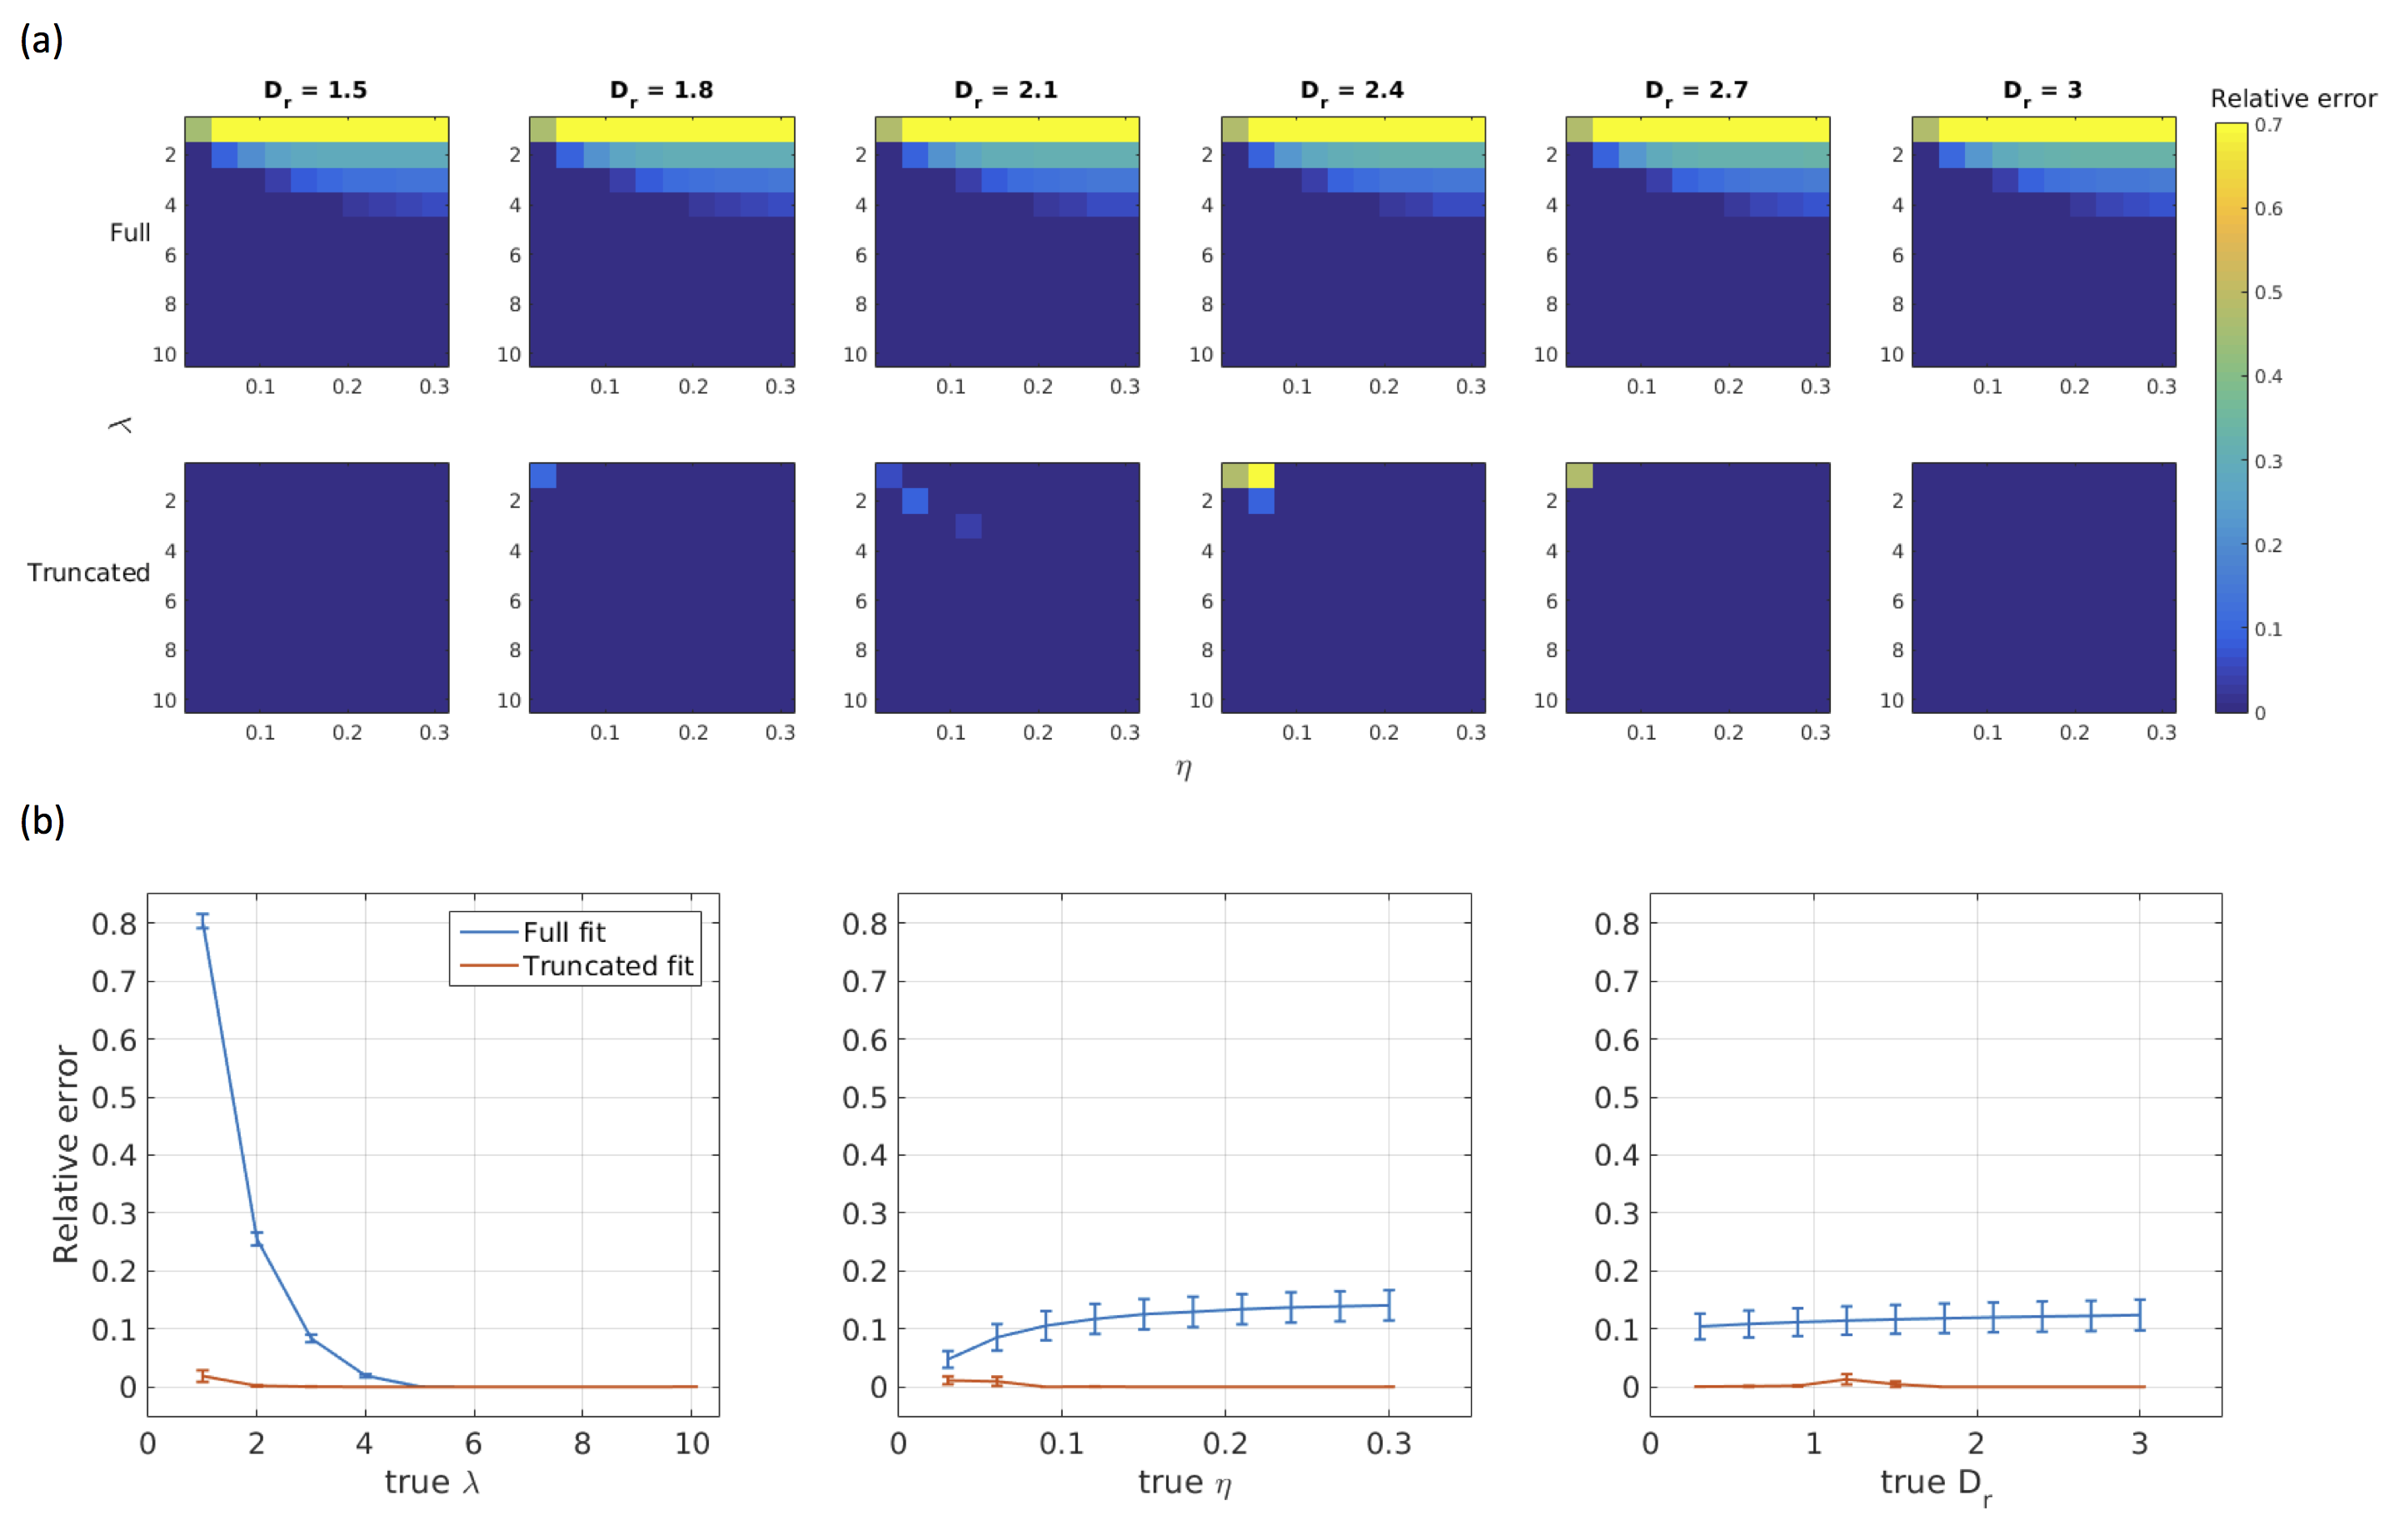
Simulations: Diffusion-weighted signals were simulated using the forward AxCaliber model for an assumed Poisson distribution of axon diameters. Data were simulated for a range of values for λ∈[1,10], η∈[0.03,0.30], and Dr∈[0.3,3.0], where Dr is the coefficient of restricted diffusion in the AxCaliber model. Simulated data were fitted to the AxCaliber model using both the full and truncated distribution using the non-linear Levenberg–Marquardt minimisation method with bounds on λ∈[0.01,50], η∈[0,1], Dr∈[0.1,3.0]. Model performance was assessed by computing the relative errors between the true and fitted values for λ.
Human data: Data were collected on a 3T Siemens CONNECTOM system, using a diffusion-weighted EPI acquisition. Parameters: δ=7ms, Δ=[17.3,29.3,44.3,58.3]ms; Gmax=300mT/m, TE=73ms, TR=4500ms. 2 shells: 30 directions at b=2000, 60 directions at b=4000. GRAPPA acceleration factor 2, multiband factor 2. 4 b=0 images, 2 with reversed phase encoding direction, were also acquired. Data were pre-processed using FSL. Motion, eddy currents and field inhomogeneities were corrected using EDDY and TOPUP and coregistered to a T1-wieghted scan. Data were fitted to the AxCaliber model using the same fitting used in simulations.
Results
Simulations: Results are shown in Figures 1 and 2. When the true λ is small, fitting the full distribution gives a relatively relative high error, compared to the truncated fit, which has uniformly very small relative errors. The relative error increases across values of η, which is to be expected since dmin increases as η increases. For example, at η=0.3, Dr=3 and λ=1μm, the fitted λ was 1.00μm for the truncated distribution compared to 1.91μm for the full distribution.
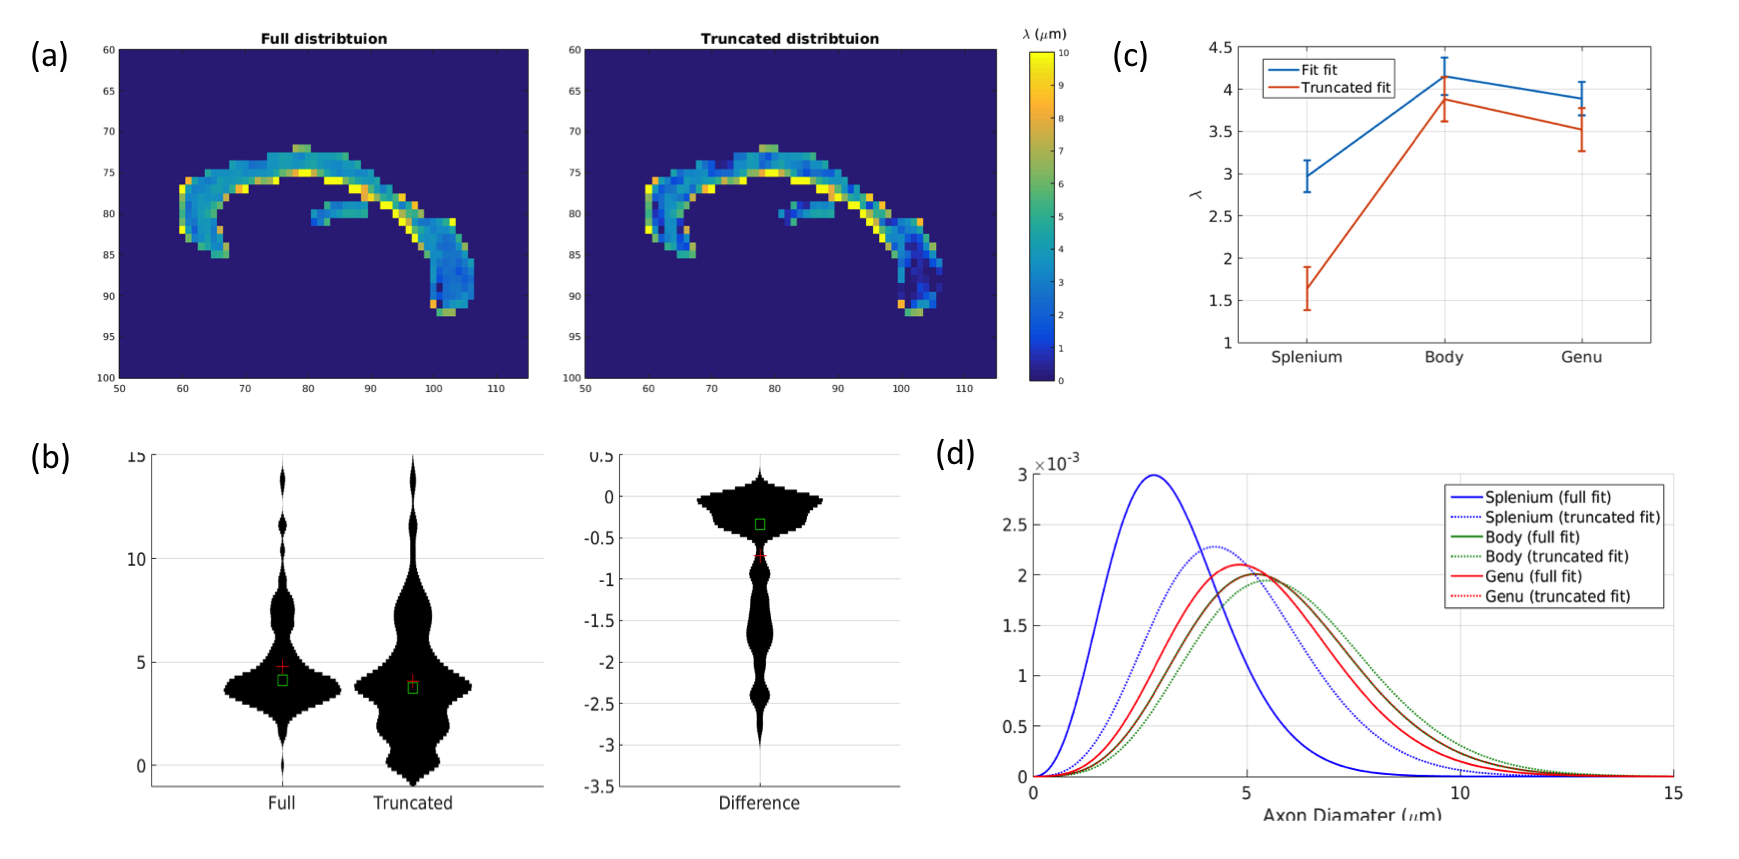
Human data: λ values fitted to the corpus callosum are shown in Figure 3. The average value of λ is significantly lower when using the truncated distribution than the full distribution (μdiff=-0.74±0.057, t=13.1, p<0.001). The distribution of λ values shown between the two fits shows much more weighting towards smaller values in the truncated fit compared to the full fit. The difference is most pronounced in the splenium but it also apparent in the body and genu.
Conclusions
We have shown in simulations and human data it is possible to overcome the physical limit of diameter resolution of axon diameters by fitting diffusion MRI data to only the portion of the ADD that leads to an observable change in the MRI signal. Compared to the standard approach, estimated ADDs from the truncated distribution are much closer to those obtained from histology. The approach should be tested on other parametric distributions, which better conform to ADDs obtained from histology, such as the gamma and generalised extreme value distribution [5]. These distributions have more parameters to fit and thus may be less well-conditioned in cases where dmin is large and very small changes in the MR-visible portion of the distribution can lead to very large changes in the fitted parameters. Another important consideration is how discrepancies between the true and modelled distributions can lead to fitting errors.Acknowledgements
This work was funded by a Wellcome Trust New Investigator Award (096646/Z/11/Z). We would like to thank Siemens Healthcare for valuable contributions to the acquisition protocol used in this study.References
1. Assaf Y, Blumenfeld T, Levin G, Yovel Y, Basser PJ. AxCaliber – A Method to Measure the Axon Diameter Distribution and Density in Neuronal Tissues. Proc. Int. Soc. Magn. Reson. Med. Seattle, Washington, USA; 2006. p. 637.
2. Alexander DC, Hubbard PL, Hall MG, Moore E A, Ptito M, Parker GJM, et al. Orientationally invariant indices of axon diameter and density from diffusion MRI. Neuroimage. Elsevier Inc.; 2010;52:1374–89.
3. Nilsson M, Lasič S, Drobnjak I, Topgaard D, Westin C-F. Resolution limit of cylinder diameter estimation by diffusion MRI: The impact of gradient waveform and orientation dispersion. NMR Biomed. 2017;e3711.
4. Liewald D, Miller R, Logothetis N, Wagner HJ, Schüz A. Distribution of axon diameters in cortical white matter: an electron-microscopic study on three human brains and a macaque. Biol. Cybern. 2014;108:541–57.
5. Sepehrband F, Alexander DC, Clark KA, Kurniawan ND, Yang Z, Reutens DC. Parametric Probability Distribution Functions for Axon Diameters of Corpus Callosum. Front. Neuroanat. 2016;10:1–9.
Figures