5234
Unified multi-modal characterization of microstructural parameters of brain tissue using diffusion MRI and multi-echo T2 data1Department of Radiology, Centre Hospitalier Universitaire Vaudois (CHUV), Lausanne, Switzerland, 2Signal Processing Laboratory 5 (LTS5), École Polytechnique Fédérale de Lausanne (EPFL), Lausanne, Switzerland, 3FIDMAG Germanes Hospitaláries, Barcelona, Spain, 4Center for Psychiatric Neuroscience, Department of Psychiatry, Centre Hospitalier Universitaire Vaudois (CHUV) and University of Lausanne (UNIL), Lausanne, Switzerland, 5Department of Radiology, Centre Hospitalier Universitaire Vaudois (CHUV) and University of Lausanne (UNIL), Lausanne, Switzerland, 6Medical Image Analysis Laboratory (MIAL), Centre d'Imagerie BioMédicale (CIBM), Lausanne, Switzerland, 7Centre d'Imagerie BioMédicale (CIBM)-AIT, École polytechnique fédérale de Lausanne (EPFL), Lausanne, Switzerland, 8Department of Pathology and Immunology, Geneva University Hospital and University of Geneva, Geneva, Switzerland, 9Laboratories of Neuroimmunology, Division of Neurology and Neuroscience Research Center, Department of Clinical Neurosciences, Lausanne University Hospital, Lausanne, Switzerland, 10Computer Science Department, University of Verona, Verona, Italy
Synopsis
In this study we propose a theoretical model to estimate different microstructure indices from diffusion MRI and multi-echo T2 (MET2) data. The proposed estimation framework takes into account the common and complementary information provided by both modalities. While the MET2 data allow us to model the myelin compartment, the diffusion data enable us to better characterize the intra-axonal and extra-axonal compartments. Results from numerical experiments support the hypothesis that the new unified estimation is more accurate than the alternative approach based on the individual sequential fitting of both image modalities. The performance was stable for noise levels commonly found in clinical protocols.
INTRODUCTION
Different diffusion models have been proposed to estimate the axon volume fraction (AVF) in white matter using clinical protocols1,2,3. However, due to the long echo time (TE) employed in diffusion experiments, the signal from myelin is very low and only the relative but not the absolute AVF can be estimated4. Recently, a new approach to combine the myelin volume fraction (MVF) obtained from magnetization transfer and the relative AVF computed from NODDI1 was proposed5. In that methodology, the absolute AVF and the myelin g-ratio are estimated by fitting each dataset to its corresponding signal model5. Despite its advantages, there are some remaining methodological limitations that should be addressed. For instance, the nonlinear fitting of multi-compartmental diffusion models, such as NODDI, suffers from heavy bias and poor precision6. Besides, the current diffusion models for datasets acquired with a single TE do not include the differential T2 relaxation times for all compartments. This can bias the volume fractions estimation in voxels with partial volume effects, such as those located in brain structures that border cerebrospinal fluid (CSF). In order to overcome these limitations, we propose a unified multi-modal model using diffusion MRI and multi-echo T2 (MET2) data. It allows to estimate, throughout a joint fitting approach, the volume fractions, diffusivities and T2 times of the intra-axonal, extra-axonal and myelin compartments.
METHODS
MET2 model: the multi-echo signal is modeled as a function of TE as:
$$ M(TE)=k_{1}N_{t}\left(f_{int}e^{-\frac{TE}{T_{2}^{int}}}+f_{ext}e^{-\frac{TE}{T_{2}^{ext}}}+f_{m}e^{-\frac{TE}{T_{2}^{m}}}+f_{csf}e^{-\frac{TE}{T_{2}^{csf}}}\right), \qquad [1] $$
where $$$k_{1}$$$ is a constant, $$$ N_{t} $$$ is the number of spins within the voxel, $$$ f_{int},f_{ext},f_{m},f_{csf} $$$ and $$$ T_{2}^{int},T_{2}^{ext},T_{2}^{m},T_{2}^{csf} $$$ are the absolute water fractions and T2 relaxation times of the intra-axonal, extra-axonal, myelin and CSF compartments, respectively.
Diffusion MRI model: the diffusion signal is modeled using the Spherical Mean Technique3 (SMT). However, we extended the SMT framework in two aspects. First, we included a free water compartment to model separately the contributions from extra-axonal and CSF compartments. Second, we included the signal decay due to different T2
relaxation times in different compartments:
$$ e(b)=k_{2}\acute{N_{t}}\left(\acute{f_{int}}e^{-\frac{\overline{TE}}{T_{2}^{int}}}e_{int}(b)+\acute{f_{ext}}e^{-\frac{\overline{TE}}{T_{2}^{ext}}}e_{ext}(b)+\acute{f_{csf}}e^{-\frac{\overline{TE}}{T_{2}^{csf}}}e_{csf}(b)\right), \qquad [2] $$
where $$$ e(b) $$$ is the spherical mean of the diffusion
signal $$$ S(b) $$$ for a given b-value and $$$ e_{int},e_{ext},e_{csf} $$$ are the spherical means of the normalized signals coming from the intra-axonal,
extra-axonal and CSF compartments, $$$k_{2}$$$ is
a constant, $$$
\acute{N_{t}}
$$$ is the number of spins within the voxel without
taking into account the myelin compartment, $$$
\overline{TE}
$$$ denotes the diffusion echo-time and $$$
\acute{f_{int}},\acute{f_{ext}}, \acute{f_{csf}}
$$$ are the relative water fractions.
Cross-modal relationships: assuming both modalities have the same voxel-size, Eq.[2] can be rewritten in terms of absolute water fractions:
$$ e(b)=k_{2}N_{t}\left(f_{int}e^{-\frac{\overline{TE}}{T_{2}^{int}}}e_{int}(b)+f_{ext}e^{-\frac{\overline{TE}}{T_{2}^{ext}}}e_{ext}(b)+f_{csf}e^{-\frac{\overline{TE}}{T_{2}^{csf}}}e_{csf}(b)\right). \qquad [3] $$
The initial value for the constant term $$$
k_{1}N_{t} $$$ was computed using a linear inversion approach7, and term $$$
k_{2}N_{t} $$$ was derived from the relationship:
$$ \frac{M(\overline{TE})}{S(\overline{TE},b=0)}\thickapprox\frac{k_{1}N_{t}}{k_{2}N_{t}}. \qquad [4] $$
Global fitting: the joint estimation for all parameters is performed by minimizing the following composite cost-function, which depends on Eq.[1] and Eq.[3]:
$$ min\{c_{1}\sum_{j}(M(TE_{j})-\widetilde{M}(TE_{j}))^{2}+c_{2}\sum_{i}(e(b_{i})-\widetilde{e}(b_{i}))^{2}\}, \qquad [5] $$
where $$$ \widetilde{M} $$$ is the measured MET2 signal and $$$ \widetilde{e} $$$ is the spherical mean computed from the diffusion data; $$$ c_{1} $$$ and $$$ c_{2} $$$ are constants that depend on the signal-to-noise ratio (SNR) and the number of
data points for each modality.
Synthetic data: the MET2 imaging protocol consisted in 32 TE-values, $$$TE=(10,20,...,320)*10^{-3} s$$$. The diffusion protocol used three b-values $$$(b_{1}=625s/mm^{2}, b_{2}=1250s/mm^{2}, b_{3}=2500s/mm^{2})$$$ with 64 measurements per shell and $$$ \overline{TE}=85*10^{-3}s$$$. Simulated signals for different microstructural parameters where generated. Rician noise was added with $$$SNR=30,25,20,10$$$.
In the evaluation, the following assumptions were made: $$$ T_{2}^{int}=T_{2}^{ext},T_{2}^{csf} = 2s,D_{csf}=3.0 mm^{2}/s $$$.
RESULTS
Figure 1 and 2 depicts results from numerical simulations. In figure 1 the unified estimation framework is compared with the alternative approach based on the individual
fitting of both modalities. The unified method was more accurate and stable. Figure
2 shows the performance of the new method for different noise levels commonly found in clinical acquisition protocols.
DISCUSSION AND CONCLUSION
A theoretical model for the joint estimation of different microstructure indices from diffusion MRI and MET2 data was proposed. The developed framework improves the reconstruction process by using the common and complementary information provided by both modalities. While the MET2 data allow us to model the myelin compartment, the diffusion data enable us to better characterize the intra-axonal and extra-axonal compartments. In order to discriminate microscopic tissue features from fiber dispersion, the diffusion data was modeled using the SMT method, which was extended to also include T2 relaxation. Shortly the proposed technique will be validated in real data.
Acknowledgements
Supported by the Faculty of Biology and Medicine Research Commission Fund, University of Lausanne.References
1. Zhang et al., NODDI: practical in vivo neurite orientation dispersion and density imaging of the human brain, Neuroimage 61(4):1000-16 (2012)
2. Daducci et al., Accelerated Microstructure Imaging via Convex Optimization (AMICO) from diffusion MRI data, Neuroimage 105:32-44 (2015)
3. Kaden et al., Multi-compartment microscopic diffusion imaging. NeuroImage,139, 346–359 (2016)
4. Campbell et al., Promise and pitfalls of g-ratio estimation with MRI. NeuroImage (In Press, 2017)
5. Stikov et al., In vivo histology of the myelin g-ratio with magnetic resonance imaging. Neuroimage, 118:397-405 (2015)
6. Jelescu et al. Degeneracy in model parameter estimation for multi-compartmental diffusion in neuronal tissue. NMR Biomed., 29, 33–47. (2016)
7. MacKay et al. In vivo visualization of myelin water in brain by magnetic resonance. Magn Reson Med. 31: (6):673–7. (1994)
Figures
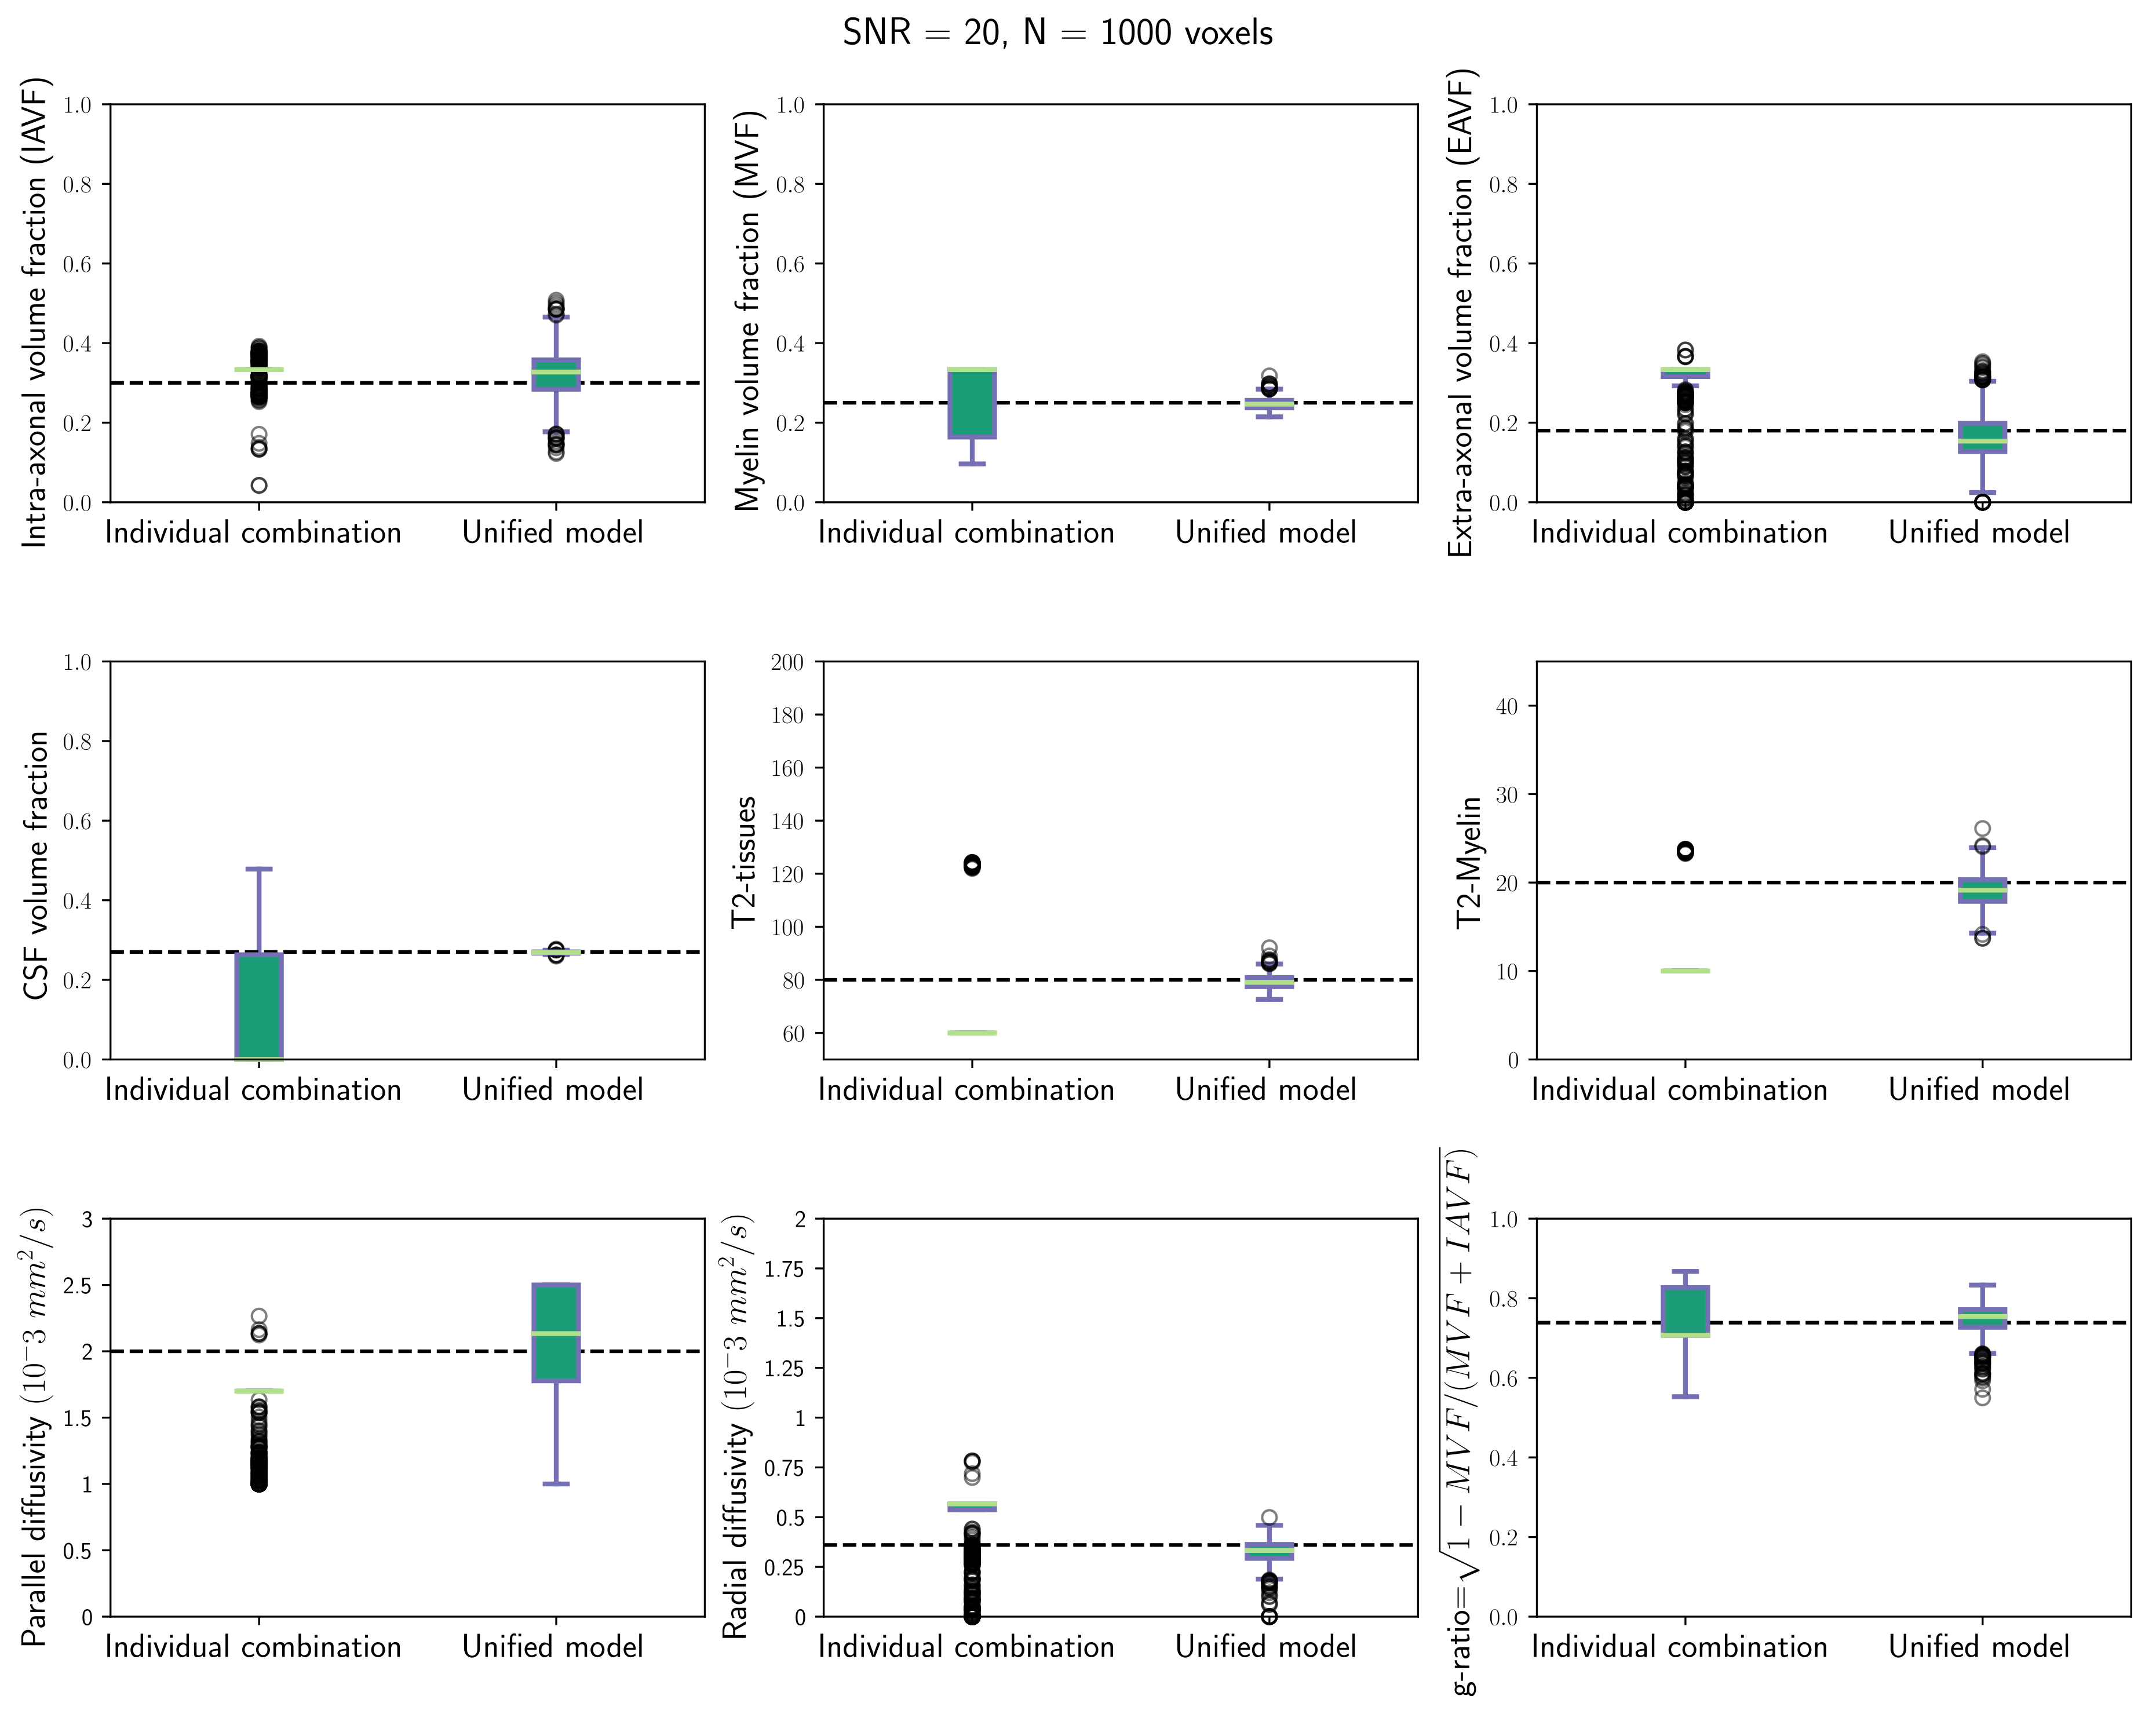
Figure 1. Box-plots from numerical simulations comparing the proposed unified model and the individual combination of both modalities (i.e., it is based on computing the myelin volume fraction and the T2 values using the MET2 model, and then fitting the extended Spherical Mean Technique model using these values as fixed parameters). Results correspond to Rician noise with SNR=20 and 1000 different repetitions. The figure depicts the estimated volume fractions and T2 times of the intra-axonal, extra-axonal and myelin compartments, parallel and radial diffusivities and the g-ratio. The black discontinuous lines at each plot show the real values used to generate the simulated signals.
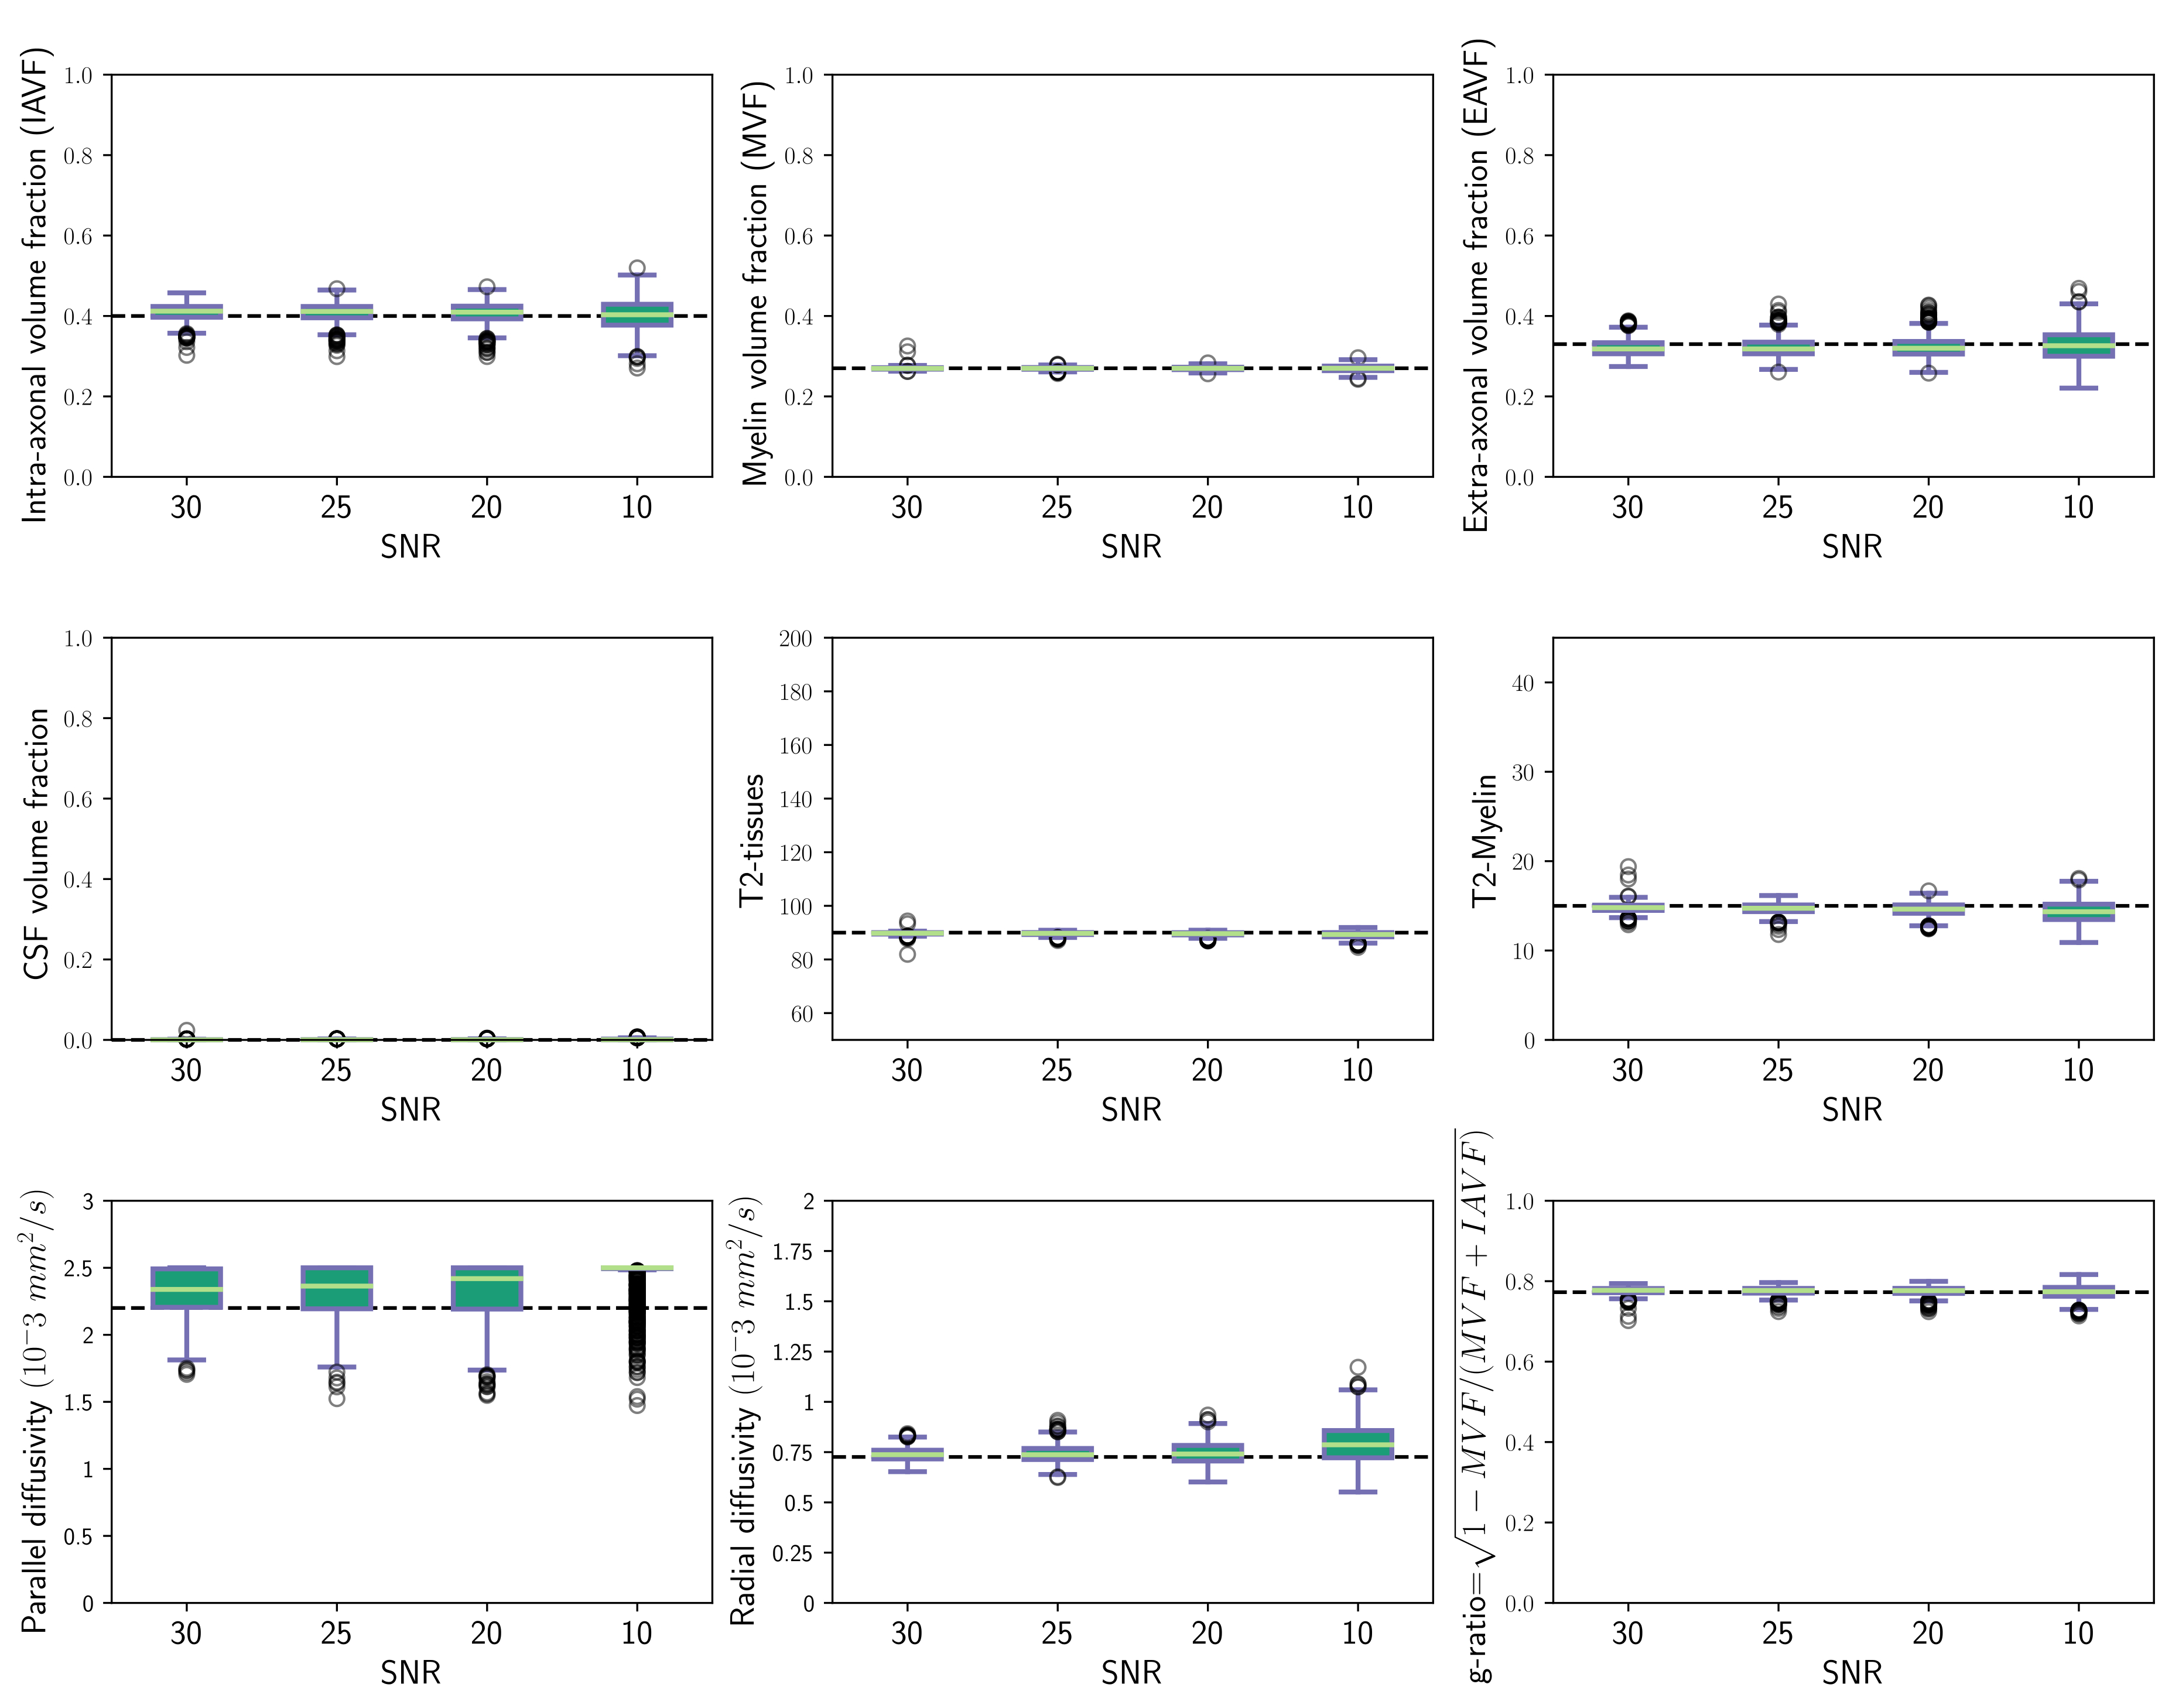
Figure 2. Box-plots from numerical simulations testing the proposed unified model as a function of the signal-to-noise ratio (i.e., SNR=30, 25, 20 and 10). For each SNR, 1000 different repetitions were generated. The figure depicts the estimated volume fractions and T2 times of the intra-axonal, extra-axonal and myelin compartments, as well as the parallel and radial diffusivities and the myelin g-ratio. The black discontinuous lines at each plot show the real values used to generate the simulated signals.